Munich Personal RePEc Archive
A panel study on the relationship
between corruption and government size
Go, Kotera and Okada, Keisuke and Samreth, Sovannroeun
Graduate School of Economics, Kyoto University, Japan
February 2010
Online at
https://mpra.ub.uni-muenchen.de/21519/
A panel study on the relationship between corruption
and government size
Go Kotera
Graduate School of Economics, Kyoto University, Japan
Keisuke Okada∗
Graduate School of Economics, Kyoto University, Japan
Sovannroeun Samreth
Japan Society for the Promotion of Science (JSPS) Graduate School of Economics, Kyoto University, Japan
February 2010
Abstract
Using panel data from 1996 to 2005, this paper shows that the effect of government size on corruption is positive at a low level of democracy, but it is negative at a high level. This finding could fill the gaps in previous studies whose findings on the relationship between corruption and government size are controversial.
Keywords: Corruption; Government size; Democracy; Panel data
JEL Classification: C23; D73; H11
1
Introduction
Corruption is a main factor that hinders economic growth, reduces government’s legitimacy, and affects political stability across time and countries (e.g., Mauro, 1995 and La Porta et al., 1999). For this reason, searching for a mechanism to determine corruption has been conducted by many studies, including Treisman (2000), Serra (2006), Billger and Goel (2009) and Saha et al. (2009). Some exam-ine corruption by considering government size. La Porta et al. (1999) conclude that a large government has lower corruption level due to stronger checks and bal-ances. On the other hand, Rose-Ackerman (1999) argues that large government
∗Corresponding author: Graduate School of Economics, Kyoto University,
affects bureaucracy efficiency and increases corruption. More recently, Billger and Goel (2009) examine the sensitivity of determinants to the conditional distribu-tion of corrupdistribu-tion across countries. Although they show that larger government generally decreases corruption, but in the most corrupt countries, the effect is insignificant.
As seen from the above studies, the results on the effect of government size on corruption are mixed. Based on the analysis of 140 countries’ panel data from 1996 to 2005, this paper contributes to the literature about corruption by providing a new empirical analysis on the relationship between government size and corruption. We consider the effect of the interaction between government size and democracy, which has not been considered in previous studies to the best of our knowledge. This approach is interesting because democracy is deemed a factor that reflects government transparency or a kind of yardstick to explain the effect of government size on corruption. Since corruption is a severe problem especially faced by developing countries, this study focuses on them. However, we also provide the results of full countries sample for comparison.
2
Estimation Methodology and Data
To measure the effect of government size on corruption based on the level of democracy, the estimation equation is specified as below:
corruptioni,t =α0+α1govsizei,t+α2democracyi,t (1)
+α3govsizei,t×democracyi,t+Xi,t′ Λ +εi,t,
where i and t are the country identity and the time series; govsize stands for government size; X is a vector of the variables that may also influence the cor-ruption; Λ is a coefficient vector; εis an error term. X includes the logarithms of per capita GDP, the political stability, the economic freedom, the urbanization, the regulatory quality and regional dummies.
From Eq. (1), the net effect of government size on corruption can be calculated as follows:
∆corruptioni,t
∆govsizei,t
=α1+α3democracyi,t. (2)
From Eq. (2), the impact of government size on corruption is a function of the level of democracy. As previously mentioned, this paper focuses on developing or non-OECD countries. However, we also conduct the estimation for the case of full counties for comparison.
in 140 countries, 110 of which are non-OECD and defined as developing coun-tries. The sample period and the numbers of countries are selected based on data availability. The data definitions and sources are summarized in Table 1.
3
Empirical Results
Table 2 reports the estimation results in the developing countries. Columns (1), (2) and (3) are the results of pooled ordinary least squares (OLS) estimation. In column (1), the independent variables contain only government size, democracy and their interaction term. The coefficient of government size is insignificant. This may be due to the problem of omitted variables. To avoid this problem, to column (2) we add variables that may influence corruption, as indicated by many previous studies. The negative effects of income, political stability, economic freedom and regulatory quality on corruption are consistent with such previous studies as La Porta et al. (1999) and Treisman (2000). Column (3) shows the results when four regional dummies are added simultaneously to control the time invariant regional specific effect.
Columns (4) and (5) report the results of fixed effects (FE) and random effects (RE) estimations. Based on the Hausman test, FE estimation is preferable to RE estimation. Note that FE estimation can solve the endogeneity problems at some level if they arise from the correlation between country specific and error terms. Since FE estimation considers the country specific effects, we can obtain the unbiased coefficients even if the unobserved country specific term is correlated with the error term. Hence, this paper concentrates on FE estimation. Since income, economic freedom and regulatory quality have negative effects on corruption, it is reasonable to judge that our FE estimation results are plausible.
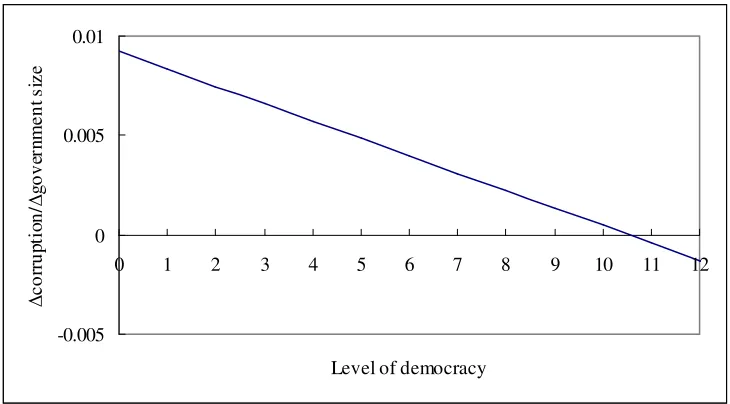
Fig. 1 captures the effect of government size on corruption with the level of democracy based on the FE estimation results for developing countries. Although the pooled OLS results indicate that this effect is negative regardless of the level of democracy, the FE estimation result suggests that it is positive at a low level of democracy. One possible explanation is that, in less democratic countries, the increase in government size may lead to more opportunities for rent seeking, worsening the corruption level.
extent. Fig. 2 provides the result of the partial effects of government size on corruption for full countries. Given Figs. 1 and 2, there is a possibility that these effects are undervalued, particularly for countries with a medium level of democracy.
Our above results provide evidence that the impact of government size on cor-ruption can be positive or negative depending on the country’s level of democracy. This finding might help fill the gap in the previous studies that find controversial results on the relationship between corruption and government size.
4
Conclusion
This paper empirically examines the relationship between government size and corruption. Our estimation results suggest that the effect of government size on corruption is positive at a low level of democracy and negative at a high level of democracy. This finding sheds light on how to explain the controversial findings of previous studies on the relationship of corruption and government size. Although panel estimation with instrumental variables is not considered in our estimation methodology, the endogeneity problems are slightly improved by using fixed effects (FE) estimation. Future work includes a more profound study using instrumental variables.
Acknowledgements
References
Billger, S. M. and R. K. Goel, 2009, Do existing corruption levels matter in controlling corruption? Journal of Development Economics 90, 299-305.
La Porta, R., F. Lopez-de-Solanes, A. Schleifer and R. Vishny, 1999, The quality of Government, Journal of Law, Economics and Organization 15, 222-279.
Mauro, P., 1995, Corruption and growth, Quarterly Journal of Economics 110, 681-712.
Rose-Ackerman, S., 1999, Corruption and Government, Cambridge University Press, Cambridge.
Saha, S., R. Gouder and J. Su, 2009, The interaction effect of economic freedom and democracy on corruption: a panel cross-country analysis, Economics Letters 105, 173-176.
Serra, D., 2006, Empirical determinants of corruption: a sensitivity analysis, Public Choice 126, 225-256.
Table 1: Data definitions and sources
Variables Definitions Sources
Transparency International’s corruption perception index (CPI) ranges from
Corruption 0 to 10. Our corruption index equals 10 minus CPI. Transparency International Range: 0 (least corrupt) to 10 (most corrupt).
Government size index equals 100 minus government size score reported
Government size by Heritage Foundation. It considers not only expenditures by central but also Heritage Foundation local governments.
Range: 0 (smallest) to 100 (largest).
Political rights and civil liberties range from 1 (best) to 7 (worst).
Democracy Democracy index equals 14 minus sum of political rights and civil liberties. Freedom House Range: 0 (least democratic) to 12 (most democratic).
GDP per capita GDP per capita (constant 2000 US$) World Development Indicators 2007 Perceptions on likelihood that unconstitutional or violent means will destabilize
Political stability or remove government from power. Worldwide Governance Indicators Range: -2.5 (instable) to 2.5 (stable)
Average of seven indicators (i.e., business freedom, trade freedom, fiscal freedom,
Economic freedom monetary freedom, investment freedom, financial freedom and property rights). Heritage Foundation Range: 0 (least free) to 100 (freest).
Urbanization Urban population (% of total) World Development Indicators 2007 Perceptions of government’s ability to formulate/implement policies and regulations
Regulatory quality to permit/promote private sector development. Worldwide Governance Indicators Range: -2.5 (worst) to 2.5 (best)
Regional dummies Africa, Asia, Europe, Latin America, North America and Oceania are categorized http://www.un.org/depts/dhl/maplib following the United Nations’ world region categorization. /worldregions.htm
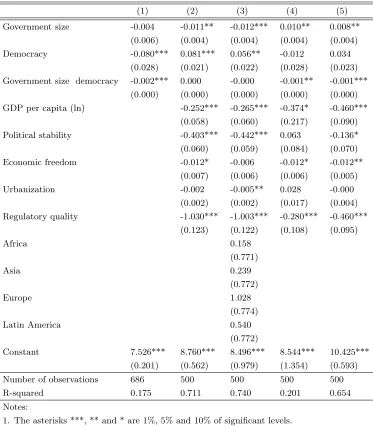
Table 2: Estimation results in developing countries
Dependent variable: Corruption
(1) (2) (3) (4) (5) Government size -0.004 -0.011** -0.012*** 0.010** 0.008**
(0.006) (0.004) (0.004) (0.004) (0.004) Democracy -0.080*** 0.081*** 0.056** -0.012 0.034
(0.028) (0.021) (0.022) (0.028) (0.023) Government size democracy -0.002*** 0.000 -0.000 -0.001** -0.001***
(0.000) (0.000) (0.000) (0.000) (0.000) GDP per capita (ln) -0.252*** -0.265*** -0.374* -0.460***
(0.058) (0.060) (0.217) (0.090) Political stability -0.403*** -0.442*** 0.063 -0.136* (0.060) (0.059) (0.084) (0.070) Economic freedom -0.012* -0.006 -0.012* -0.012**
(0.007) (0.006) (0.006) (0.005) Urbanization -0.002 -0.005** 0.028 -0.000
(0.002) (0.002) (0.017) (0.004) Regulatory quality -1.030*** -1.003*** -0.280*** -0.460***
(0.123) (0.122) (0.108) (0.095)
Africa 0.158
(0.771)
Asia 0.239
(0.772)
Europe 1.028
(0.774)
Latin America 0.540
(0.772)
Constant 7.526*** 8.760*** 8.496*** 8.544*** 10.425*** (0.201) (0.562) (0.979) (1.354) (0.593) Number of observations 686 500 500 500 500 R-squared 0.175 0.711 0.740 0.201 0.654 Notes:
Table 3: Estimation results in full countries
Dependent variable: Corruption
(1) (2) (3) (4) (5) Government size 0.010 0.000 0.003 0.009** 0.012***
(0.006) (0.005) (0.005) (0.004) (0.004) Democracy -0.119*** 0.136*** 0.128*** -0.032 0.021
(0.027) (0.021) (0.021) (0.026) (0.022) Government size democracy -0.004*** -0.001*** -0.002*** -0.000* -0.001***
(0.000) (0.000) (0.000) (0.000) (0.000) GDP per capita (ln) -0.424*** -0.484*** -0.039 -0.673***
(0.058) (0.057) (0.206) (0.091) Political stability -0.541*** -0.515*** 0.032 -0.165**
(0.068) (0.065) (0.075) (0.068) Economic freedom -0.019** -0.010 -0.009 -0.010* (0.007) (0.007) (0.005) (0.005) Urbanization 0.000 -0.001 0.021 0.001
(0.002) (0.002) (0.016) (0.005) Regulatory quality -1.028*** -0.994*** -0.310*** -0.473***
(0.133) (0.127) (0.094) (0.088)
Africa 1.099***
(0.267)
Asia 1.479***
(0.263)
Europe 1.953***
(0.250)
Latin America 1.725***
(0.263)
North America 0.713**
(0.340)
Constant 7.673*** 9.775*** 8.421*** 5.453*** 11.626*** (0.221) (0.607) (0.644) (1.378) (0.585) Number of observations 998 707 707 707 707 R-squared 0.521 0.521 0.854 0.166 0.800 Notes:
Figure 1: Partial effects of government size on corruption in developing countries
-0.015 -0.01 -0.005 0 0.005 0.01 0.015
0 1 2 3 4 5 6 7 8 9 10 11 12
Level of democracy
Δ
cor
rupt
ion/
Δ
gove
rnment
size
Figure 2: Partial effects of government size on corruption in full countries
-0.005 0 0.005 0.01
0 1 2 3 4 5 6 7 8 9 10 11 12
Level of democracy
Δ
c
or
rup
ti
o
n/
Δ
g
ove
rn
m
e
nt
s
iz
[image:10.595.122.487.483.685.2]