http://dx.doi.org/10.4236/ojbm.2016.42034
How to cite this paper: Xiong, Y., Sun, S.P., Wang, Z.C., Wang, K. and Liu, L. (2016) Application of Structural Breakpoint Test to the Correlation Analysis between Crude Oil Price and U.S. Weekly Leading Index. Open Journal of Business and Man-agement, 4, 322-328. http://dx.doi.org/10.4236/ojbm.2016.42034
Application of Structural Breakpoint Test to
the Correlation Analysis between Crude Oil
Price and U.S. Weekly Leading Index
Yi Xiong*, Shaopeng Sun, Zicheng Wang, Ke Wang, Li Liu
School of Business, China University of Petroleum, Beijing, China
Received 19 March 2016; accepted 24 April 2016; published 27 April 2016
Copyright © 2016 by authors and Scientific Research Publishing Inc.
This work is licensed under the Creative Commons Attribution International License (CC BY).
http://creativecommons.org/licenses/by/4.0/
Abstract
The paper examines the relationship between crude oil price and U.S. weekly leading index. The relationship between these two variables was unstable in long-run, so we explored the structural breakpoints from January 1995 to August 2015 by Bai-Perron breakpoint test. The results show that the causal relationships between two variables in different periods are different. We distin-guish different periods from the breakpoints, and explain the main reasons for change of the ca-sual relationships. Through this theory, the market can have a better prediction for the crude oil price base on weekly leading index.
Keywords
Crude Oil Price, U.S. Weekly Leading Index, Structural Breakpoint
1. Introduction
In general, the U.S dollar index is assumed to have a stable relationship with crude oil price. One can use a lot of variables, such as supply, demand, production, geopolitics and U.S. dollar index, to predict the future crude oil price. Among these variables, the U.S. dollar index is a sign of confidence from the market for the US economy. While the dollar index is also needed to be forecast, we choose another variable, U.S. weekly leading index (WLI), to replace U.S. dollar index to predict future crude oil price. WLI is a forward-looking composite leading index that anticipates cyclical turning points in U.S. economic ability by 2 - 3 quarters. The data are calculated by Economic Cycle Research Institute (ECRI). WLI is a useful tool for investors and government to predict the future dollar index. WLI is easier to get than dollar index, and dollar index is hysteretic. The paper believes that
market can predict crude oil index with WLI index. It has been proved by a lot of papers that the relationship between oil price and other relevant variables is not stable in long-run. The main reason for this problem is structural breakpoint which divides the time period to rebuild the causality relationship between oil price and other factors. To find the relationship between oil price and WLI index, we analyze the relationship between the oil price and WLI index by structural breakpoint test. This paper contained data from January 1995 to August 2015. According to Figure 1, the crude oil price increased gradually from $18 a barrel in 1995 to $143 a barrel in 2008. While the oil price started falling since the second half of year 2008, and had declined to $33/barrel in the end of 2008, mainly due to the subprime crisis. Then the oil price showed a continuous increasing trend soon. In the next 6 years after 2008, the oil price was stable between $80 and $110 a barrel. The price suffered a big drop in August 2014, this trend was still continuing by August 2015. The dramatic fluctuation of oil price make traditional commodity market broke the price fluctuation law. While according the historical data, WLI reflects the market condition well through the process.
Figure 1 describes a long-term trend of the crude oil price and WLI. The crude oil price kept low before 2002, while the WLI generally kept steady. Since 2002, both oil price and WLI started to rise at the same time, and this trend lasted until the second half of year 2008. Then the crude oil price fell sharply during the financial cri-sis in 2008. Meanwhile, the WLI only experienced a transitory fall but not a sharp fall. After the financial cricri-sis, the crude oil and WLI rose sluggishly at the same time. The WLI index kept flat since 2013, but the oil price began to decline in 2014. From the historical data analysis, it was found that there was a certain correlation be-tween oil price and WLI index before 2014. While after 2014, the main reason for the big change of two va-riables may be examined.
Most researches on relationship among crude oil price and relevant variables focused on the global factors that affect the price. The research on the correlation of gold and crude oil prices began in the early 21st century. Colin Lawrence (2003) had verified the correlation that existed in crude oil and gold prices, and found that the rise of the oil price is one of the kernel factors of higher gold prices [1]. Ying Zhang (2007) analyzed the data of crude oil price and gold prices during period 2002-2006 and found that the crude oil price is the Granger reason of the gold price, then they concluded that there was an equilibrium relationship in long-term between them [2]. Zhang YJ (2010) analyzed the interaction of price fluctuation between oil and gold in three aspects: price co- integration relationship, causality, and the price discovery. The experimental results showed that a significant positive correlation existed in the crude oil and gold prices. Ying Wang verified that there was a positive corre-lation between gold prices and crude oil prices from January 1971 to April 2010; there was also a causal rela-tionship between the rising crude oil prices and the rising gold price, and this was a one-way, long-term and sta-ble causal relationship [3]. Wan-Xiu Zheng, Ya-Hui Wu (2010) calculated the volatility spillover effect of crude oil and gold prices by using the VARMA-GARCH model, and found out that the volatility spillover effect from gold prices to crude oil prices is unidirectional in the period of strong-dollar; while it manifested a unidirectional volatility spillover effect from crude oil prices to gold prices during the period of weak-dollar [4]. Some articles focused on the relationship between oil price and U.S. dollar index. Dongping Liu et al. (2012) examined the
relationship among oil price, gold price, stock index and U.S. dollar index. They found the relationship between dollar index and oil price was not stable. The relationship had changed by the year of 2008 from positive to neg-ative [5]. Jianbo Sun explored the correlation between U.S. dollar index and the oil price with the VECM model. Although the author found the relationship between these two variables, the result is not significant. In fact the author explained the special time point to rebuild the data information [6]. Most researches used quantitative analysis to find the stable relationship between different factors and the oil price. But the results showed a low and unstable correlation. In this paper, we will analyze the relationship between WLI index and oil price. WLI shows the confidence of the market, and the dollar index could be predicted by the WLI index. WLI is the main factor that caused dollar index changes. So if we could predict the oil price by analyzing the relationship be-tween WLI and oil price.
From the relevant references, we can find that: First of all, most scholars would like to choose typical va-riables to do time series quantitative analysis, and carry out their research based on the data unit root attributes. What’s more, the researches on the co-integration are more accurate compared with the previous researches which ignored the stationary of the data. Secondly, most researches focused on verifying the long-range correla-tions that existed in relevant variables and oil prices. So the conclusion generally is to distinguish the existence of the correlation meticulously between them in different time interval. Therefore, in order to analyze the corre-lation between oil prices and relevant factors more carefully, this paper selects the way of Bai-Perron multiple structural breakpoint test. Bai-Perron multiple structural breakpoint test is a method of endogenous structural mutation. This method doesn’t need to estimate the structural break before the analysis. We can find more structural break points than one in a long time period though Bai-Perron. And we can divide the whole time in-terval into several parts by the breakpoints. Finally, by Granger causality test we can build more efficient model to predict the future oil price.
2. Theoretical Analysis
2.1. Augmented Dickey-Fuller Test
Augmented Dickey-Fuller test has multiple forms: now drift term and time trend. The following paragraph takes a form which contains both drift and time trend form as an example.
1 1
1
.
p
t t i t t
i
y α γy− θ β y− ε =
∆ = + + +
∑
∆ + (1)In this model, null hypothesis is “there are at least a unit root”, while alternative hypothesis is “none unit root exists”. For most economic series, they have the problems of stationary and time trend. Sequence may contain constant and time trend. It mainly depends on the estimate value of ф to judge, if the result accept the null hy-pothesis then we could determine whether there is a unit root exists during the AR (p). If the original sequence has none unit root, then we could reject the null hypothesis. And we can certain that the original sequence is a stable series. If the original sequence has unit roots, then we accept the null hypothesis. And we can get the con-clusion that the original sequence isn't a stable series.
2.2. Phillips and Perron Test
Besides Augmented Dickey-Fuller test, this paper uses Phillips and Perron test method as the unit root test. P-P test has the same null hypothesis and alternative hypothesis with the ADF test. Accepting the null hypothesis means there is a unit root which means the original series rejects the null hypothesis. This paper tests the statio-narity of variables and processes the series through unit root test. The test of P-P is a stricter unit root test than ADF test. With the P-P test, we can verify the stationary of the variable more precisely.
2.3. Co-Integration Test
Johansen Co-integration Test is a residual error correction process which is based on the VAR model (k). The final form of the test is shown below
1
1 1
1
.
k
t i t t t
i
X X X µ ε
−
− −
=
In this model, Xtis a p * 1 order vector of the variables. As a long-term impact matrix, Π summarizes all the
long running information in the process of Xt, and the sequence of Π determines the quantity of co-integration
vector in the system. εt is an independent identically distributed multivariate Gaussian process, and μ is the
in-tercept term.
The main purpose of the co-integration test is to find whether there is a stable relationship between variables in the long term. If there is a co-integration relationship, it means that there will always be a stable relationship between variables in long-run. But if there is no co-integration relationship, it means the relationship between variables is unstable. Once there is a co-integration relationship between different variable, we could test wheth-er thwheth-ere is a structural breakpoint between diffwheth-erent variables.
To draw a conclusion of structural breaks, this paper tries to prove that there is no long-term co-integration relationship.
2.4. Bai-Perron Multiple Structural Break Point Test
Assuming there are m structural breakpoints in the linear regression model which the length of time is T, we can get the form of the model:
1 1, 2, , .
t i i j i
y =x′β+z′σ +u t= T
2 1, 2, , .
t i i j i i i
y =x′β+z′σ +u t= +T T + T
1, 2, , .
t i i j i m m
y =x′β+z′σ +u t=T + T + T (3)
In this model, yi is the independent variable. xi and zi are dependent variables. Β and δj are the
coeffi-cient variables. ui is the residual term. Ti is the time when structure break points happen. Bai-Perron test mainly
depend on Sup Wald test and statistics test. If time-series data has structural breakpoints, then we could build different kinds of model in different period by the structural breakpoints. Bai-Perron structural breakpoint test works efficiency because other methods only can test one or two structural breakpoints [7].
3. Empirical Test
The crude oil price is WTI spot price from EIA, and the WLI index data is from ECRI. And we choose the weekly data from January 1995 to August 2015.
Most economic and financial data are unstable data, so we take the logarithm for the WLI index and oil price. We also do progress to make the data get rid of seasonal tendency, then we use Augmented Dickey-Fuller test and p-p test to find which degree the data is stationary. The results of ADF test and p-p test are shown in Table 1 and Table 2.
The results of unit root test indicate that the second degree of WLI is a stationary series. While the first degree of oil prices is a stable series. Because the two variables belong to different stationary degrees, we need to make difference variable for WLI index. Then we could make an equation between the first difference of WLI and oil price.
Table 1. The results of augmented Dickey-Fuller test.
ADF 1% level 5% level 10% level
LW(2) −33.78 −3.43 −2.86 −2.57
[image:4.595.145.482.664.719.2]Lo(1) −16.93 −3.43 −2.86 −2.57
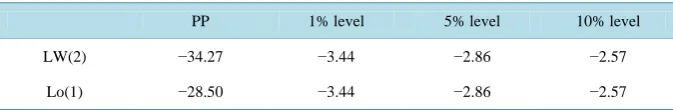
Table 2. The results of Phillips and Perron test.
PP 1% level 5% level 10% level
LW(2) −34.27 −3.44 −2.86 −2.57
After the unit root test, this paper carried on the co-integration analysis for the two groups of data. Co-integ- ration analysis is used as a way of exploring whether there is a long-term stable relationship between different variables. If the two variables have one or two co-integration relationships, the co-integration shows that the re-lationship between the two variables is stable in long-run. But when there is no co-integration rere-lationship be-tween two variables, we can certain that the relationship bebe-tween two variables would be changeable in long-run. Uncertain relationship between two variables indicates that there exist structural breaks. This paper carried on Johansen co-integration test of the first order difference of the WLI and crude oil price index, here is the results (Table 3).
The results of co-integration test show that the probability of at most one co-integration relationship is less than 0.05%. So in long-run, these two variables have no obvious co-integration relationship. There is no long- term stability relationship between WLI and the price of crude oil which means the paper couldn’t directly find the regression analysis result of WLI and the price of crude oil. What’s more, we could find structural break-points between these two variables. The structural breakpoint would make the WLI and the price of crude oil have different regression relationship in different period of time. First of all, we find the optimal regression equ-ation of the two variables
( )
0.03* 0.93* 1 0.03
o o
L = − ∆LW+ L + (4)
Lo is logarithm of north American WTI prices, ∆LW is the first order difference logarithmic of WLI and Lo(1)
is the first-order lag variable of Lo. Then we use Bai-Perron multivariate structural breakpoint test for the
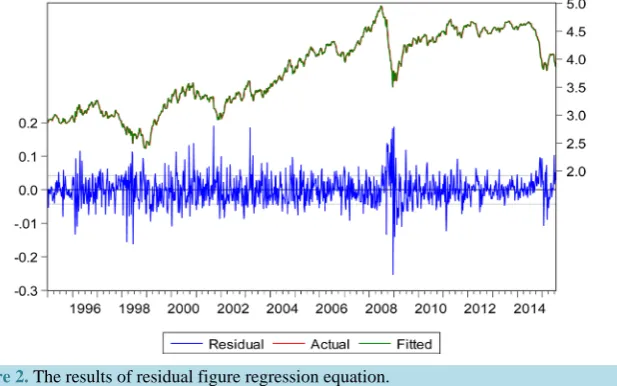
regres-sion equation. The results show that the most obvious structural break point is December 2008, the second ob-vious structural break point is August 2005 (Figure 2).
According to the results of Bai-Perron multivariate structure break point test, the basic regression equation of this paper can be divided into three intervals: January 1995 to August 2005, August 2005 to December 2008 and December 2008 to August 2015. According to the location of the break points, we use Granger causality test to find the different relationship between two variables in different periods. The results are shown in Table 4.
[image:5.595.163.472.452.645.2]The results of Granger causality test show that: From January 1995 to December 2008, the oil prices as the in-dependent variable affected the first order difference of WLI, but the causal correlation between oil prices and the first order difference of WLI declined after August 2005; While from December 2008 to August 2015, the first order difference of WLI as the independent variable caused the change of oil price. We can draw a conclusion that
Figure 2. The results of residual figure regression equation.
Table 3. The results of co-integration test.
Hypothesized Max-Eigen 0.05
No. of CE(s) Eigen Value Statistic Critical Value Prob.**
Table 4. The results of Granger causality test of intervals.
Period Causal relationship
January 1995 to August 2005 WLI would cause a change of the first difference of WLI (0.71)
August 2005 to December 2008 Oil prices would cause a change of the first difference of WLI (0.21)
December 2008 to August 2015 The first difference of WLI would cause a change of oil prices (0.67)
the time point December 2008 is an obvious structural breakpoint which represents the crude oil price index and WLI index.
4. Conclusions
The following main conclusions can be drawn based on the empirical test.
The structural break for oil price and WLI existed in August 2005 and December 2008. The multiple structur-al breakpoints test in this paper is mutation test of endogenous structure. And by this method, we don’t need to find the breakpoints by qualitative analysis before the certification of breakpoint test. From the breakpoint test, we can analysis the reason why there is a breakpoint by qualitative analysis. This method is more accuracy and efficiency.
December 2008 is the most observable breakpoint through the selection data, and the relationship between oil price and WLI changes in different breakpoint periods. The reason why December 2008 became the most ob-servable structural mutation point was that the financial crisis in 2008. The financial crisis led to economic re-cession throughout the world, and made investors lose confidence to invest. On the one hand, before the finan-cial crisis, there already had a lot of substantial bubble with the competition between hedge fund and industry fund in global oil market. Comparing to August 2005, the funds of crude oil trade on the global crude oil market doubled in 2008 with the total volume for hedge fund commodity transaction kept soaring. Among the commod-ity hedge fund, the energy derivative occupied 20% of all the trade. When the market was facing the financial crisis, the accumulated oil price bubble broke and energy derivatives became high risk financial products. Meanwhile, the crisis brought a bad signal to the market. People lost confidence in the future which WLI conti-nuous declined. As we can see, the U.S. dollar index also declined at that moment. In order to positively deal with economic crisis, various countries successively introduced positive fiscal and monetary policies. If these polices could ignite positive effect, the government would rebuild the market confidence. WLI index would raise obviously. But the reality showed that the policy didn’t attach the anticipation which was showed by the stable WLI index.
Generally, the oil price and WLI had a positive direction linkage relationship in long-term. But we found that the relationship become not efficiency by the end of 2014. A big reason for this change was the game between OPEC countries and non-OPEC countries. And the development of new energy also helped the market loss the dependency of crude oil. So we predicted the oil price would become a more marketization index in the future. This progress maybe takes a little long time, but we can see the rational market response from the signal of the oil market.
References
[1] Lawrence, C. (2003) Why Is Gold Different from Other Assets? An Empirical Investigation. Vol. 6, the World Gold Council, 1.
[2] Zhang, Y., Xu, L. and Chen, H.M. (2007) An Empirical Study on the Relationship between Prices of Petroleum and Gold Industry. Research on Financial and Economic Issues, 284, 35-39.
[3] Wang, Y. (2010) An Empirical Analysis of the Relationship between Gold Prices and Oil Prices. Economic Forum,
483, 24-26.
[4] Zheng, W.X. and Wu, Y.H. (2010) The Volatility Spillover Effects among Oil Gold and US Dollar Index Futures.
Journal of Risk Management, 12, 211-233.
[5] Liu, D.P. (2012) The Relationship between Oil Price, Gold Price, Stock Price and U.S. Dollar Index. Economic Re-search Guide, 179, 62-64.
An Empirical Analysis on the WTI Price Fluctuation. Shandong University, Shandong.