Performance in Basic Mathematics of Indigenous Students
Lolita V. Sicat
1,*, Ma. Elena D. David
21Academic Affairs, Tarlac State University, Philippines 2Research Office, Tarlac State University, Philippines
Copyright © 2016 by authors, all rights reserved. Authors agree that this article remains permanently open access under the terms of the Creative Commons Attribution License 4.0 International License
Abstract
This analytical study analyzed the performance in Basic Mathematics of the indigenous students, the Aeta students (Grade 6) of Sta. Juliana Elementary School, Capas, Tarlac, and the APC students of Malaybalay City, Bukidnon. Results were compared with regular students in rural, urban, private, and public schools to analyze indigenous students’ weaknesses and strengths. Data were gathered using a teacher-made test in Basic Mathematics. The test was adapted to the students’ respective settings. Results show that the APC (Grade 6) students were weakest in multiplication (50.95%) and strongest in addition (85.7%). The grand mean for computation skill is 68.2% and for problem solving, 71.1%. Among the Aeta pupils, the most learned skill was addition with 84.42 mastery level while subtraction was the least learned with 29.49% mastery level, below average. The computed F for the difference among APC students compared to rural, urban, private and public schools counterpart was 78.9 (prob.= .00); the Scheffe Test identified comparability of Grade 6 APC students to Grades 5 and 6 students of a private-rural school and Grade 4 students of a public-rural school. On the other hand, the Grade 6 Aeta students were only ranked 5th (F= 20.049) andthey were comparable with the Grades 4 and 5 students of their school and a rural public school in Capas, Tarlac. The study recommends that the teachers of conventional schools where Aeta students are mainstreamed should give extra attention to them because of their cultural adjustment and poverty.
Keywords
Indigenous, Private-rural, Private-urban, Public-rural And Public-urban Schools1. Introduction
About 370 million Indigenous people in the world come from 5,000 different groups in 90 countries worldwide. Seventy percent of them live in Asia. Indigenous people tend to have small populations relative to the dominant culture of their country and they have distinctive cultural traditions that are still practiced. Examples of Indigenous Peoples include among others tribal peoples in the Philippines [1].
In the Philippines, Indigenous communities are key areas of cultural integrity that are often thwarted by a lack of peace, economic development, resource security and incorporation, yet they can hold a vision for the society [2]. One group of these indigenous people inhabits the forest of Bukidnon, Mindanao. This is the Bukidnon-Pulangiyen tribe whose ancestry dates back to the early part of 19th century. This
nomadic group, who subsists mostly by hunting and gathering, live along river systems situated in the forest of Mindanao [2].
The need for culture-based education is being sought by many of these indigenous peoples, not as a second class education but as the primary means of strengthening culture and engaging with great equity in society, while also seeking resource rights and other basic needs. The Pulangiyen tribe, out of their own initiative, built one-room cogon roofed shelter expecting for a teacher to appear. The school became a reality where people formed a center for education for their own children. The community has volunteered the best people after that thirst for learning was manifested; the teachers knew the need of their own people and the culture that they have [2]. Known now as Apu-Palamguwan Center (APC), it was named after an old man who dreamed and other people shared that dream of reading and writing. They built in the last 23 years a cultural education center in Sitiu Bendum, Barangay Busdi, Upper Pulangi. The Center works for the Pulangiyen culture; those who traditionally live along the Pulangi River and marry with neighboring areas.
students.
Students in indigenous societies around the world have, for the most part, demonstrated a distinct lack of enthusiasm for the experience in its conventional form – an aversion that is most often attributable to an alien school culture, rather than any lack of innate intelligence, ingenuity, or problem-solving skills on the part of the students [3]. The curricula, teaching methodologies and often the teacher training associated with schooling are based on a worldview that does not always recognize or appreciate indigenous notions of an inter-dependent universe and the importance of place in their societies. How the APC students and the Aetas perform in mathematics may shed light to this generalization which might not be true to them.
This study is an attempt to look into the performance of two groups of indigenous people in two different educational settings and contexts. The Aetas received education in a public elementary school where majority of the students are not indigenous, while the Pulangiyen students of the APC Center belong to the same ethnic group. The results of the study could be used as basis of decisions to improve the school circumstances of the students. Performance in mathematics, which is hardly culturally affected, may give cues on how these students perform in school. This is to further verify or disprove the general idea that indigenous people lack zeal for school.
2. Statement of the Problem
This research paper aimed to evaluate the basic mathematical performance of the Indigenous Students, the Aetas of Capas, Tarlac [4] and the Pulangiyen students of Apu-Palamguwan Cultural Center in Bendum, Bukidnon, Mindanao [5]. This is to determine whether indigenous students can surpass the performance of regular public school students
Specifically, it sought to answer the following questions: 1. How are the Indigenous students assessed in basic
computational and problem solving skills?
2. How do the Aetas and Pulangiyen Students compare with regular public elementary students in mathematical performance?
3. What are the causes of students’ weaknesses/strengths?
3. Materials and Methods
This is an analytical review of results reported by Garcia [4] and Dungo [5]. The same instrument was used by the two to gather the data among the students of the two groups of indigenous people. This instrument is a test, part of the pool of exams used by the APC. The test was validated by a dry-run to 50 regular pupils with the same grade levels at Loyola College of Culion, Palawan (Dungo, 2007). These pupils were not included in the final run of the study. The instrument was subjected to item analysis to establish the
index of discrimination and the index of difficulty. Results indicated that all the items fell within the optimum region (.45 to .75 in terms of difficulty index and .3 and above as to discrimination). The reliability of the test was computed using the Kuder-Richardson 20. The results of the validation show that the test is 94% reliable in terms of internal consistency.
The test was administered to the Grade 6 indigenous students of the Apu-Palamguwan Cultural Education Center. The same test was given to Grades three to four of the following schools: Ateneo De Manila Grade School (a private-urban school); Loyola College of Culion in Culion, Palawan (a private-rural school); St. Peter Elementary School in St. Peter, Zamboanguita, Bukidnon (public-rural school); and Barangka Elementary School, Barangka (public-urban). These were the schools against which the performance levels of the indigenous students were compared [5]. Urban schools are located in cities and towns and they have better access to modern methodologies and technologies, while rural schools are counterpart of country schools where the setting is far more simple and rustic.
On the other hand, Garcia [4] administered the same test to the Grade six Aeta pupils of Sta. Juliana Elementary School. The same test was also given to the Grades three to six pupils of Cristo Rey East Elementary School (public-rural) as well as to the grade three to six pupils of Montessori School of St. Nicholas (private-urban school). The performances of pupils in the two schools were compared with the performances of the Aeta pupils [4].
From the results of the test, the performances of the Aeta students were described and compared with the performances of various grade level students in regular school setting. Results were also used to determine where the indigenous students’ excelled or failed.
The subjects of this study were the 18 APC Grade 6 Students of the Apu-Palamguwan Cultural Education Center and 26 grade six Aeta pupils from Capas, Tarlac.
One Way ANOVA was used to compare the performances of the Indigenous students with regular students [4,5]. The Scheffe test was used to identify the differences among the groups of students. To compare the Aeta and APC students, the Mann Whitney U was used. This showed whether being ethnically intact within a school setting would make students perform better than indigenous students mainstreamed with a regular schools that cater to general population of regular students.
4. Results and Discussions
4.1. Performance of Indigenous Students in Basic Computational and Problem Solving
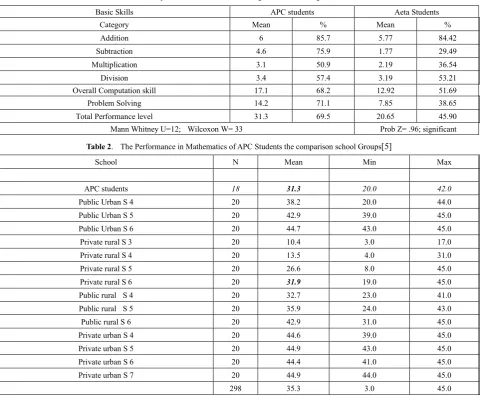
Table 1. Computational and Problem Solving skills of the Indigenous students
Basic Skills APC students Aeta Students
Category Mean % Mean %
Addition 6 85.7 5.77 84.42
Subtraction 4.6 75.9 1.77 29.49
Multiplication 3.1 50.9 2.19 36.54
Division 3.4 57.4 3.19 53.21
Overall Computation skill 17.1 68.2 12.92 51.69
Problem Solving 14.2 71.1 7.85 38.65
Total Performance level 31.3 69.5 20.65 45.90
Mann Whitney U=12; Wilcoxon W= 33 Prob Z= .96; significant
Table 2. The Performance in Mathematics of APC Students the comparison school Groups[5]
School N Mean Min Max
APC students 18 31.3 20.0 42.0
Public Urban S 4 20 38.2 20.0 44.0
Public Urban S 5 20 42.9 39.0 45.0
Public Urban S 6 20 44.7 43.0 45.0
Private rural S 3 20 10.4 3.0 17.0
Private rural S 4 20 13.5 4.0 31.0
Private rural S 5 20 26.6 8.0 45.0
Private rural S 6 20 31.9 19.0 45.0
Public rural S 4 20 32.7 23.0 41.0
Public rural S 5 20 35.9 24.0 43.0
Public rural S 6 20 42.9 31.0 45.0
Private urban S 4 20 44.6 39.0 45.0
Private urban S 5 20 44.9 43.0 45.0
Private urban S 6 20 44.4 41.0 45.0
Private urban S 7 20 44.9 44.0 45.0
298 35.3 3.0 45.0
By comparing the means, it could be noted that the indigenous students of APC had higher performance (31.3 vs. 20.65). The Aeta students failed compared to the APC students’ performance. Also noticeable in the table is their higher mean score in all the basic skills. In all the basic skills, the Pulangiyen APC students got more than 50%. This is equivalent to an average performance. The Aeta students failed in subtraction, and multiplication.
The APC students were weakest in multiplication and division, very true-to-form because these two skills are complementary. Without one, a student would not survive in the other. In terms of comparability, the APC students were significantly better and superior compared to the Aetas (Prob Z= .96). This implies that the APC students who were educated as an intact group in a school exclusively for their own performed better than the Aeta students who were merged with the regular elementary school students.
In summary, the Aeta students performed very much lower compared to the APC students. This implies that the APC students better understood instruction and their exposure was far better compared with conventional school where the Aetas are taught. Since the APC is catering only to
one ethnic tribe, the methods and strategies of teaching and even the language used is unique to them. The realization is, given that the Aetas are in the conventional school system, the teaching approaches used in classes do not give room for the indigenous students to adjust and conform. They were left behind in terms of instruction and nothing was done about it but the usual approach used in regular school processes.
4.2. Mathematical Performance Level of the Indigenous Students
The mathematical level of the indigenous students was compared with the regular students in conventional school setting.
The same test was given to different grade levels were of identified schools, public, private, rural and urban. Even the economic status as shown by the stature of the school, being private or public, gave better picture.
[image:3.595.65.550.87.485.2]island rural private school. It has 3 sections per grade level. From table 2, APC students whose mean score is 31.3 is close to the mean scores of the Grade six students of the private rural school and to the Grade four students of public rural school. It means that the APC students had similar performance with the students of rural areas, private or urban.
The highest performances were recorded by the Elementary Grades students of Private urban and public urban schools, both urban schools. This gives a picture of better performing students in urban schools. Being well exposed, students in urban setting are more aware of performing well with the context of regular learning and language.
To compare the performances of the students from different types of setting, Analysis of Variance was used. The computed F value is 78.98. It is significant at .000. This denotes that the groups significantly differed in performances in favor of students of urban schools, both public and private.
To identify which among the groups the APC students are more likely to be comparable or equal to in terms of basic mathematical performance, the Scheffe test was used. The result is shown in the table 3. The Scheffe test was used to group the students according to their similarity in performance. If scores appeared together in one column, it means they are categorized as one group with the same mathematics level.
The Scheffe test reveals that APC students had equal performances with the Grade five and Grade six students of the private rural schools, and Grade four students of Public rural school. The APC indigenous students were comparable to the performances of grades 4 and 6 rural students, where
mean performances were close to each other (under 4th
column). This means that the indigenous students of APC had comparable performance with the regular students of rural communities. This means that the APC had achieved its goal of making the performance of the Indigenous children improve. The private schools in Manila remained higher in their performances compared to rural schools. As seen in the table, their groups had higher performances as shown in first and second groups.
The Aeta students are into the regular conventional school. Their performance was compared with those of the regular students to determine the mathematics level they could be categorized.
Table 4 shows the Scheffe test. It reveals that the Grade 6 Aeta students are as good as the Grade four and Grade five students of the same school. It is important to note that the Grade six Aeta students are only equal to the Grades five and 4 students.
[image:4.595.63.546.483.715.2]What makes them different is the adjustment to the culture of the regular students. Aetas are indigenous, and their culture and way of living is different from the regular students. They live in the mountains and they do not enjoy the same amenities and luxuries enjoyed by the regular students who have radios, books and televisions. Aside from that, they don’t have the usual motivation to study unlike the regular children. Thus, regular students have a better chance in achieving good education. The Aetas were found to have comparable performance with the Grades 4 and 5 students of the same school where they are. They are left behind by one grade level due to their inability to adjust. Compared with the regular public and private elementary school students, the Aeta students were only ranked 5th.
Table 3. Scheffe test for the Comparison between Groups with the APC Students [5]
N Subset for alpha = .05 (Means )
Groups with similar Performance Level
SCHOOL 5th 4th 3rd 2nd 1st
Private rural S 3 20 10.4
Private rural S 4 20 13.5
Private rural S 5 20 26.6
APC 18 31.3 31.3
Private rural S 6 20 31.9 31.9
Public Rural S 4 20 32.7 32.7
Public Rural S 5 20 35.9 35.9
Public Urban S 4 20 38.2 38.2 38.2
Public Urban S 5 20 42.9 42.9
Public Rural S 6 20 42.9 42.9
Private urban S 6 20 44.4 44.4
Private urban S 4 20 44.6 44.6
Public Urban S 6 20 44.7
Private urban S 5 20 44.9
Private urban S 7 20 44.9
F=78.978, probability=.000 Means for groups in homogeneous subsets are displayed.
a Uses Harmonic Mean Sample Size = 19.853.
Table 4. Scheffe test for the Comparison between Groups with the Aeta Students[4]
Subset for alpha = .01
Groups with Similar Performance Level
SCHOOL N 6th 5th 4th 3rd 2nd 1st
Public rural S 3 30 15.6
Public rural S 4 30 16.9 16.9
Aeta Students 26 20.6
Public rural S 5 30 23.8
Public rural S 6 30 28.7
Private Urban S 3 30 29.3
Private Urban S 5 30 34.1
Private Urban S 4 30 38.3
Private Urban S 6 30 42.9
F= 20.049 Prob = .0001
Means for groups in homogeneous subsets are displayed. a Uses Harmonic Mean Sample Size = 29.556.
b The group sizes are unequal. The harmonic mean of the group sizes is used.
They were not even comparable with the grade three students of the private urban school. Notable are the first three groups identified by the Scheffe test. They were the Grade 4, 5 and 6 levels of the private urban school whose grade 4 students were better than their grade 5 students as shown. On the other hand, the students of the public rural schools were categorically behind the students of the private urban school. The grade 6 students of the public rural school had equal performances with the Grade 3 students of the private urban school in Capas. These so indicate that the students of the whole school, not only the Aetas, are in immense difficulty in mathematics. However, though the performance of the whole school population is poor, the performance of the Aeta students is even more depressing to note.
4.3. The Causes of Students’ Weaknesses and Strengths The Apu Palamguwan Cultural Education Center is an institution that caters only the indigenous tribe of Bendum. The concentration and focus on the same tribe gives them a better picture of understanding the culture of the students and their learning difficulties. Having this knowledge, teachers are able to identify the students’ needs and they address them. The results of the study show this. The APC students are far better in terms of performance compared to the Aetas who were mainstreamed with regular classes. There is more than this than simply meets the eye. Aeta students were in a school whose environment is foreign to them culturally and ethnically. They were adjusting painfully as shown on their scores. They are alienated by their looks and status in life. They feel different because they could not cope with modernization. Compared to other countries that provide for their minority groups with great priority, in this country, they are not. They get little support economically and the Aetas could feel that. According to them, they look different and
they realize that they do not belong to the group. This is not true among the APC students because they are one group with the same dream.
The goal of mathematics education in the APC is to provide indigenous students with mathematics content and approaches that would enable them to successfully master mathematics. However, no matter how desirous the students were in making this effort a reality, there was some interference needing to be addressed according to Dungo (2007). As identified in the presentation, the indigenous students of APC had also been low in performance compared with the other regular students. This is because of their cultural difficulties according to Dungo (2007).
No matter how hard teachers try, the deprivation of the students in terms of amenities in life makes them less performing. Their poverty would not afford them the luxury of gaining ideas from books, television, and even radio. The inadequate food at home and the lack of support system from the family and the home make students struggle for two things: intellectual development and subsistence. It is a question of priority. Which is more important to them, their studies of their subsistence? This is where teachers should come in. The students need support system in both: to address the school needs and extend help for them to improve their livelihood so that their status in life would be improved.
5. Conclusions
Based on the results and findings, the following conclusions are drawn.
average is below it.
The APC students were of equal performance in basic mathematical skills with the grades five and six students of a private rural school. Their performance is comparable to the Grade four students of public elementary school in a rural setting. On the hand, the Aeta students were one grade level behind their school mates, whose Grade six level is comparable with the grade 3 level of a private rural school in Capas, Tarlac.
For Aeta students, cultural adjustment and poverty are the main causes of their level of performance in mathematics. Cultural incompatibilities seen in the language and materials used for instruction make the lessons hard for them to understand. On the other hand, the poverty makes their focus divided between desire to scholastically develop and to struggle for life.
This realization leads to the need for legislation of culturally responsive approaches to service delivery in school education. [6] The Aetas, similar to the APC, should have a school for their own group, to help their fear of being discriminated be addressed.
Acknowledgements
We are very grateful to experts for their appropriate and constructive suggestions to improve this template.
REFERENCES
[1] Cultural Survival (2002). “Who are indigenous people?” Online available fromhttp://www.culturalsurvival.org/who-a re-indigenous-peoples
[2] Apu Palamguwan Cultural Education Center. Online available
from (http://apc.essc.org.ph/content/blogcategory/3/4/)
[3] Kawagley, Angayuqaq Oscar and Ray Barnhardt Education
Indigenous to Place: Western Science Meets Native Reality. 2007. Online available from http://www.ankn.uaf.edu/Curric ulum/Articles/BarnhardtKawagley/EIP.html
[4] Garcia, Joymin. Performance of the Aeta Students in Basic Mathematics. Unpublished MA thesis, Tarlac State University, 2009.
[5] Dungo, Ronnie. Performance of the Daweg G Students in Basic mathematics. Unpublished MA thesis, Tarlac State University, 2007.
[6] Perso, Thelma. Cultural Responsiveness and School
![Table 3. Scheffe test for the Comparison between Groups with the APC Students [5]](https://thumb-us.123doks.com/thumbv2/123dok_us/8773892.900325/4.595.63.546.483.715/table-scheffe-test-comparison-groups-apc-students.webp)
![Table 4. Scheffe test for the Comparison between Groups with the Aeta Students[4]](https://thumb-us.123doks.com/thumbv2/123dok_us/8773892.900325/5.595.65.552.90.287/table-scheffe-test-comparison-groups-aeta-students.webp)
