SEMINAR KEBANGSAAN SAINS KOMPUTER DAN MATEMATIK (SKSKM2010) 21-22DISEMBER 2010
1
SK34
Forecasting Model Selection in Six Sigma Concepts
Abdul Talib Bon
1& Looi Soon Kooi
21,2
Faculty of Technology Management, Business and Entrepreneurship, Universiti Tun Hussein Onn Malaysia, Batu Pahat, Johor
Abstract: The implementation of Six Sigma concept in a company may help the company not only to strengthen its performance but also their ability to increase its profit. The systematic method is needed for increasing the quality product. DMAIC is the abbreviation for Define, Measure, Analyze, Improve and Control. It is a formal method in the concept of Six Sigma can assist in the business. This method is to provide better solutions in driving out waste of the organization at every level and improving product quality to the level of only 3.4 defects per million opportunities towards meeting the customer’s needs by delivering products without any defects. This method is used to evaluate the effectiveness of using the concept of Six Sigma in a company for optimizing quality in the manufactured process. Forecasting model is a method of quality control used to control the quality of the process so that it can manage the forecast sales, reduce the defects products, and optimize the quality in manufactured the process.
Keywords : Six Sigma, DMAIC, quality process, forecasting model
1. Introduction
1.1
Background of Study
Six Sigma is a quality management strategy presented by Bill Smith at Motorola in 1986. It is an approach that resulted in changes to the organization by combining elements of total quality management, re-engineering course work, and employees involvement. It appears to improve the quality of the Motorola Company and it has been used by others industries or companies as a comprehensive framework for business management. Six Sigma seeks to improve product qualities by identifying and eliminating errors and variability in the field of production and business. Six Sigma is a quality management program in which it helps the new industries or companies in promoting their quality improvement processes in terms of improving the customer satisfaction and financial benefits of maximize profit, aside from minimizing costs for business production. This concept of Six Sigma is used in Balda Solution Malaysia Sdn. Ltd. in their operation management. Balda Solutions Malaysia Sdn. Ltd. offers a unique One-stop Solution that help customers looking into lowering products cost without even sacrificing the products. The company produces in the manufacturing of electronic products with special focus given on the radio frequency (RF) and acoustical.
1.2
Problem Statement
Quality and satisfaction are difficult to be improved without the appropriate method. Balda Solutions Malaysia Sdn. Ltd., a company producing electronic product, is trapped into situation in which few problems arise in such manners for instance:
i) Raw materials: some ingredients of the materials are not appropriate for the use of producing ii) Equipment: the equipments are not adequate
iii) Employees: Not experience or not well trained
In dealing with these few listed problems, there is a method that is capable to sort out the quality matters which is the forecasting model. The forecasting model consists of few models of quality control but the problem lies in choosing the applicable forecasting model to analyze the data.
1.3
Research Objectives
Identify the most suitable type of forecasting model to be used in the quality control process. Make a comparison between the methods adhere in the type of forecasting model. Choose the average percentage of errors and the lowest value of the defect so that the type of forecasting model can be selected and analyzed. Data in p-chart analysis is used for this case study.
1.4
Importance of Study
This study is equally important in the terms of the improvement on the products quality for it would lead the improvement in other circumstances such as enhancing the financial profitability, reducing operating costs, increasing productivity, reducing cycle time, increasing sales, reducing check and the cost of poor quality.
2.
Methodology
2.1
Collection of Data
Collection of data such as graphs, charts or figures in which able to show the results of the implementation of Six Sigma in the quality of the process are required for the sake of review and analyze.
2.2
Data Analysis
Forecasting model was used in this study to analyze the data. In addition, use Microsoft Excel for the formulation of bar charts, graphs, and diagrams in the form of brightly-colored in order to have the information in more precise and clearer form. Statistics used to summarize a large number of data and more in interpreting the results thus determine the different experimental as referred to.
2.3
Methodology Data Analysis
Type of forecasting model for the analyze of data are chosen among the models of Moving Average model, Simple Exponential Smoothing model, and the Box Jenkins model. Make a comparison between the methods in the term of Akaike Information Criterion (AIC), Bayerian Information Criterion (BIC), Mean Absolute Percentage Error (MAPE), Mean Absolute Error (MAE), Mean Squared Error (MSE), Root Mean Squared Error (RMSE) and Mean Absolute Deviation (MAD). Choose the average percentage of errors and the lowest value of the defect so that the most suitable type of forecasting model can be selected and analyzed. Data in p-chart analysis is used for this case study.
3.
Data Analysis
3.1 Introduction
SEMINAR KEBANGSAAN SAINS KOMPUTER DAN MATEMATIK (SKSKM2010) 21-22DISEMBER 2010
3
3.2
Data Analysis
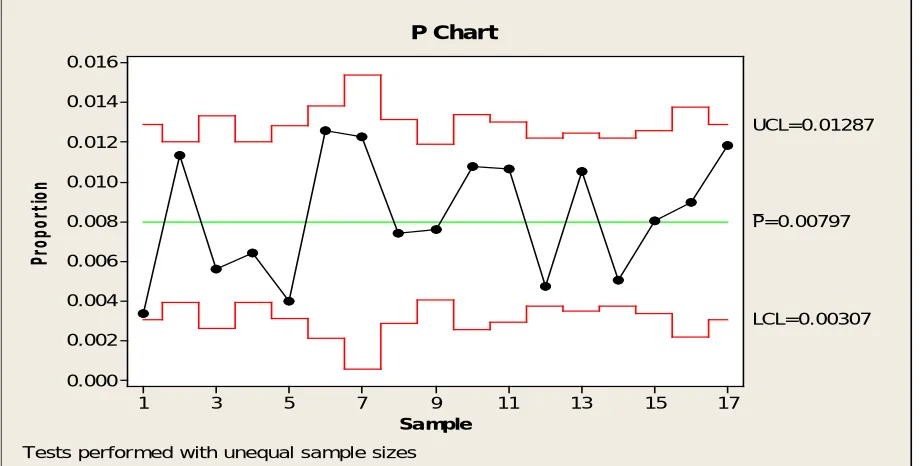
[image:3.612.72.532.145.378.2]The Figure 1 and Table 1 below is the data provided from the company Balda Solutions Malaysia Sdn. Ltd. used for analyze.
Figure 1: The Quantity Inspection and Reject Products Examined in Each Week.
Table 1: The Quantity Inspection and Reject Products Examined in Each Week
Week Quantity inspection
Number of Reject
Week Quantity inspection
Number of Reject
WK1 2962 10 WK10 2417 26
WK2 4325 49 WK11 2813 30
WK3 2500 14 WK12 4000 19
WK4 4371 28 WK13 3519 37
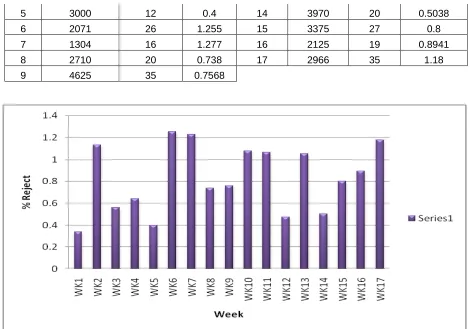
WK5 3000 12 WK14 3970 20
WK6 2071 26 WK15 3375 27
WK7 1304 16 WK16 2125 19
WK8 2710 20 WK17 2966 35
WK9 4625 35
From the figures and data provided by the company Balda Solutions Malaysia Sdn. Ltd., researcher use Microsoft Excel to calculate the percentage of defects attained in each week.
Table 2: Percentage of Defects in Each Week Received
Week
Quality
Inspection Reject % Reject Week
Quality
Inspection Reject % Reject
1 2962 10 0.3376 10 2417 26 1.0757
2 4325 49 1.1329 11 2813 30 1.0665
3 2500 14 0.56 12 4000 19 0.475
4 4371 28 0.6406 13 3519 37 1.0514
17 15 13 11 9 7 5 3 1 0.016 0.014 0.012 0.010 0.008 0.006 0.004 0.002 0.000 Sample Pr op or tio n _ P=0.00797 UCL=0.01287 LCL=0.00307
Tests performed with unequal sample sizes
[image:3.612.75.546.615.716.2]7 1304 16 1.277 16 2125 19 0.8941
8 2710 20 0.738 17 2966 35 1.18
[image:4.612.70.540.68.397.2]9 4625 35 0.7568
Figure 2: Percentage of Defects in Each Week Received
By using a forecasting model (Forecast X software), the percentage of defects is taken into account in the models mentioned such as Moving Average model, Simple Exponential Smoothing model, and the Box Jenkins model. In this study, the percentage of defects are compared through the Akaike Information Criterion (AIC), Bayerian Information Criterion (BIC), Mean Absolute Percentage Error (MAPE), Mean Absolute Error (MAE), Mean Squared Error (MSE), Root Mean Squared Error (RMSE) and Mean
Absolute Deviation (MAD) is carried out in this chapter.
Moving Average Model:
The equation of Moving Average (MA):
[image:4.612.92.507.637.767.2]SEMINAR KEBANGSAAN SAINS KOMPUTER DAN MATEMATIK (SKSKM2010) 21-22DISEMBER 2010
5
[image:5.612.94.541.316.479.2]Refer to Table 3 above, the most recent moving average value provides a forecast for the next period with a number of methods that study the percentage of errors that will cause the loss of a company. In this table, it was found that the lowest percentages of errors are moving average 7 with the percentage of 39.04% MAPE shown. In addition, the values of MSE and RMSE for the moving average 7 are respectively 0.1 and 0.32 of the errors of the lowest compared with the other. Therefore, the researcher decided to select the moving average 7 for this model.
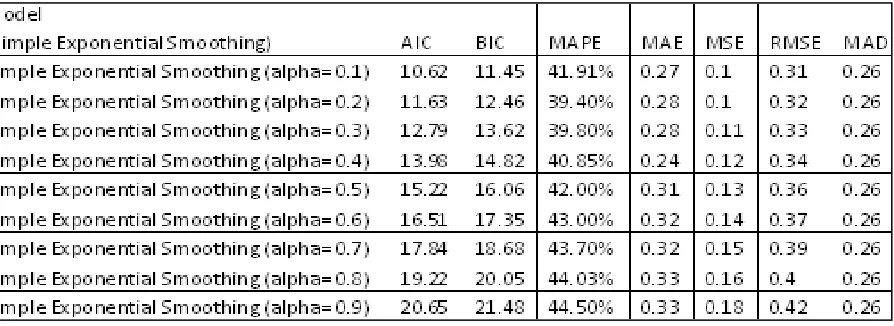
Table 4: Forecast The Percentage of Errors on Next Period By Using Simple Exponential Smoothing Model
Refer Table 4 above, the simple exponential smoothing model is a procedure for continually revising a forecast in the light of more recent experience and has predicted a future trend by using the method of reviewing the percentage of errors that will bring the loss of a company. In this table, it was found that the lowest percentage of errors is simple exponential smoothing with alpha = 0.2. In the simple model average smoothing (alpha = 0.2), the percentage of errors for MAPE = 39.40% are the lowest compared to other alpha values. In addition, the MSE and RMSE is also part and parcel of the method in analyzing the errors with the results of 0.1 and 0.32 respectively.
Box Jenkins Model
Table 5: Forecast The Percentage of Errors on Next Period By Using Box Jenkins Model
So, by having three types of forecasting models under review, the researcher could plot the chart below:
Table 6: Comparison of Types of Forecasting Models Assessing The Percentage of Errors
[image:6.612.80.533.505.572.2]SEMINAR KEBANGSAAN SAINS KOMPUTER DAN MATEMATIK (SKSKM2010) 21-22DISEMBER 2010
7
software) as their prediction model and research for their companies to help them to deal with quality problem and get preparation in managing productively.
Comparative Three Diagrams of Forecasting Model
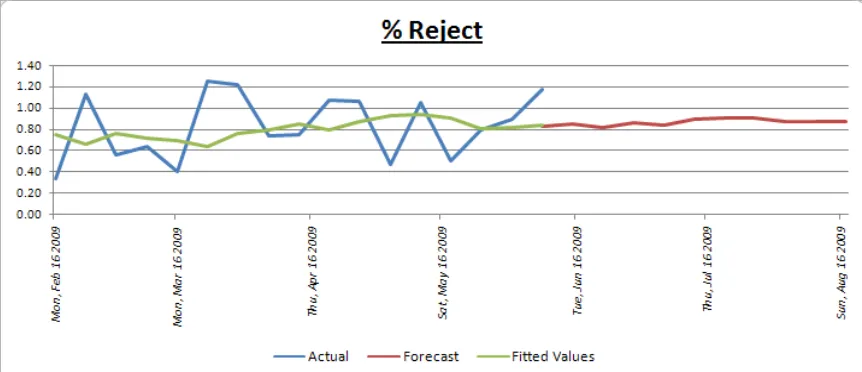
[image:7.612.80.511.150.336.2]In addition, graphs for the three types of forecasting model can be compared based on predicted lines.
[image:7.612.92.520.372.542.2]Figure 3: Forecast The Percentage of Errors By Using Moving Average 7 Model
From the three figures shown above, it found that the forecast Figure 5 Box Jenkins is the most appropriate and accurate forecasts to predict as shown in the line within Figure 5. The predicted line is almost the same as before. Box Jenkins model can be selected and used as a quality control method that can predict and control the process for Balda Solutions Malaysia Sdn. Ltd.
4.
Conclusion
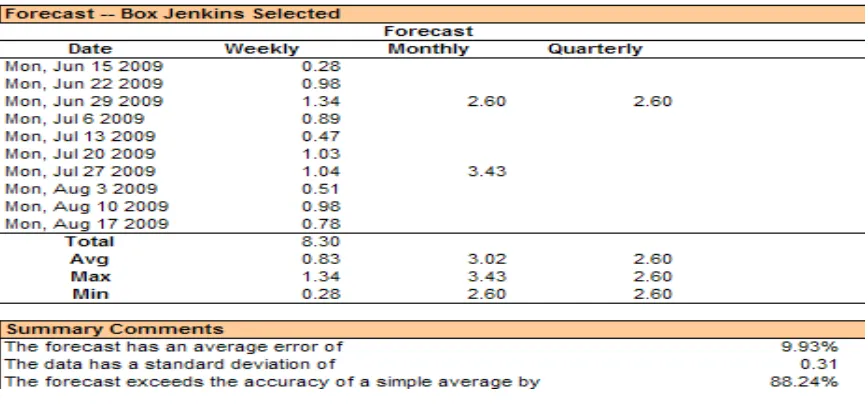
[image:8.612.92.515.73.244.2]Refer Figure 6, the study of the next 10 weeks are basically started from weeks 18 to 27. The percentage of errors predicted from week 18 are 0.28%, week 19 was 0.98%, week 20 was 1.34%, week 21 was 0.89%, week 22 was 0.47%, week 23 was 1.03%, week 24 was 1.04%, week 25 was 0.51%, week 26 was 0.98%, week 27 was 0.78%. Referring to figure 4.6, it indicated that the forecast has an average errors prediction of 9.93% and standard deviation of 0.31. In addition, a summary of comments from the figure 4.6 has shown that what is predicted by the percentage of accuracy is 88.24%. In conclusion, researcher can study and predict that in 20 weeks, the percentage of errors is the highest which are 1.34%. This can give a prediction that in the coming weeks the company Balda Solutions Malaysia Sdn. Ltd. should make preparations as control of the work carried out in more detail and significant for instance, review of 2 times before use raw materials to produce. Strictly in control of the work to be carried out for the sake of minimize the expected percentage of errors.
[image:8.612.91.525.492.694.2]SEMINAR KEBANGSAAN SAINS KOMPUTER DAN MATEMATIK (SKSKM2010) 21-22DISEMBER 2010
9
The researcher founds that the Box Jenkins forecasting model is most suitable model able to predict the most accurate prediction compared to the previously with reference given the through available graphs and data in which can be made as an early control
References
Andersson, R., Eriksson H. & Tortensson, H. (2005).“Similarities and differences between TQM, six sigma, and lean”, Vol.18(3), pp.282-296.
Antony, J. (2006). “Six Sigma for Service Processes.” Business Process Management Journal. Vol.12(2), pp.234-248.
Antony, J. & Banuelas, R. (2002). “Key Ingredients for the Effective Implementation of Six Sigma Program.” Measuring Business Excellence. Vol.6(4), pp.20–27.
Associates, B. (2001). “Quality-Based, Problem Solving/ProcessImprovement.” com/quality.htm
Balestracci, D. (2006). TQM, Six-Sigma, Lean and Data, Quality Digest, p.17
Banuelas, R. & Antony, J. (2002). “Critical Success Factors for the Successful Implementation of Six Sigma Projects in Organizations.” The TQM Magazine, Vol.14(2), pp.92–99.
Barry, K. et al., “Evolution in Forecasting: Experts Share Their Journay,” Journal of Business Forecasting 25, no. 1(spring 2006), p.15.
Bertels, T. (2003). “Rath & Strong’s Six Sigma Leadership Handbook.” New Jersey: John Wiley & Sons. Calloway, D. & Gleich, G. (2006). “Six Sigma.
Causs, C. F. (1777-1855). “The History of Six Sigma. Six-Sigma
Henderson, K. M. & Evans, J. R. (2000). “Succesful Implementing of Six Sigma : Benchmarking General Electric Company” Edisi 7. pp.262-268.
Ingle, S. & Roe, W. (2001). “Six Sigma Black Belt Implementation.” The TQM Magazine, Vol.13(4), pp.273–280.
Kenneth, B. K. & John, M. “Forecasting Begins with Lean Thinking on the Demand Forecasting Process, “ Journal of Business Forecasting 23, no. 4 (winter 2004), pp. 30- 32, 40.
Klefsjo, B., Wiklund, H. & Edgeman, R. L. (2001). “Six sigma seen as a methodology for total quality management”, Measuring Business Excellence, Vol.5(1), pp.31-35.
Kumar, D. (1942). “Six Sigma best practices: a guide to business process execellence for diverse industries.” pp.25-28.
Magnusson, K., Kroslid, D. & Bergman, B. (2003). Six Sigma – The Pragmatic Approach, Lund, Student litteratur.
Marcellus, R. L. & Dada, M. (1991). “Interactive Process Quality Improvement.” Management Science, Vol.37, pp.1365-1376.
Mortimer, A. L. (2006). “Six Sigma: A Vital Improvement Approach When Applied to The Right Problems, In The Right Environment.” Assembly Automation, Vol.26(1),pp.10–17.
Pande, P. S., Neuman, R. P. and Cavanagh, R. R. (2001). “The Six Sigma Way: How GE, Motorola and Other Top Companies are Honing Their Performance.” New York: McGraw-Hill. pp.67–76.
Pyzdek, T. (2003). “Six Sigma Training.
Raisinghani M. S. (2005). “Six Sigma Concept, Tool, and Application,” Edition 105. pp.498-500.
Savolainen, T. (2007). “Dynamics of Organizational Learning and Continuous Improvement in Six Sigma Implementation.” The TQM Magazine, Vol.19(1), pp.6–17.