A Graphic Method to Estimate the Wind Speed under
Urban Canopy Layer
Mansoureh Tahbaz
School of Architecture and Urban Planning, Shahid Beheshti University (SBU), Iran Research Centre of Landscape and Vernacular Design, SBU, Iran
Copyright © 2015 by authors, all rights reserved. Authors agree that this article remains permanently open access under the terms of the Creative Commons Attribution License 4.0 International License
Abstract
This article is based on a graphic method introduced by the author to determine the wind speed around the buildings for the levels less than 10 meters. By the help of the graphs produced in this research the architect is able to estimate the wind speed in every urban terrain and every height less than 10 meters above the ground - that is deferent from the height and terrain of the meteorology station - without being involved with calculation procedure. According to the importance of the turbulent wind in urban spaces, this article produced a table by using equivalent steady wind speed (Vs) supporting the graphic method todetermine the acceptable wind speed around the buildings. This table will be used by the help of a CFD simulation to estimate the proportion of the equivalent steady wind speed around the building (Vs) to the mean wind speed (Vz) in the
same level of the urban terrain (Vs/Vz). It will help the
architect to predict important thresholds of the acceptable wind speed around the buildings in his/her own design to prevent unpleasant conditions. Referring to the meteorology data of the place, the graph will show the duration, time and direction of the wind that may cause unpleasant conditions. Therefore it will lead the designer to correct the design and reduce uncomfortable situations.
Keywords
Mean Wind Speed, Urban Terrain, Turbulence Intensity, Equivalent Steady Wind Speed, Numeric Method, Graphic Method1. Introduction
One of the climatic elements that can be controlled and modified by urban design is the urban wind. When wind flowing over an open area approaches the boundaries of the built-up area, it encounters a higher “roughness” of the surface, created by the buildings. The increased resistance resulting from the higher roughness reduces the wind flow at the level of the urban canopy. In this way a transitional zone is created between the ground and the undisturbed wind flow
above the urban air dome, which is called the “urban boundary layer”. The “undisturbed flow” is called the “gradient wind” and its velocity is called the “gradient velocity”.
The wind variation with height is divided into two specific sub-layers [1]. The obstructed sub-layer or urban canopy sub-layer which extends from the ground surface up to the building’s height; and the free surface layer or urban boundary layer which extends above rooftops. The flow in the obstructed or canopy sub-layer is driven by the interaction of the flow field above and is influenced by the local effects of topography, building geometry and dimensions, streets, traffic and other local features such as the presence of trees. In the general way, wind speed in the canopy layer is much lower when compared to the undisturbed wind speed [2].
The wind field is characterized by two parameters: the “vertical profile of the mean wind speed” and “the turbulence spectrum”. Both are affected and modified by the profile of the terrain and, in an urban setup, by the urban structure [3]. This article is more concentrating on the first parameter: “the vertical profile of the mean wind speed” and it is supposed to achieve a graphic method to estimate the wind speed in a terrain according to the turbulence occurs around the buildings by the help of CFD simulation.
2. Estimating the Wind Speed in a Study
Site
large area of water surface is the least and in the dense urban area with low and high rise buildings is the most (Table 1). So the data of the wind speed reported by the meteorology station is different from the wind speed in urban areas. Architects and planners need to make these data suitable for design. To estimate the appropriate wind speed there are some experimental and numerical methods.
2.1. Numerical Method
In modelling the urban effect on the wind speed, the vertical profile of the wind, from the gradient wind level down to the ground is used. The simple formula developed by Davenport (1960) shows the profile of the wind speed in different height of an area. The “logarithmic” models predict a zero wind velocity at the height of the roughness under any wind condition, while in reality various wind speeds, sometimes very strong, can be experienced at that level. The power model of Davenport (1960) does not have this theoretical limitation because it predicts a certain wind speed even very near the ground level [14, pp. 265-266]. It shows that the wind speed vary with height according to the power law [4, p. 37 and 3, p. 262]:
G G zZ
Z
V
V
(1)Table 1 shows the typical values of
Z
G and
for mean wind speeds over four types of terrain. The values and terrain categories in Table 1 are consistent with thoseadopted in other engineering applications, for example “ASCE Standard 7” [5].
Formula (1) will be developed to formula (2) which helps to calculate wind speed in the same terrain for every study height.
10 10Z
Z
V
V
z z (2)To estimate the wind speed in different urban areas with different density and terrain roughness, formula (3) is introduced [6]:
G G z metZ
Z
met
met
V
V
met 10 10 10 10 (3)2.2. Reliability of the Numerical Method
[image:2.595.385.482.234.315.2]Equations 1, 2 & 3 give the wind speed at height Z above the plan area-weighted average height of local obstacles, such as buildings and vegetation. At heights at or below this average obstacle height (e.g., at roof height in densely built-up suburbs), the speed depends on the geometrical arrangement of the buildings, and the equations are less reliable [5].
Table 1. Suggested Values of
Z
G and
for Various Terrain Conditions [5] TerrainCategory Description Exponent
Layer Thickness
G
Z
(meter)1
Large city centres, in which at least 50% of buildings are higher than 21.3 m, over a distance of at least 0.8 km or 10 times the height of the structure upwind, whichever
is greater
0.33
460
2
Urban and suburban areas, wooded areas, or other terrain with numerous closely spaced obstructions having the size of single-family dwellings or larger, over a distance of at least 460 m or 10 times the height of the structure upwind, whichever is
greater
0.22 370
3 Open terrain with scattered obstacles having heights generally less than 9 m,
including flat open country typical of meteorological station surroundings 0.14 270
4 Flat, unobstructed areas exposed to wind flowing over water for at least 1.6 km, over
[image:2.595.75.546.474.656.2]3. Graphic Method
In the numerical method for each change of the wind speed, all calculations must be repeated; this makes the calculating process difficult and confusing. To ease the estimating process of wind speed, a graphic method was recommended by the author [7]. By this method, without being involved with calculation, the mean wind speed in every terrain and every study height will be estimated easily and rapidly. There are 3 graphs that are produced by the author. The explanations of the graphs are as below:
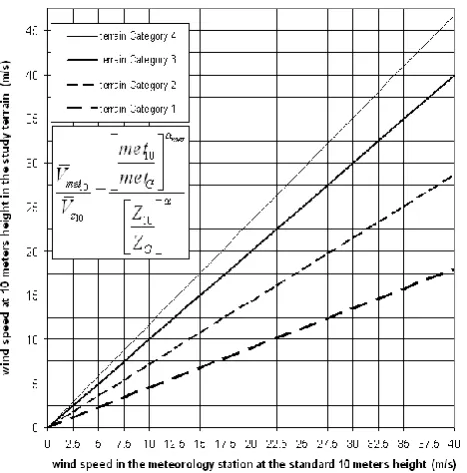
The graph in Fig 1 - which is drawn by using formula (3) - shows the relationship between observed mean wind speeds in the meteorology station at the standard height 10 meters and the mean wind speeds in four types of terrains in Table 1 at the same height.
Figure 1. The relationship between meteorology wind data and the study train at 10 meters height
The graph in Fig 2 - that is drawn by using formula (2) - shows the relationship between height above the ground and the percentage of wind speed in different terrains. This graph is prepared for heights less than 10 meters and shows the exponent
for different kinds of terrains.The graph in Fig 3 is drawn by using formula (2). It shows the relationship between wind speed at the height of 10 meters and the percentage of wind speed at the lower height. It shows the wind speed at the study height.
All the graphs are compacted in Fig 4 that will be used for graphical method estimation of wind speed.
Using these graphs, without being involved with calculation procedure, the wind speed in the study terrain at each desire height will be estimated for every reported wind speed data by the meteorology station at 10 m height. By this
[image:3.595.315.545.124.352.2]method for every change of reported wind speed, the wind speed of the study urban terrain will be estimated easily and quickly [7].
Figure 2. The relationship between height above the ground and the percentage of wind speed in different terrains
[image:3.595.62.296.274.511.2] [image:3.595.321.544.385.703.2]Figure 4. The graphs to estimate wind speed in study terrain at study height [7]
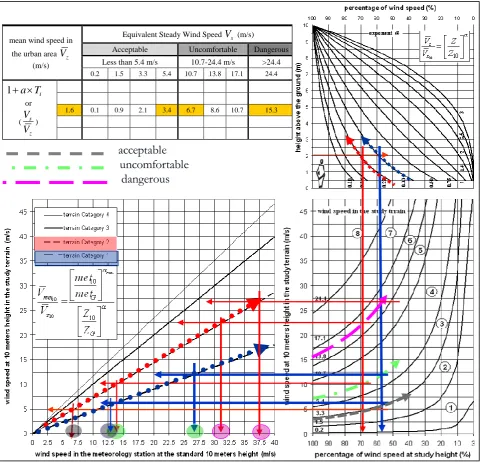
Table 2. Summary of wind effects on people based on the Beaufort scale [4, p. 40]
Type of wind Wind speed (m/s) Effect Name
Dangerous wind speed
8 More than 24.4 Damages buildings and trees
7 17.1 – 24.4 People blown over by gusts, generally impedes progress, great
difficulty with balance in gusts Strong gale
uncomfortable wind speed
6 13.8 – 17.1 Inconvenience felt when walking Near gale
5 10.7 – 13.8 Umbrellas used with difficulty, difficult to walk steadily, wind
noise in ears unpleasant Strong breeze
4 5.4 – 10.7 Raises dust, dry soil and loose paper, hair disarranged, force of wind felt on body, limit of agreeable wind on land
Moderate and fresh breeze
Acceptable wind speed
3 3.3 – 5.4 Wind extends light flag, hair is disturbed, clothing flaps Gentle breeze
2 1.5 – 3.3 Wind felt on face Light breeze
1 Less than 1.5 Calm, no noticeable wind calm
Terrain
Category Description
Exponent Layer Thickness (meter) 1
La rge city centres, in wh ich a t lea st 50% of buildin gs a re higher tha n 21.3 m, over a dista nce of a t lea st 0.8 km or 10 times the height of the structure upwind, whichever is grea ter
0.33 460 2
Urba n a nd suburba n a rea s, wooded a rea s, or other terra in with numerous closely spa ced obstructions ha ving the size of single-fa mily dwellings or la rger, over a dista nce of at lea st 460 m or 10 times the height of the structure upwind, whichever is grea ter
0.22 370 3
Open terra in with scattered obsta cles having heights genera lly less tha n 9 m, including fla t open country typica l of meteorologica l sta tion surroundings
0.14 270 4
Fla t, unobstructed a rea s exposed to wind flowin g over wa ter for a t lea st 1.6 km, over a distance of 460 m or 10 times the height of the structure inla nd, whichever is grea ter
0.10 210
[image:4.595.63.550.562.713.2]3.1. Wind Quality
The graph produced by the author (Fig 4) simplified the procedure of estimating the wind speed in the urban area but it is not clear for the designer how to use this information in architectural and urban design. The Beaufort scale (Table 2) can be used for this reason. This table shows the relationship between the wind speed and the condition caused by it. According to the acceptable wind speed in urban area that is less than 5 m/s [4, p. 37]; it is possible to classify the wind speed in 3 main groups:
1. The wind speed less than 5 m/s, that is acceptable in urban areas (light breeze to gentle breeze)
2. The wind speed between 5 to 17.5 m/s, that will cause difficulties for passengers (moderate breeze to near gale)
3. The wind speed more than 18 m/s that will cause damage for the buildings and uprooted the trees (gale to strong gale)
To distinguish these groups, 8 areas are shown on the graph at bottom right of Fig 4 which helps to predict the quality of the wind speed for urban design decisions. In this case the graph of the Fig 4 is completed and can be used by urban designers as a guideline.
3.2. Benefits of the Graphic Method
Using the graphs in Fig 4 it is possible to predict the wind speed in every study height and in every urban area according to the meteorological reported wind speed only by drawing some lines. In using Equations 1, 2 & 3, cases may be encountered where, for a given wind direction, the terrain upwind of either the building site or the recording site does not fall into just one of the categories in Table 1. The terrain immediately upwind of the site may fall into one category, while that somewhat further upwind falls into a different category. This difference in terrains also occurs when a building site or recording site is in an urban area near open water or at the edge of town [5]. In these cases, the suggested approach is to use the terrain category that is most representative of the average condition. If the average condition is somewhere between two categories described in Table 1, the values of
andZ
G can be interpolated from those given in the Table 1. One of the advantages of graphic method is easy interpolating between the terrain categories.3.3. Limitations of the Graphic Method
The recommended graphic method has all the reliability limitations of the numerical method. In order to design for the effects of airflow around buildings, wind speed and direction frequency data should be obtained. The simplest forms of wind data are tables or charts of climatic normal recorded in meteorology stations, which give hourly average wind speeds, prevailing wind directions, and peak gust wind speeds for each month of the year.
In cases where the only significant difference between the airport recording site terrain and the building site terrain is surface roughness, the mean wind speed can be adjusted, using Equations 1, 2 & 3 and Table 1, to yield approximate wind velocities at the building site. A rough guideline is that only wind speeds
V
z
4 m/s at the building site can be estimated reliably using these equations for the condition that the building and meteorological station are in different terrain categories. In addition, several other factors are important in causing the wind speed and direction at a building site to differ from values recorded at a nearby meteorology station [5].Another limitation is that all the mathematical models of the vertical wind profile assume a smooth curve from the level of the gradient wind down to the ground or the roughness parameter height. This form represents the wind speed pattern to the top of the urban canopy (useful for the pollution and wind loading on high buildings). In a city near ground level, turbulent created by the buildings, causes a very complex wind field. So in urban canopy the wind field can not be defined by a simple smooth curve sloping down to the ground [3, p. 265].
4. Turbulent Wind in Urban Areas
The wind condition in the airspace between the buildings is very important from the view point of pedestrian comfort, building ventilation and energy demand. Often the wind speed near the ground (pedestrian level) may be higher than the wind speed in the middle height of the space between the buildings. Air flow around isolated buildings is well characterized by a bolster eddy vortex due to flow down the windward façade, while behind is a lee eddy drawn into the cavity of low pressure due to flow separation from the sharp edges of the building top and sides. Further downstream is the building wake characterized by increased turbulence, but lower horizontal speeds than the undisturbed flow [2].
)
1
(
iz
s
V
a
T
V
(4)s s i
V
V
T
2
where 2V is the root mean square of the equivalent steady wind speed [8] (Gandemer, 1977, p.425)
Different values for
a
coefficient are recommended by different studies, ranging from 1.5 to 4 [9]. The effect of turbulence depends on the specific criterion used in its evaluation, and also on the circumstances and the activities of the pedestrians. Turbulence intensities in areas of strongly channelled flow are found to be relatively low (0.10-0.15) and probability by normal distribution. Local turbulence intensities near the ground in open country are typically around 0.2. Values in the order of 0.3 or even higher would be appropriate in urban areas. Turbulence intensities of 0.25-0.4 are more representative for other areas with significant wind speeds [10].4.1. Examples for Using Equation 4
To show the way of using equivalent steady wind speed concept some examples are done here:
Example 1 [3, p.297]:
With an average wind speed of 4 m/s a turbulence intensity of 0.2 and an
a
value assumed at 3.0 the perceptible wind speed will be:4
.
6
)
2
.
0
3
1
(
4
s
V
m/sAccording to Beaufort scale and penwarden recommendations for pedestrians, it is possible to divide the urban wind speeds to three categories. It is useful to mention that Hunt recommends similar values to classify acceptable wind speed on pedestrians [11].
1. The acceptable wind speed that is less than 5.4 m/s: extends light flag, hair is disturbed and clothing flaps. 2. Uncomfortable wind speed that is more than 10.7:
causes umbrellas used with difficulty, difficult to walk steadily and wind noise on ears.
3. Dangerous wind speed that is more than 24.7: causes damage buildings and trees (Table 2).
Using equation 4, the wind speed in urban area will be divided to three groups for different terrains with different density and height of buildings (Table 3).
Example 2:
For the urban condition of example 1 assume
z s
V
V
=1.6, estimate the reported wind speed for three main category of wind effect on people (acceptable, uncomfortable, dangerous).
In Table 3 for
z s
V
V
=1.6 by equivalent steady wind speed
s
V
= 5.4, 10.7 and 24.4 m/s, the mean wind speed arez
V
= 3.4, 6.7 and 15.3 m/s respectively. The graph in bottom left of Fig 4 shows the mean wind speed in different terrains. In this graph adding the curve lines of 3.4, 6.7 and 15.3 m/s, shows the mean wind speed outcome of Table 3. For the terrain category 1 and 2 at the height of 2 meters (the height that affect the pedestrians), the reported wind speed in meteorology station at 10 meters height will be classified according to the following part of this article. It is useful to mention thatz s
V
V
is equal 1.3 to 1.6 for buildings higher than 10-15 stories [8]. Citation to [12].
4.2. CFD Simulation / Critical Wind Speeds
To estimate the proportion of
z s
V
V
in critical points of a buildings’ arrangementa CFD simulation for each specific design will be used. By the help of the simulation it is possible to estimate the proportion of
z s
V
V
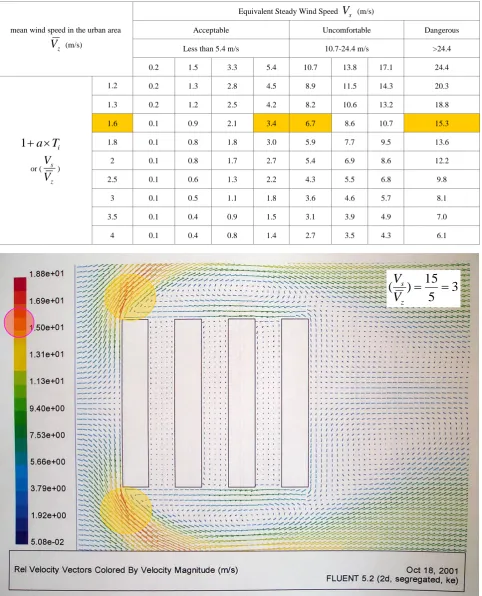
in every specific location and find out the thresholds of the mean wind speed which may cause an unpleasant or dangerous situation (Fig 5). CFD simulations of some buildings’ settlements by different arrangements are shown in Figs 6-8. In these examples1 the mean wind speed (
V
z) is defined as 5 m/s and the legend in the left part of the simulated figures - that shows the current velocity vectors around the buildings - estimates the equivalent steady wind speed (V
s). Therefore the estimation ofz s
V
V
in critical parts of buildings by different arrangements will be estimated with an acceptable approximation for the beginning stage of design procedure.
4.3. Verification of the CFD Simulation by an Experimental or Wind Tunnel Test
The
z s
V
V
that is proposed in table 3 and will be estimated by a CFD program, needs to be verified by an extra test such as experimental test in a real case study or a wind tunnel test by a model. Here a simple example is presented by a real case study.
Table 3. Equivalent steady wind speed and mean wind speed for different density and height of buildings
mean wind speed in the urban area
z
V
(m/s)Equivalent Steady Wind Speed
V
s (m/s)Acceptable Uncomfortable Dangerous
Less than 5.4 m/s 10.7-24.4 m/s >24.4
0.2 1.5 3.3 5.4 10.7 13.8 17.1 24.4
i
T
a
1
or (
z s
V
V
)
1.2 0.2 1.3 2.8 4.5 8.9 11.5 14.3 20.3
1.3 0.2 1.2 2.5 4.2 8.2 10.6 13.2 18.8
1.6 0.1 0.9 2.1 3.4 6.7 8.6 10.7 15.3
1.8 0.1 0.8 1.8 3.0 5.9 7.7 9.5 13.6
2 0.1 0.8 1.7 2.7 5.4 6.9 8.6 12.2
2.5 0.1 0.6 1.3 2.2 4.3 5.5 6.8 9.8
3 0.1 0.5 1.1 1.8 3.6 4.6 5.7 8.1
3.5 0.1 0.4 0.9 1.5 3.1 3.9 4.9 7.0
4 0.1 0.4 0.8 1.4 2.7 3.5 4.3 6.1
3
5
15
)
(
Figure 5. Using CFD simulation in critical points around the buildings’ settlement at pedestrian level
Figure 6. Wind speed in critical points is approximately 3 times more than mean wind speed
Equivalent Steady Wind Speed
V
s(m/s)
Less than 5.4 m/s
10.7-24.4 m/s
>24.4
mean wind speed in
the urban area
V
z(m/s)
0.2 1.5 3.3 5.4 10.7 13.8 17.1 24.41.2 0.2 1.3 2.8 4.5 8.9 11.5 14.3 20.3 1.3 0.2 1.2 2.5 4.2 8.2 10.6 13.2 18.8
1.6 0.1 0.9 2.1 3.4 6.7 8.6 10.7 15.3
1.8 0.1 0.8 1.8 3.0 5.9 7.7 9.5 13.6 2 0.1 0.8 1.7 2.7 5.4 6.9 8.6 12.2 2.5 0.1 0.6 1.3 2.2 4.3 5.5 6.8 9.8 3 0.1 0.5 1.1 1.8 3.6 4.6 5.7 8.1 3.5 0.1 0.4 0.9 1.5 3.1 3.9 4.9 7.0
i
T
a
1
or
(
z sV
V
)
[image:8.595.66.546.320.684.2]4 0.1 0.4 0.8 1.4 2.7 3.5 4.3 6.1
Table 3: equivalent steady wind speed and mean wind speed for different density and
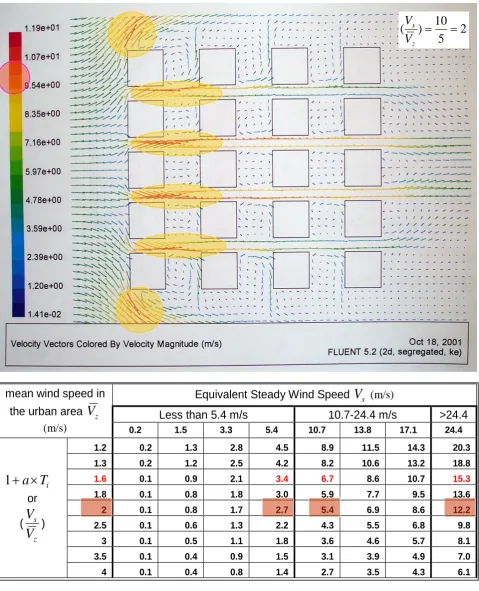
Figure 7. Wind speed in critical points is approximately 2 times more than mean wind speed (left)
2
5
10
)
(
z s
V
V
Equivalent Steady Wind Speed
V
s(m/s)
Less than 5.4 m/s
10.7-24.4 m/s
>24.4
mean wind speed in
the urban area
V
z(m/s)
0.2 1.5 3.3 5.4 10.7 13.8 17.1 24.41.2 0.2 1.3 2.8 4.5 8.9 11.5 14.3 20.3
1.3 0.2 1.2 2.5 4.2 8.2 10.6 13.2 18.8
1.6 0.1 0.9 2.1 3.4 6.7 8.6 10.7 15.3
1.8 0.1 0.8 1.8 3.0 5.9 7.7 9.5 13.6
2 0.1 0.8 1.7 2.7 5.4 6.9 8.6 12.2
2.5 0.1 0.6 1.3 2.2 4.3 5.5 6.8 9.8
3 0.1 0.5 1.1 1.8 3.6 4.6 5.7 8.1
3.5 0.1 0.4 0.9 1.5 3.1 3.9 4.9 7.0
i
T
a
1
or
(
z s
V
V
)
[image:9.595.67.547.77.669.2]4 0.1 0.4 0.8 1.4 2.7 3.5 4.3 6.1
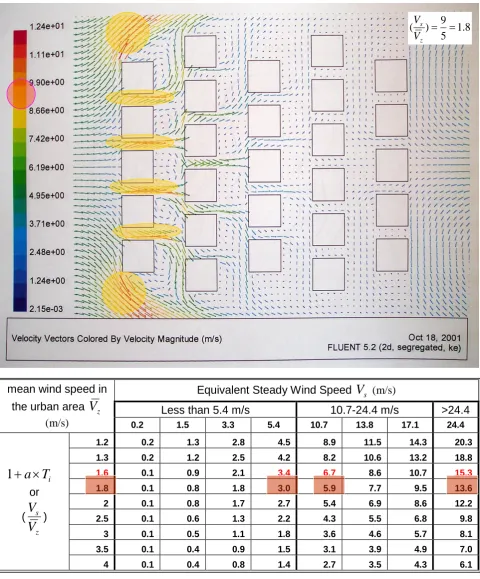
Figure 8. Wind speed in critical points is approximately 1.8 times more than mean wind speed (right)
8
.
1
5
9
)
(
z s
V
V
Equivalent Steady Wind Speed
V
s(m/s)
Less than 5.4 m/s
10.7-24.4 m/s
>24.4
mean wind speed in
the urban area
V
z(m/s)
0.2 1.5 3.3 5.4 10.7 13.8 17.1 24.41.2 0.2 1.3 2.8 4.5 8.9 11.5 14.3 20.3
1.3 0.2 1.2 2.5 4.2 8.2 10.6 13.2 18.8
1.6 0.1 0.9 2.1 3.4 6.7 8.6 10.7 15.3
1.8 0.1 0.8 1.8 3.0 5.9 7.7 9.5 13.6
2 0.1 0.8 1.7 2.7 5.4 6.9 8.6 12.2
2.5 0.1 0.6 1.3 2.2 4.3 5.5 6.8 9.8
3 0.1 0.5 1.1 1.8 3.6 4.6 5.7 8.1
3.5 0.1 0.4 0.9 1.5 3.1 3.9 4.9 7.0
i
T
a
1
or
(
z s
V
V
)
[image:10.595.65.546.77.657.2]4 0.1 0.4 0.8 1.4 2.7 3.5 4.3 6.1
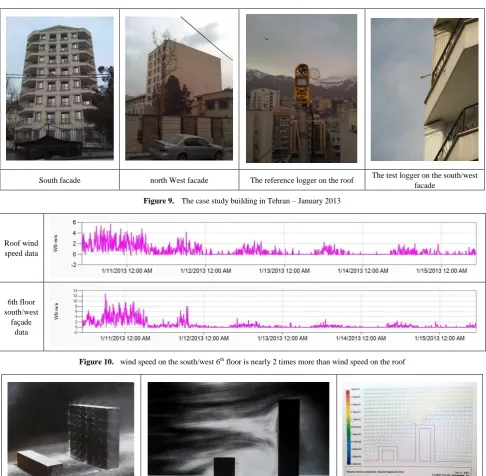
South facade north West facade The reference logger on the roof The test logger on the south/west facade
Figure 9. The case study building in Tehran – January 2013
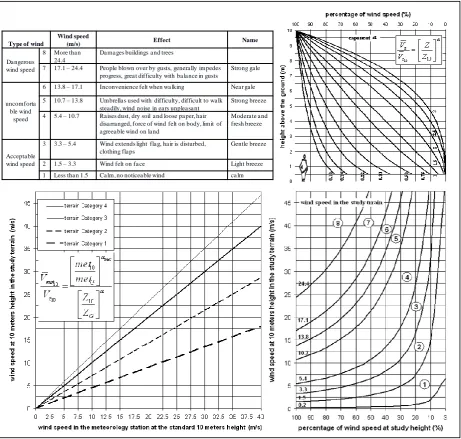
Roof wind speed data
6th floor south/west
façade data
Figure 10. wind speed on the south/west 6th floor is nearly 2 times more than wind speed on the roof
Wind tunnel test [4] Wind tunnel test [4] CFD simulation
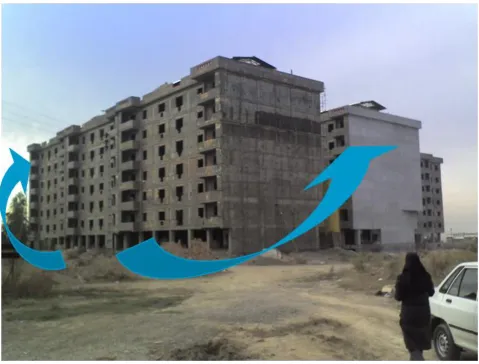
Figure 11. The wind tunnel test in this model verifies the CFD simulation results of the wind turbulent condition around the buildings To show the reliability of CFD simulation an experimental
test is done in a real condition. In this example a 10 floor semi tall building in Tehran is examined in winter 2013. Some Kestrel data logger personal weather stations were used to collect the wind speed information in the roof, south/west façade and north façade of the building (Fig 9). The roof data is used as the reference weather station and other data loggers log the critical points around this building. The data were collected in five days from 11-15 January. The wind speed comparison for north/south wind direction in critical parts around the building shows that when the wind speed on the roof is around 4-5 m/s, the wind speed in the sixth floor of south/west corner of the façade is around 8-10
m/s (Fig 10). It means that
z s
V
V
=2. Comparing the experimental or wind tunnel test results with CFD simulation results will give the reliability and repeatability of our simulation for other critical points around the building in different times of the year. Fig 11 shows the wind tunnel results that is verifies wind turbulent and shape around two tall and short buildings.
4.4. Results of Graphic Method for Design Principles
uncomfortable or dangerous situation according to the meteorology data. Tables in the down side of Figs 6-8 show the important thresholds of critical mean wind speed (
V
z) forz s
V
V
= 1.8, 2 and 3. Determining these thresholds on graphs of Fig 4 and using the graphic method, helps to estimate the important thresholds of meteorology wind speed data related to them according to terrain category. Table 2 that shows the wind effects on pedestrian based on the Beaufort scale is a good completion to this graph. Fig 12 shows the complete graphs for estimating wind speed by graphic method.
Specifying the important thresholds of meteorology wind speed data that will cause uncomfortable and dangerous situation around the simulated buildings, it will be clear how many times in a year the uncomfortable or dangerous situation may happen. Therefore by modifying the design at the critical points, it is possible to prevent problematic situations around the buildings and achieve harmony between architectural design and natural wind movements in the urban area. According to the results obtained from examples in Fig 13 it is clear that:
1. In terrain category 2 (suburban areas around the cities) the airflow between buildings higher than 10-15 stories (with condition of example 1), when the meteorology wind speed
10
met
V
is reported less than 6-7.5 m/s, the equivalent steady wind speed around buildings at height of 2 meters is perceptible as gentle breeze (less than 5.4 m/s). For10
met
V
morethan 13.5-15 m/s it is felt uncomfortable (more than 10.4 m/s). For
10
met
V
more than 31-32.5 m/s it will cause damages (more than 24.4 m/s).2. In a terrain category 1 (large city centres with conditions of example 1), when the meteorology
wind speed
10
met
V
is reported less than 13 m/s the mean wind speed around buildings at height of 2 meters is perceptible as gentle breeze (less than 5.4 m/s). For10
met
V
more than 27 m/s it is felt uncomfortable (more than 10.4 m/s).The data information from the meteorology station related to the site shows the time, duration and direction of the winds that may cause problems. Table 4 shows that in the example site the winds from the west in March, April and May at midday may cause uncomfortable condition for the example settlements of the buildings. Therefore the results below will be obtained for the primary stages of the design procedure:
Do not build lengthy buildings normal to the west. Do not settle serial layout buildings with small
spaces in between parallel to the west.
Do not settle chess layout buildings with small spaces in between parallel to the west.
Impede the west wind by some natural or constructed wind breaks.
5. Conclusions
Figure 12. complete sheet of graphic method for estimating wind speed in urban areas
Type of wind
Wind speed
(m/s) Effect Name
Da ngerous wind speed
8 More tha n 24.4
Da ma ges buildings a nd trees
7 17.1 – 24.4 People blown over by gusts, genera lly impedes progress, grea t difficulty with ba la nce in gusts
Strong ga le uncomforta
ble wind speed
6 13.8 – 17.1 Inconvenience felt when wa lking Nea r ga le 5 10.7 – 13.8 Umbrella s used with difficulty, difficult to wa lk
stea dily, wind noise in ea rs unplea sa nt
Strong breeze 4 5.4 – 10.7 Ra ises dust, dry soil a nd loose pa per, ha ir
disa rra nged, force of wind felt on body, limit of a greea ble wind on la nd
Modera te a nd fresh breeze Accepta ble
wind speed
3 3.3 – 5.4 Wind extends light fla g, ha ir is disturbed, clothing fla ps
Figure 13. Thresholds of mean wind speed that may cause problem in the specific locations of an example design and the related meteorology wind speed data for terrain category 1 and 2
mean wind speed in the urban area
V
z(m/s)
Equivalent Steady Wind Speed
V
s (m/s)Acceptable Uncomfortable Dangerous Less than 5.4 m/s 10.7-24.4 m/s >24.4
0.2 1.5 3.3 5.4 10.7 13.8 17.1 24.4
i
T
a
1
or
(
z s
V V
)
1.6 0.1 0.9 2.1 3.4 6.7 8.6 10.7 15.3
acceptable
uncomfortable
The graphs are based on the power law formulas that predict wind speed in a desire height above the ground according to the profile of the wind from the ground up to the gradient boundary layer for different terrain areas. The graphs help to estimate the wind speed for height less than 10 meters for a study terrain different from meteorology station. To make the estimation of wind speed meaningful for design task, using Beaufort Table, different parts of the graph was classified to 8 areas that help architect to predict the condition which may happen by the wind speed in the study urban terrain.
Turbulent that may occur by incident wind to obstacles such as buildings in every urban area, can cause unpleasant gusts with higher speed near the ground that is not acceptable for pedestrian comfort. Details of the buildings and street canyons in an urban area, like the dimensions and orientations, have a great effect on turbulent wind near the ground. To make into consideration the effect of the turbulence wind around buildings near the ground, the concept of equivalent steady wind speed is being used. By using this concept it is possible to use graphic method for classifying the reported wind speed in meteorology station to 3 main categories according to the effect on pedestrians (acceptable, uncomfortable and dangerous condition). Some examples are presented to explain the method of using the graphs. Predicting the main thresholds of the meteorology station wind speed data helps to recognise the duration, time and direction of the winds that may cause uncomfortable or dangerous situation around the specified building arrangements. This knowledge helps the architect to make better decisions at the primary stages of design process.
It is necessary to explain that the reliability of this prediction depends on the reliability of the assumptions that may be calculated by a CFD simulation. To verify the simulation an experimental case study or a wind tunnel model test is necessary to check some critical locations around the building. When the experimental case study or wind tunnel test showed the reliability of the simulation for the checked parts, the simulation results for the other parts or other times will be verified and we can use them in the graphic method.
List of mathematical symbols
z
V
= mean wind speed at Z height in the study terrain (m/s). In the recommended graphs of this article, the amount of mean wind speedV
z is estimated by the down right graph of Fig 1.G
V
= mean wind speed at heightZ
G (“gradient” height) at the top of the boundary layer of the study site, above which the speed is assumed to be constant, (m/s)10
z
V
= mean wind speed at the height of 10 meters in the study terrain (m/s)10
met
V
= mean wind speed at height of 10 meters in the meteorology station (m/s)s
V
= equivalent steady wind speed (m/s)Z
= the height for which the wind speedV
z is computed (m)G
Z
= the height at which “gradient velocity”V
G is first observed in the same terrain (m) (Gradient layer thickness is introduced by
symbol in ASHRAE Handbook and some other references)10
Z
= the height of 10 meters in the same terrain (m)
= an empirical exponent which depends on the surface roughness, stability and temperature gradient.met
= the exponent of the roughness of the meteorology station10
met
= the standard observation height of 10 meters in the meteorology station (m)G
met
= gradient height at the top of the boundary layer of the meteorology stationi
T
= turbulence intensity levela
= an empirically determined coefficientREFERENCES
[1] Oke, T. R.: (1987) “Street Design and Urban Canopy Layer Climate”, Energy and Buildings, Vol 11, pp. 103-113.
[2] Georgakis, Chrissa and Mat Santamouris: (2005). “Wind and Temperature in the Urban Environment”, Natural Ventilation in the Urban Environment, London, Earthscan, , pp. 81-102.
[3] Givoni, Baruch: (1998). “Climate Considerations in Building and Urban Design”, New york, Van Nostrand Reinhold.
[4] Penwarden, A. D. and A. F. E. Wise: (1975). “Wind Environment around Buildings”, London, Building Research Establishment Report.
[5] ASHRAE Handbook—Fundamentals (SI): (2005). Chapter 16: “Air Flow around Buildings”.
[6] Ansley, R. M.; W. Melbourne & B. J. Vickery: (1977). “Architectural Aerodynamics”, London, applied science publishers Ltd.
[7] Tahbaz, Mansoureh: (2009). “Estimation of the Wind Speed in Urban Areas for heights less than 10 meters above the ground”, The International Journal of Ventilation, Vol. 8, No. 1, pp. 75-84.
[8] Gandemer, : (1977). “Wind Environment around Buildings: Aerodynamic Concepts”, Pro. Wind Effects on Buildings & Structures, Cambridge University Press, pp. 423-433.
[9] Isyumov, N., and A. G. Davenport: (1978). “Evaluation of the Effect of Tall Buildings on Pedestrian Level Wind Environment”, Pro. American Society of Civil Engineering (ASCE), Annual Convention, Chicago, Illinois, October 1978.
Built-up Areas”, Pro. Wind Effects on Buildings & Structures, Cambridge University Press, pp. 403-421.
[11] Hunt, J. C. R., E. C. Poulton, J. C. Mumford: (1976). “The Effect of Wind on People”, New Criteria Based on Wind Tunnel Experiments, Building and Environment, Vol. 11, pp. 15-28.
[12] Razjouyan, Mahmood: (2001). “Wind and Comfort: Design with Climate”, Tehran, Shahid Beheshti University.
[13] Tahbaz, Mansoureh: (2014). “Climatic Knowledge – climatic Design”, Tehran, Shahid Beheshti University.
[14] Davenport, A.G.: (1960). “Wind Loads on Structures”, Technical Paper No. 88, Ottawa, Canada, National Research Council. Cited in Givoni, Baruch: (1998). “Climate Considerations in Building and Urban Design”, New york, Van Nostrand Reinhold.
![Table 1. Suggested Values of ZG and for Various Terrain Conditions [5]](https://thumb-us.123doks.com/thumbv2/123dok_us/8749962.891671/2.595.75.546.474.656/table-suggested-values-zg-various-terrain-conditions.webp)
![Table 2. Summary of wind effects on people based on the Beaufort scale [4, p. 40]](https://thumb-us.123doks.com/thumbv2/123dok_us/8749962.891671/4.595.72.539.78.519/table-summary-wind-effects-people-based-beaufort-scale.webp)