User Profiling in the Intelligent
Office
SAIFULLIZAM PUTEH
A thesis submitted in partial fulfilment of the requirements of
Nottingham Trent University for the degree of
Doctor of Philosophy
Abstract
The research aim is to investigate different methods of profiling user
activities in an office environment. This will allow optimal use of
resources in future Intelligent Office Environments while still taking
account of user preferences and comfort. To achieve the goal of this
research, a data collection system is designed and built. This required
a wireless Sensor Network to monitor a wide range of ambient
con-ditions and user activities, and a software agent to monitor user’s
Personal Computer activities. Collected data from different users are
gathered into a central database and converted into a meaningful
for-mat for description of the worker’s Activity of Daily Working (ADW)
and office environment conditions.
Different techniques including Approximate Entropy (ApEn),
consis-tency measures, linear similarity measures and Dynamic Time
Warp-ing (DTW) are employed to quantify a user’s behaviour and extract
a user profile. The individual user profile is representative of a user’s
preferences, consisting of user routine activities, consistency of office
usage and their thermal comfort. Using the statistical techniques,
consistency and ApEn, it is possible to characterise different users
with only a few parameters. Using similarity techniques one can
This helps to assess the importance of those aspects within the
pro-file. The novel contribution is the use of these techniques within the
context of ADW.
This research investigates soft computing techniques to enhance user
profiling. A novel fuzzy characteristic matrix is proposed to
sum-marised the ADW. The activity recognition models using an
event-driven and a fuzzy inference system are proposed to recognise a worker’s
activities during times when the office is occupied and unoccupied
during a workday. The experimental results demonstrate the
mod-els recognise a worker’s activities and can classify into six categories
(home, lunch, short break, out of office duties, not use computer/lighting
Contents
Publications vi
Contents viii
List of Figures xiii
List of Tables xix
Nomenclature 1
1 Introduction 1
1.1 Overview of the Research . . . 2
1.2 Aims and Objectives . . . 3
1.3 Major Contributions of the Thesis . . . 5
1.4 Thesis Outline . . . 6
2 Literature Review 9 2.1 Introduction . . . 9
2.2 Energy Efficiency in Buildings . . . 10
CONTENTS
2.2.2 Energy and Comfort Monitoring . . . 13
2.3 Intelligent Buildings . . . 15
2.4 Human Behaviour Recognition . . . 16
2.4.1 Activities Monitoring . . . 17
2.4.2 Activities Recognition Techniques . . . 18
2.5 Data Representation . . . 20
2.5.1 Temporal Data Representation . . . 20
2.5.2 Time Series Representation . . . 21
2.5.3 Gray Coded Binary Representation . . . 23
2.6 Office Building Monitoring Technologies . . . 23
2.6.1 Monitoring Technologies . . . 24
2.6.2 Data Acquisition Technology . . . 25
2.7 Computational Intelligence Techniques . . . 27
2.7.1 Clustering Techniques . . . 28
2.7.2 Fuzzy Inference System . . . 29
2.7.3 Artificial Neural Networks . . . 30
2.7.4 Adaptive Neuro-Fuzzy Inference System . . . 30
2.8 Discussions . . . 31
3 Experimental Architecture 33 3.1 Introduction . . . 33
3.2 Cost of Hardware and Installation . . . 34
3.3 Proposed System Architecture . . . 35
3.3.1 Sensors . . . 38
3.3.2 Communication System . . . 39
CONTENTS
3.3.2.1 Wired Sensor Network . . . 39
3.3.2.2 ZigBee Wireless Network . . . 39
3.3.2.3 XBee Testing and Configuration . . . 40
3.3.2.4 Technical Considerations for the Project . . . 40
3.3.3 Personal Computer Monitoring Application . . . 43
3.3.4 Database . . . 44
3.4 Data Collection . . . 47
3.5 Office Environment Simulator . . . 51
3.5.1 The Development of Office Environment Simulator . . . . 53
3.5.2 Structure of Simulator System . . . 56
3.5.3 Parametrisation Process . . . 57
3.6 Discussion . . . 59
4 Data Analysis Techniques 61 4.1 Introduction . . . 61
4.2 Ethical Issues . . . 62
4.3 Statistical Techniques . . . 63
4.3.1 Consistency Measure . . . 64
4.3.2 Approximate Entropy Measure . . . 65
4.4 Distance Measures . . . 67
4.4.1 Linear Distance Measures . . . 68
4.4.2 Dynamic Time Warping . . . 70
4.5 Discussion . . . 74
CONTENTS
5.2 User Activity Characterisation . . . 76
5.3 Data Representation . . . 79
5.3.1 Representation of Binary Signals in Start-time and Dura-tion Sequences . . . 79
5.3.2 Representation of Binary Signals in Binary Code . . . 80
5.4 Annotation and Data Validation . . . 84
5.5 Statistical Measures . . . 85
5.6 Consistency and Chaotic Measures of User’s Activity . . . 88
5.6.1 Consistency Measure for User Behaviour . . . 89
5.6.2 Approximate Entropy Measure for User Behaviour . . . 90
5.7 Thermal Comfort Monitoring and Assessment . . . 91
5.8 Measuring Similarities of Behavioural Patterns . . . 93
5.8.1 Linear Similarity Measures . . . 94
5.8.2 Similarity Features and Clustering . . . 100
5.8.3 Dynamic Time Warping . . . 107
5.9 Discussion . . . 110
6 Enhanced User Profiling 115 6.1 Introduction . . . 115
6.2 Fuzzy Characteristics Matrix . . . 116
6.3 User’s Fuzzy Characteristics . . . 118
6.4 Activity Recognition . . . 122
6.4.1 An Event-Driven Approach . . . 122
6.4.2 Implementation and Results . . . 126
6.5 Fuzzy Inference System Approach in Activity Recognition . . . . 129
CONTENTS
6.5.1 Fuzzy Activity Recognition . . . 132
6.5.2 Implementation and Results . . . 134
6.6 Discussion . . . 135
7 Conclusions and Future Works 138 7.1 Summary . . . 138
7.2 Concluding Remarks . . . 142
7.2.1 Data Acquisition and Collection in Intelligent Office Envi-ronments . . . 142
7.2.2 Data Representation and Visualization . . . 143
7.2.3 Individual User Profiling Extraction . . . 143
7.2.4 Enhance Extraction and Identification of ADW . . . 146
7.3 Directions for Future Work . . . 146
Appendix A - Current Products for Office Building Monitoring 149
Appendix B - Sensor Types 152
Appendix C - Sensor Node Devices 154
Appendix D - Statistical Analysis of Users’ Behaviour 161
Appendix E - Similarity Measure Results of Users’ Behaviour 166
Appendix F - Validation of Activity Recognition 168
List of Figures
1.1 Research Framework . . . 4
2.1 Energy consumption in the UK by sectors. . . 10
2.2 Energy consumption by energy source and sector in the UK (2010). 11 2.3 Different time-series feature representation: a) binary data repre-sentation b) change point reprerepre-sentation. . . 22
2.4 Time-series representation of PIR sensors: a) activities in different areas b) combined signals. . . 22
2.5 Expected latencies of transmission data rate between ZigBee, Z-Wave, 6LoWPAN and INSTEON . . . 27
3.1 Proposed system architecture for intelligent office environment. . . 37
3.2 Screenshot of terminal tab of X-CTU application showing infor-mation received from sensor nodes. . . 41
3.3 The structure of ZigBee wireless network. . . 42
3.4 Proposed PC monitoring using internet technology. . . 43
3.5 Sample of database data format. . . 45
3.6 A enhanced entity relationship diagram of database. . . 47
3.7 iOffice web interface. . . 48
LIST OF FIGURES
3.8 Testing the Zigbee RF properties in an office building environment. 49
3.9 Sample of office signals representing user #2 daily activity in an
office environment on 27-March-2012. . . 50
3.10 Sample of office signals representing signals recorded by the data collection system from 26-Feb-2012 to 01-April-2012. . . 52
3.11 Stateflow chart. . . 54
3.12 Individual state models for sensors. . . 55
3.13 Finite state machine for the office simulator. . . 55
3.14 Sample of activity signals. . . 56
3.15 Block diagram of the office environment simulator. . . 57
3.16 The standardised normal curve . . . 58
4.1 A sample sequence of an activity containing two states. . . 64
4.2 The optimal warping path aligning by two different binary signals. 71 4.3 Linear and non-linear time alignment a) linear time alignment, whereithpoint in one sequence is aligned withithpoint in other b) non-linear time warped alignment allows more distance alignment in similarity computation. . . 73
5.1 The proposed methodology to construct an individual user profile. 77 5.2 A sample of daily pattern for a) User #1 b) User #2. . . 78
5.3 The door activities over five working days for a) User #1 b) User #2. . . 81
5.4 Distance representing bit changes for different combination of sig-nals a) user #1 and a) user #2. . . 83
LIST OF FIGURES
5.6 Distribution of door activity over twelve weeks for a) User #1, b)
User #4. . . 85
5.7 Comparative results of users behaviours based on weekly duration
of a) Office occupancy, b) Lighting usage, c) Computer usage, d)
Chair occupancy. . . 86
5.8 Box plot representing users behaviours based on weekly duration
of a) Office occupancy, b) Lighting usage, c) Computer usage, and
d) Chair occupancy. . . 88
5.9 The office temperature readings for a) User #2 b) User #4. . . . 92
5.10 The behavioural pattern of User #2 in an office environment over
five weeks. . . 94
5.11 Comparison of similarity measures for the activities of User #2
between a) 43200 samples per day for a period of 5 days, and b)
216000 samples per week for a period of 5 weeks. . . 98
5.12 Energy use behaviour of User #2 in an office environment. . . 100
5.13 Similarity dendrogram of activities for User #2 over 25 working
days. . . 102
5.14 PCA’s score plot for similarity between office occupancy and light
activity of User #2 over 25 working days. . . 104
5.15 Energy use behaviour of a) User #1, b) User #2 and c) User #4,
based on similarities between the activities produced using Biplot
function. . . 105
5.16 DTW similarity measure for office occupancy of User #1 as a
ref-erence and office occupancy of User #2 as target. . . 108
LIST OF FIGURES
5.17 DTW curves comparing the similarities of the office occupancy
between Day 1 and Day 3 of User #2. . . 109
5.18 DTW results for user #2 over five working days. a) DTW curves
comparing the similarity of office occupancy b) distances between
binary signals for office occupancy c) office occupancy behaviour
changes over time d) number of changes/positions. . . 110
6.1 Fuzzy partitions a) start time for all events b) duration for chair
occupancy c) duration for PC activities. . . 117
6.2 Sample of activities duration of User #2 over three weeks for a)
office occupancy, b) lighting, c) chair occupancy, and d) computer
usage. . . 120
6.3 Sensor activities for User #2 on a) Monday, b) Tuesday, and c)
Wednesday. . . 120
6.4 Scatter plot for fuzzy characteristics matrix a) Office occupancy
for Monday, Tuesday, and Wednesday, b) Lighting for Tuesday and
Wednesday, c) between Lighting and Computer, and d) Computer
for Monday and Tuesday. . . 121
6.5 The events flow hierarchy of an event-driven model to discover
user’s activities in an office environment. . . 122
6.6 Samples of activities patterns based on a) user’s annotation b)
user’s activity model gathered from sensory devices. . . 127
6.7 Samples of patterns for a) user’s activity, office occupancy and
computer usage b) user’s activity, office occupancy and lighting
LIST OF FIGURES
6.8 The membership functions for active and inactive normalised
in-put values for sensory variables a) PIR, b) PC, and c) any binary
sensor. . . 132
6.9 The membership functions for a) Start time, b) Working time, c)
Time lapse, and d) User activity. . . 133
6.10 Block diagram of a fuzzy activity recognition system for a single
office worker. . . 134
6.11 Fuzzy activity patterns a) comparing activities for two different
days, b) Similar activities in slightly different time. . . 135
1 PICAXE Connect AXE210 a) Sensor board with XBee wireless
for PC interface, b) Sensor board with XBee wireless for PICAXE
interface . . . 155
2 Pictures and pinout configurations for a) PICAXE-18X and b)
SP3232E . . . 155
3 Circuit diagram of AXE210 power circuit . . . 156
4 Circuit diagram of SP3232E IC to XBee module connection for PC
interface . . . 157
5 Circuit diagram of PICAXE to XBee module connection . . . 158
6 The Circuit diagrams of sensors to PICAXE IC connection for a)
Sensor node #1, b) Sensor node #2, c)Sensor node #3, d)Sensor
node #4 and e)Sensor node #5 . . . 159
1 The record forms of user’s activity annotation in an office
environ-ment for User #2. . . 169
LIST OF FIGURES
2 The record forms of user’s activity annotation in an office
environ-ment for User #3. . . 170
3 The samples of activity patterns, generated by activity recognition
of User #3 for two days (23-04-2012 to 24-04-2012). . . 170
List of Tables
2.1 Ranges of temperature and relative humidity for offices (adapted
from ASHRAE standard). . . 15
3.1 The total estimated cost of hardware and installation for a single
office monitoring system. . . 35
3.2 Summary of Collected Data . . . 51
4.1 A sample of similarity measures for binary sequences. . . 69
5.1 Cronbach‘s Alpha (α) values of user’s activity in an office
environ-ment . . . 89
5.2 ApEn(2,r,N) calculations for User #1, User #2 and User #4 . . . 90
5.3 The summarised results of conventional similarity measures . . . . 95
5.4 Cluster of days with similar activities for User #2. . . 103
5.5 User profiles, used for summarizing user’s behaviour in an office
environment over twelve weeks. . . 112
5.6 Formulas used to extract profile information from the user’s
be-haviour data. . . 112
Nomenclature
6.1 Temporal variable’s values and ranges for activities recognition
model. . . 123
6.2 The estimation of a user’s power consumption of computer and
lighting in an office for a day. . . 128
6.3 Fuzzy symbols in consequent part and output value µk . . . . 131
1 Hardware products for office building monitoring applications. . . 150
2 Software products for office building monitoring applications. . . . 151
1 Summary of the various PICAXE ICs. . . 156
1 Summary of statistical analysis results of data set D4. They are
recorded from 09 Jan 2012 to 01 April 2012. . . 162
2 The summary of statistical analysis results ofD5 recorded based on
User #2 activity in an office environment. This data has recorded
from 09 Jan 2012 to 01 April 2012. . . 163
3 The summary of statistical analysis results ofD6 recorded based on
User #4 activity in an office environment. This data has recorded
from 09 Jan 2012 to 01 April 2012. . . 164
4 The summary of statistical results of room temperature and
hu-midity in office environment. The data labelled D4, D5 and D6
as shown in Table 3.2 are used. . . 165
1 The similarity measure results of User #2 activity in an office
en-vironment for periods 5 days and 5 weeks. The similarity measures
Nomenclature
Roman Symbols
ADL Activities of Daily Living
ADW Activities of Daily Working
ANN Artificial Neural Network
BMS Building Management System
CI Computational Intelligence
DTW Dynamic Time Warping
FIS Fuzzy Inference System
FSM Finite-State Machines
GL Gower and Legendre Similarity Measure
HD Hamming Distance
JCD Jaccard Similarity Measure
PC Personal Computers
Nomenclature
PCA Principal Component Analysis
PIR Passive Infra-red
PMV Predicted Mean Vote
PPD Predicted Percentage of Dissatisfied
RFID Radio Frequency Identification
Chapter 1
Introduction
Buildings are becoming the fastest growing energy consuming sector. Applying
energy efficiency measures could contribute to the reduction of current energy
consumption. To be able to apply energy efficiency measures, it is required to
interact with the environment. The availability of modestly priced sensors and
low cost computers allow us to consider individualised monitoring and control of
the environment.
In this research we are specifically investigating ways to improve the energy
efficiency in an office environment. Apart from the energy optimisation issue,
there are other factors such as office worker’s performance which could be
inves-tigated. As reported in [1], one of the major causes of stress for clerical workers is
the lack of control of their environmental conditions. If the energy consumption
units including lighting, heating and Personal Computer (PC) are made more
responsive to the user’s habits, routines and preferences, there would be more
acceptance of their use.
An office environment equipped with appropriate sensory devices and
1. Introduction
ators is required to be able to control the environmental conditions. Such an
environment will be referred to as “Intelligent Office” environment. Apart from
the monitoring and control of the environment, there should be an intelligent
decision-making process taking into account the office user’s work activities and
personal preferences. This will be referred to as a Building Management System
(BMS). Studies in [2–5] have highlighted the importance of different sensors and
a wide range of added capabilities in BMS including building security, activity
recognition and automation control system.
The rest of this chapter is structured as follows: in the next section an overview
of this research is presented. In Section1.2, the aim of this thesis and the proposed objectives are presented. Section 1.3 introduces the major contribution of the thesis. Finally, the remaining chapters of this thesis are outlined in Section 1.4.
1.1
Overview of the Research
In modern office environments, lighting systems, heating/cooling system and PC
are the main energy consumers. Many companies would like to reduce their
energy usage for two reasons. The first is that they worry about the environment
and want to reduce the impact they have on it. The second reason, and most
likely the one that companies care about most, is cost. For example, PCs waste a
lot of energy due to being left on for long periods of time when not in use. Even
though they have power management modes to reduce their energy consumptions
when they are not in use, these are not always being used.
Some workplaces incorporate reactive systems such as Passive Infra-red (PIR)
Heat-1. Introduction
ing systems often work on the assumption of a 9:00 AM to 5:00 PM presence, five
days a week, whereas an individual office worker may have a different schedule,
including long periods out of the office. Similarly, automated office computer
shut down may be set based on assumptions of behaviour that are
inappropri-ate, leading users to try to find ways of subverting the mechanisms so that their
computer remains on and avoids the inconvenience of a slow restart.
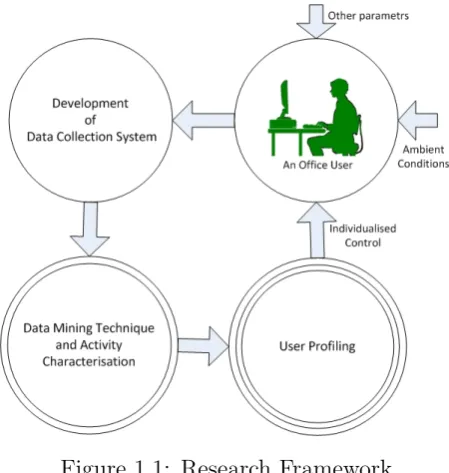
The proposed research framework is illustrated in Figure1.1. There are three distinct phases to develop the research; in the first stage, a data collection system
is developed. Different monitoring and data collection system are investigated.
The data collection system collects environmental conditions, user activities and
office conditions. In the second phase, data mining techniques are applied to
iden-tify different user characteristics. Similarity measures are used to compare users’
behaviour, detect similar behaviour between different users and also compare the
user’s behaviour across different days/weeks. In the third stage, activities
recog-nised from a user are represented as user profile. User profile is used to summarise
the activities of a user in an office environment. User profile is also used to
opti-misation environmental control system, so that the office condition are adjusted
in line with the individual user.
1.2
Aims and Objectives
The research question in this project is how to understand and characterise the
behaviour of an office user in terms that can be used for optimising comfort? To
answer the research question, the following aim is identified.
The aim of the research is to record and analyse the detailed behaviour of users
1. Introduction
Figure 1.1: Research Framework
in office environments. Activities are monitored using low level sensory devices
to detect when office workers enter/leave the room, sit down at the desk, and use
the PC. We also monitor when they switch the light on/off, adjust the heating
or leave the room to get a drink. Using this low level information gathered from
the office environment, a user profile will be created such that the environment
could be controlled based on the learned profile.
In order to accomplish the aim of this research, the following objectives are
identified:
1. To investigate the requirements for the development of an appropriate
mon-itoring system for intelligent office environment.
2. To investigate the suitability of a Wireless Sensor Network (WSN) to
mea-sure all relevant parameters with minimum interference with the users’ daily
1. Introduction
3. To integrate collected data from different sources and present them in a
uniform format. Collected data from different offices must be in a central
database and it is essential to store the information in a suitable format for
further processing.
4. To investigate efficient and meaningful formats of representation and
visu-alisation of raw data. Raw data in either binary or analog format may not
representing the activities in a meaningful format and it is important to
convert the raw data into another format to make it more understandable.
5. To extract a user profile based on the collected data from an office worker.
The profile represents the user activities in a simple and more meaningful
format. User routine activities, consistency of office usage and also user
ambient condition preferences should be represented within the user profile.
6. To investigate soft computing techniques to enhance user profiling and
cre-ate more specific user characteristics which will be use to identify different
activities. The user characteristics will form the basis of controlling the
lighting, heating and the PC.
1.3
Major Contributions of the Thesis
The main contributions of this thesis are:
- Development of software and hardware required to collect ambient
condi-tions, user activities and office conditions in intelligent office environments.
Both wired and wireless systems are investigated for their suitability in an
office environment.
1. Introduction
- Collect data that represent Activities of Daily Working (ADW) for different
office users. The ADW are related to university academic offices
represent-ing academic staff workrepresent-ing activities, which involve more varied patterns of
behaviour.
- Investigate and determine similarities between different users’ ADW and
also compare the users behaviour across different days/weeks. Both
lin-ear and non-linlin-ear similarity measures are applied. Different techniques
including Dynamic Time Warping (DTW) are investigated. The novel
con-tribution is the use of these techniques within the context of ADW.
- Using statistical techniques to quantify users’ behaviour and their
prefer-ences and produce a novel signature representing the individual’s ADW.
- Proposed a novel fuzzy characteristic matrix to summarised the activities of
an office user. The characteristic matrix is presented as fuzzy values which
indicate the likelihood of the sequence of activities.
1.4
Thesis Outline
This thesis consists of seven chapters that are summarised as follows:
Chapter 2: Literature Review
This chapter gives a review of the relevant literature related to different aspects
of intelligent offices. Initially, an introduction to energy and comfort performance
of building is presented followed by outline of building monitoring technologies,
building occupant behaviour, human activities recognition and survey of
1. Introduction
Chapter 3: Experimental Architectures
This chapter reports the experimental architecture development to monitor the
ADW in an office environment. The system’s development and structure are
ex-plained in detail including the WSN for measurement of ambient conditions, the
PC monitoring application, the database where all activities are logged and the
control server application. A simulator is also developed to generate equivalent
pattern to a office worker. The simulator will allow more repeatable testing and
assessment of algorithms developed in other chapters.
Chapter 4: Data Analysis Techniques
Both statistical and similarity measure techniques used to generate simple user
profile are presented in this chapter. A brief review of linear similarity measures
and the DTW algorithm (non-linear similarity measure) used to measure the
differences between user patterns are presented in this chapter. Application of
the techniques presented in this chapter are presented in Chapter 5.
Chapter 5: User Profiling
This chapter explains the analysis of the office worker’s behaviour in an office
environment. Statistical techniques namely consistency measures and
approxi-mate entropy measures are used to construct an individual user profile for energy
and comfort optimisation. In this chapter, similarity measure techniques are also
used to identify similarities between user activities. Some experimental results are
presented demonstrating the similarities and dissimilarities in user activities with
respect to the energy usage. Different techniques including hierarchical
cluster-ing and Principal Component Analysis (PCA) are used to identify energy usage
1. Introduction
behaviour.
Chapter 6: Enhance User Profiling
In this chapter user characteristics are used to summarise user activities. A fuzzy
characteristic matrix is proposed to represent the user activities based on
start-time and duration of an activity. Sensor data gathered from users are used to
create these models. Then, the chapter introduces an event-driven model and a
fuzzy inference system for recognising user activities. In an event-driven model,
IF-THEN rules are used to determine the transition events. The fuzzy rules and
the membership functions of activity recognition are defined based on sensory
signals and temporal variables. The experimental results are presented, the
pro-posed activity recognition methods have demonstrated able to identify ADW of
a user, either she/he in office and out of office.
Chapter 7: Conclusions and Future Works
This chapter provides the pertinent conclusions arise from this thesis and
formu-lates some future research in monitoring the daily activations of the worker in
Chapter 2
Literature Review
2.1
Introduction
Nowadays, the energy performance of building and occupant comfort are both
priorities. The aim of building technology is to achieve energy efficiency and
at the same time increase occupants’ satisfaction. Rapid progress in software
and hardware have made it possible to improve the intelligence of BMS. This is
necessary in an era of increasing energy costs. In order to help reduce all these
problems, the “intelligent building” industry need to be further explored.
Intelli-gent building system should allow integration and automation of all technologies
and computational intelligence techniques to optimise energy consumption [6],
occupants’ well-being [7], safety [8] and work productivity [9].
Figure2.1shows that energy consumption in the United Kingdom has contin-ued to increase since 1970. Although, buildings in domestic and services sectors
have had less attention regarding production of Carbon Dioxide (CO2) emission
than vehicles and industrial machines, improvement in building performance to
2. Literature Review
Figure 2.1: Energy consumption in the UK by sectors [10].
achieve energy efficiency and maintain thermal comfort [11], would also help to
reduce CO2 emissions.
Energy consumption by energy source and sector in the UK is shown in Figure
2.2. Electricity is the main energy source followed by gas for the buildings sector. Thus electricity management is a big part of BMS. Improving the effectiveness
of BMS will not only benefit the building occupants, but help long term energy
sustainability [12].
2.2
Energy Efficiency in Buildings
The energy cost of a building is directly proportional to its capacity and hours
2. Literature Review
Figure 2.2: Energy consumption by energy source and sector in the UK (2010) [10].
to find the relationship between energy usage and operating hours. In another
study [14],it is found to be difficult to optimise the thermal comfort preferences
of individuals in the office at all times. The important factors to be considered is
that each individual has different thermal comfort satisfaction, and at different
times and places an individual has different preferences of comfort in an office
environment. In [15] they improved office efficiency based on heating, cooling
and lighting to propose a future office environment. The study in [16] showed
that social and personal factors can influence one’s perceived health and
com-fort. In order to investigate individual comfort, it is necessary to investigate the
relationship between personal, social and building factors.
Looking into the future of residential and office buildings, Mitsubishi Electric
Research Labs (MERL) has collected motion sensor data from a network of over
2. Literature Review
200 sensors for two years in a 2-floor office environment [17]. This data is the
residual trace from the people working in MERL. The dataset has been made
publicly available as a benchmark to identify social and individual behaviour in
office environment. Similar datasets have been collected in a home environment
as part of CASAS smart home project [18].
Many issues apply to BMS, such as how to design and operate to comply with
standards [19], sustainability [20], and maintaining comfort for everyone [21].
Research work needs to focus on designing, inventing and manufacturing
intelli-gent building technology. At the education and society level, energy-awareness
campaigns need to encourage people to save energy, whilst human resource
pro-grammes need to produce competence people to retrofit, operate and maintain in
a manner that reduces the use of energy.
2.2.1
Building Characteristics
The largest portions of energy consumption by consumers are space heating,
cool-ing and office equipment [22]. In addition, [23] reported that residential homes,
commercial sector, offices, warehouses and premise are the main contributors to
energy consumption and carbon emissions. According to these reports, we can
state that office buildings are an important sectors to focus on, in order to achieve
energy efficiency and at the same time improve indoor thermal comfort.
Kazanasmaz et al. [24] developed an office building prediction model to
de-termine daylight luminance using Artificial Neural Networks (ANNs) . A study
in [25] has carried out research on the daylight pattern depending on movement
sun-2. Literature Review
shine availability. Although their work is aimed at designs to help predict
lumi-nance within buildings, the predictions could also be used once the building is in
use to ensure that the artificial lighting is switched on/off before the occupants
realised that they needed it [26].
2.2.2
Energy and Comfort Monitoring
Different occupant satisfaction levels and weather influence thermal comfort and
the perception of thermal conditions. The study in [2] has developed a
Multi-agent Control System to improve the efficiency of control systems for indoor
en-vironments including user preferences. This study took into consideration users’
preferences on thermal, luminance comfort, indoor air quality and energy
conser-vation.
Due to the differences in internal heat load, the characteristic differences
be-tween zones over the building and individual physiological/psychological
differ-ences, it is impossible to satisfy everyone with the same indoor condition provided
to all occupants [14]. Investigation into the comfort levels of pupils by [19,27,28]
showed that the wrong temperature in the classroom led to poorer learning
per-formance. Similarly, performance studies of call centre workers in Sacramento [29]
showed that light levels, ventilation status and temperature all had significant
ef-fects on performance, though the efef-fects are intertwined and complex. Seppanen
et al. [30] have collated studies on temperature and performance, and provide
convincing evidence of the importance of maintaining the office temperature
be-tween 21-25◦Cto optimise performance. Aries et al [31], for example, use multiple
survey items to assess worker discomfort, sleep quality and hindrance, in order
2. Literature Review
to relate building aspects to any physical and/or psychological effects. However,
Haynes [9] points out that while there is sufficient evidence to support claims that
office comfort affects productivity, there is no agreement as to how office comfort
should be measured.
The workplace research by Knoll [32] stated that enhancing environmental
control can improve users’ performance and productivity. Rashidi [33] highlights
the fact that it is important to monitor and recognize all activities that the worker
regularly performs in their working environment.
Thermal comfort can be affected by heat transfer such as conduction,
convec-tion, radiaconvec-tion, and evaporation heat loss. There have been a number of studies
relating thermal comfort to human psychology factors [34]. Behavioural
adapta-tion such as the occupant’s clothing, taking hot/cold drinks, etc. are psychological
adaptations and affect the capability to adapt to the thermal environment [35].
Fanger’s formulas [36] is based on average criteria for population comfort and
it is widely used in themal standards such as Predicted Mean Vote (PMV) and
Predicted Percentage of Dissatisfied (PPD) [37,38].
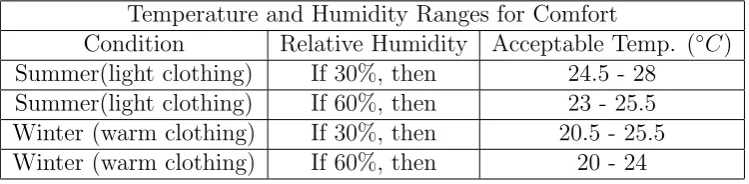
Canadian Centre for Occupational health and Safety (CCOHS) [39] have
sug-gested the thermal comfort setting, as shown in Table 2.1. This table is an adaptation from American Society of Heating, Refrigerating and Air
Condition-ing Engineers (ASHRAE) standard [40]. This table is based on numerous comfort
evaluations under controlled steady state conditions using thousands of randomly
2. Literature Review
2.3
Intelligent Buildings
The rapid development of intelligent technology such as sensors, computer
tech-nology, simulation technology and system networking have provided opportunities
to generate a high degree of intelligence in environment control systems. For
ex-ample, a study in [42] designed an intelligent residential lighting control system
based on a ZigBee wireless sensor network and fuzzy controller. Experimental
results showed that the system contributed to economy and energy efficiency.
In [43–45] it is shown that simulation tools for thermal comfort are capable of
quantifying the relationship of surface materials, indoor and outdoor
environ-ments. Focusing on the intelligent building, a study in [46] developed eight key
intelligent building indicators in order to construct models for appraising
intelli-gent building systems.
In [47,48], surveys are conducted to assess the weighting given to
intelli-gent criteria of buildings. The results showed that work efficiency is the most
important selection criterion for various intelligent building systems, while user
comfort, safety and cost effectiveness are also considered to be significant. This
finding indicated that any intelligent building system must perform efficiently to
[image:33.595.120.495.634.726.2]contribute to practicality and building occupants’ satisfaction. Research by [49],
Table 2.1: Ranges of temperature and relative humidity for offices (adapted from ASHRAE standard).
Temperature and Humidity Ranges for Comfort
Condition Relative Humidity Acceptable Temp. (◦C) Summer(light clothing) If 30%, then 24.5 - 28
Summer(light clothing) If 60%, then 23 - 25.5 Winter (warm clothing) If 30%, then 20.5 - 25.5 Winter (warm clothing) If 60%, then 20 - 24
2. Literature Review
took into account the BMS to monitor daily energy operations in order to support
the decision making process of selecting energy saving measures.
A BMS is needed to integrate all intelligent building aspects to contribute
comprehensive strategic management, in order to analyse and report the building
performance, and then provide data analysis to any decision making system. It
aims to provide intelligent functionality to respond to the energy demand and
comfort of building environments for normal daily operation [49].
2.4
Human Behaviour Recognition
Human activities recognition in buildings is the subject of interest for many
re-searchers. Activities recognition in home environments [33,50–56], hospital
envi-ronment [57,58] and the office environment [59–61] are being investigated.
Liming et al. in [5] have conducted research based on sensor-based human
activity recognition. They suggested a complex process of activity recognition
that can be approximately classified by four basic steps. They are:
1. to choose and deploy appropriate sensors in order to monitor and capture
user’s behaviour in building.
2. to collect, store, and process perceived information for data representation
at appropriate level.
3. information gathered from monitoring place based on user’s activity daily
living are used to create computational activity models.
4. to select and develop intelligent algorithms to infer activities from sensory
2. Literature Review
Human activity recognition and pattern discovery is explained in [62]. Tabak
and deVries [63] examined the intermittent activities that interrupt the planned
“normal” activities of office workers. They found that probabilistic and S-curve
methods could be used to predict activities (such as “smoking”, “go to toilet”)
and these could be used in fine grained simulations of building performance.
However, they cautioned that the results applied to typical Dutch office based
organisations, and other office environments might need further experiments to
generate data.
More survey results based on the human activities monitoring system and
activities recognition techniques are presented in the following sections.
2.4.1
Activities Monitoring
People’s activity in a building is based on their schedule of work, lifestyle and
so-cial activity. Xin et al. [64] mentioned that one of the key features of an intelligent
environment is to provide monitoring Activity of Daily Living (ADL) . In many
studies [50,55,58,64–67], ADL are monitored to assess elderly people’s activity in
the home environment, and attempts are made to process activity sequences to
make them more understandable. For example, daily home activity involves basic
functions like preparing breakfast or food, showering, walking, sleeping, watching
television, reading books etc.
Recently, advanced intelligent sensor technology has resulted in various types
of sensors that have been used by researchers to get features from activity
moni-toring. A study in [54] has used physiological sensors (cardiac frequency, activity
or agitation, posture and fall detection sensor), microphones, PIR sensors, door
2. Literature Review
sensors and state-change sensors. This monitoring system has been combined
with a fuzzy logic system for recognizing activities in readiness for the next
gen-eration of smart houses. David Naranjo et al. [68] have proposed hardware and
software design and implementation of low-cost, wearable, and unobtrusive
intel-ligent sensors for monitoring human physical activities. Many researchers have
successfully conducted research with similar ideas in activity monitoring systems,
such as Interactive Continuous Autonomic Logging and Monitoring (iCALM) [69],
human activity recognition in pervasive health-care systems [58] and occupancy
monitoring system [70].
2.4.2
Activities Recognition Techniques
To recognise human activities, different computational techniques have been
ap-plied. Data mining techniques including Discontinuous Varied-Order
Sequen-tial Miner (DVSM) [33], classification tree methods [71–74] and Hidden Markov
Models(HMMs) [75–77] have been used. More intelligent computational
tech-niques including Fuzzy Inference Systems(FIS) in activity detection [78,79] and
some hybrid soft computing approaches namely neuro-fuzzy techniques [80,81]
are investigated. Some statistical methods and Bayesian classifier are discussed
in [74,82,83].
As mentioned previously, when sensor information is collected and activities
are detected based on individual activity, the intelligent environment needs a
model to track each activity and also to recognise forthcoming activity to help
people improve their quality of life [33]. Song et al. mentioned in [84] that
2. Literature Review
and limits between real user’s behaviour and an event log. Therefore, the model
of behaviour pattern mining needs a process to determine the form of the mined
results. Consequently, the process model influences the design of the mining
algo-rithm and the related approach. They introduced the major stages of behaviour
pattern mining as summarised below:
1. Events recording: This stage arranges the original data for behaviour
pattern mining. The basic types of information include activity, event,
participant, and time. The logged data may be extended as appropriate for
any particular requirement.
2. Prepossessing: This stage provided the log format to fit the mining
method, reduces noise and checks for the record. As a characteristic of
behaviour pattern mining, common event logs may be passed on to make
use of existing work-flow mining methods.
3. Mining and discovering: Implement mining algorithm to discover the
behaviour patterns.
4. Verification: This stage applies the discovered results to system
improve-ment and research, and checks out if the results fit the experience of the
real world.
A study in [85] used a semantic-based similarity to update user profiles
repre-senting user preferences. They have monitored internet usage of a user to create
a profile for each user. Based on the user profile, they have provided relevant
in-formation to the internet user. Ghulam et al. [86] proposed an agent-based user
profiling to analyse user behaviour on the web for constructing user profile. They
2. Literature Review
categorised the user profile into demography and user interest. Iglesias et al. [87]
used a classifier to create a user behaviour profile. The classification method is
used to develop user profiles based on computer activity.
Danni Wang et al. [88] used statistical properties of occupancy in single
per-son office. Their work proposed a probabilistic model to predict and simulate
occupancy in a single person office. A study in [89] proposed a Thermally
Acti-vated Building System (TABS). Their experimental work has shown that TABS
model demonstrated that it is able to cope with user behaviour such as time of
arrival, departure and temporary absence. Taherian et al. [90] also contribute
in this area. However, their work identifies the user behaviour based purely on
electricity usage in households and office spaces to produce an energy profile.
2.5
Data Representation
In order to store the collected data from the environment, it is essential to
repre-sent them in an appropriate format. Data will be collected from different sources
with different time scale and even different format (analog and binary). To
inves-tigate the best form of data representation, many researches have been conducted
in this area. The following sections will review these.
2.5.1
Temporal Data Representation
Lee et al. [91] have been discovering knowledge from temporal interval data in
their research. According to Allen’s theory about an algebra of temporal relations
on interval [92], they proposed a new temporal data mining technique to extract
2. Literature Review
that the proposed approach increases the model efficiency to identify activity from
temporal interval data. Nazerfard et al. [53] proposed a framework for
Discover-ing of Temporal Features and Relation of Activities (DTFRA). This framework
discovers activity from data based on start time and duration using k-means
clus-tering. The proposed approaches by Lee et al. and the DTFRA framework have
shown that both approaches are able to predict start time intervals and represent
the temporal features of activity patterns [53,91].
2.5.2
Time Series Representation
Time series analysis is often used in multi-sensory data representation. Kasteren
[93] has discussed the advantages and disadvantages of time series with discrete
time intervals for the recognition process. He determined that if an interval is
very small, it would incorporate signal noise, while a moderately large interval
will smooth out important aspects of the signal. He proposed different feature
representations, i.e. change the binary data X(t) to change points Xt as shown
in Figure 2.3. Binary data representation uses the sensor data directly and ‘1’ indicates that the sensor is activated and ‘0’ is inactivated. The change point
representation indicates when a sensor event takes place, i.e. showing ‘1’ when it
changes state.
Akhlaghinia et al. in [70,94], proposed a signal technique to combine time
series of sensory signals in different areas for home occupancy monitoring. They
used multiple PIR sensors to monitor single occupant activities in a home
envi-ronment. The conditions for this approach are that there is no parallel activity
in the different areas detected, and that all activities are genuinely from a single
2. Literature Review
[image:40.595.193.426.151.231.2](a) Binary data (b) Discrete-time signal
Figure 2.3: Different time-series feature representation [93]: a) binary data rep-resentation b) change point reprep-resentation.
(a) Individual PIR Signals
(b) Combined Time-Series
Figure 2.4: Time-series representation of PIR sensors [70]: a) activities in different areas b) combined signals.
[image:40.595.152.464.278.550.2]2. Literature Review
2.5.3
Gray Coded Binary Representation
Many researchers have applied binary sequence data based on sensory signal in
their pattern recognition process [70,93,94]. However, there are many issues still
present and we need new exploration mechanisms in order to optimise the activity
recognition model. For example, Akhlaghinia et al. in [70,94] have proposed a
combination signal technique to combine binary signal for PIR sensors. However,
the proposed approach did not allow for overlapping. Therefore, when recording
parallel activities from an observation area, binary representation is the best way
to record all information. However, it is not as easy to combine all the signals
based on bit order or using significant bit position for conversion to decimal
or hexadecimal, because it is will increase the distance between one code word
and the next [95]. Gray code is associated with many fields such as mechanical
position sensors, electronic circuit, and so on [95,96].
2.6
Office Building Monitoring Technologies
The main factors driving better building operation are the provision of a healthy
environment, thermal comfort and energy. Building monitoring technology aim
to improve the quality of life for occupants [7,65,68,97] to maintain internal
environment conditions [34,98–102] and safety improvements [8,103,104].
BMS need to monitor real time building operation, record data, analyse
in-formation, and then address issues as soon as possible. Jang et al. [105] have
described a methodology of real time monitoring. They considered that an
appli-cation for a building monitoring system is divided into three parts: data
acquisi-tion, data collection and data retrieval. Authors in [106] described a decentralised
2. Literature Review
system of software agents to monitor and control office buildings. The proposed
system is used and resulted in energy saving and increasing customer
satisfac-tion. In addition, LonWorks technology [107] have proposed a typical smart
office building system containing an electrical network and a number of electrical
monitoring and control devices.
Many companies are active in carrying out research to produce products for
hardware and software monitoring of BMSs. A review of current products and
companies is presented in Appendix A.
2.6.1
Monitoring Technologies
Development of hardware and software technology have improved monitoring
ef-ficiency of environments in and around buildings [105,108]. Hernandez et al. [68]
presented the hardware and software design and implementation of a low-cost,
wearable, and unobstructive intelligent accelerometer sensor for monitoring of
hu-man physical activities. Their proposed model is to improve the healthy lifestyle
of people in buildings. The model is used to monitor daily activities and classify
them. Tsai et al. [109] recommended that research needs to improve efficiency,
accuracy, and power usage of monitoring devices. They have constructed
practi-cal designs to reduce the standby power consumption of PIR based power usage
for lighting devices. Normal PIR lighting switches are active based on motion
detected. The authors in [109] have designed a PIR able to reduce the consumed
lighting power from 3 Watt to 0.004 Watt for each detection/activation.
Building activity monitoring is a challenging part of BMS. The tasks include
References
[1] L. Narayanan, S. Menon, and P. E. Spector, “Stress in the workplace: a comparison of gender and occupations”, Journal of Organizational Behav-ior, vol. 20, pp. 63–73, 1999. 1
[2] A. I. Dounis and C. Caraiscos, “Advanced control systems engineering for energy and comfort management in a building environmental - a review”,
Renewable and Sustainable Energy Reviews, vol. 13, no. 6-7, pp. 1246–1261, 2009. 2,13
[3] Mohd Fauzi Othman and Khairunnisa Shazali, “Wireless sensor network applications: A study in environment monitoring system”, Procedia Engi-neering, vol. 41, pp. 1204–1210, 2012. 2,26
[4] Kelly R. Cowan and Tugrul U. Daim, “Review of technology acquisition and adoption research in the energy sector”, Technology in Society, vol. 33, no. 3-4, pp. 183–199, 2011. 2
[5] Liming Chen, J. Hoey, C. D. Nugent, D. J. Cook, and Zhiwen Yu, “Sensor-based activity recognition”, IEEE Transactions on Systems and Cybernet-ics, Part C: Applications and Reviews, vol. 42, no. 6, pp. 790–808, 2012. 2,
16,25
[6] Andreas Berl and Hermann de Meer, “An energy consumption model for virtualized office environments”,Future Generation Computer Systems, vol. 27, no. 8, pp. 1047–1055, 10 2011. 9
[7] Koen Steemers and Shweta Manchanda, “Energy efficient design and oc-cupant well-being: Case studies in the UK and India”, Building and Envi-ronment, vol. 45, no. 2, pp. 270–278, 2 2010. 9, 23
REFERENCES
[8] Li-Chien Huang, Hong-Chan Chang, Cheng-Chung Chen, and Cheng-Chien Kuo, “A Zigbee-based monitoring and protection system for building elec-trical safety”, Energy and Buildings, vol. 43, no. 6, pp. 1418–1426, 6 2011.
9, 23
[9] Barry P. Haynes, “The impact of office comfort on productivity”, Journal of facilities management, vol. 6, no. 1, pp. 51–37, 2008. 9, 14
[10] Department of Energy and Climate Change of UK, “Energy efficiency deployment office”, 2012. 10, 11
[11] Ayman Khalid Elsadig, “Energy efficiency in commercial buildings”, A dissertation: Master of Science Sustainable Engineering: Energy Systems and the Environment, University of Strathclyde, U.K, 2005. 10
[12] H. Hagras, I. Packharn, Y. Vanderstockt, N. McNulty, A. Vadher, and F. Doctor, “An intelligent agent based approach for energy management in commercial buildings”, in Proc. of the IEEE World Congress on Com-putational Intelligence, 2008, pp. 156–162. 10,31
[13] William Chung and Y. V. Hui, “A study of energy efficiency of private office buildings in Hong Kong”, Energy and Buildings, vol. 41, no. 6, pp. 696–701, 2009. 10
[14] S. Ari, P. Wilcoxen, H.E. Khalifa, J.F. Dannenhoffer, and C. Isik, “A practical approach to individual thermal comfort and energy optimization problem”, inAnnual Meeting of the North American on Fuzzy Information Processing Society (NAFIPS), may 2008, pp. 1–6. 11,13, 29
[15] D. Jenkins, Y. Liu, and A. D. Peacock, “Climatic and internal factors af-fecting future UK office heating and cooling energy consumptions”, Energy and Buildings, vol. 40, no. 5, pp. 874–81, 2008. 11
[16] Philomena M. Bluyssen, Myriam Aries, and Paula van Dommelen, “Com-fort of workers in office buildings: The European HOPE project”, Building and Environment, vol. 46, no. 1, pp. 280–288, 1 2011. 11
REFERENCES
[18] CASAS Smart Home Project, “Smart home datasets”, Washington State University [online] Available: http://ailab.wsu.edu/casas/datasets.html. 12
[19] John Fischer, Kirk Mescher, Ben Elkin, Stephen M. McCune, and Jack Gresham, “High-performance schools: High marks for energy efficiency, humidity control, indoor air quality first cost”, ASHRAE Journal, vol. 49, no. 5, pp. 30–46, 2007. 12, 13
[20] Yong Razidah Rashid, Mohd Sabere Sulaiman, Azlina Aziz, Hilmilia Sela-mat, Abdul Halim Mat Yani, and Mohd Zin Kandar, “Greening govern-ment’s office buildings: PWD Malaysia experiences”, Procedia Engineering, vol. 21, pp. 1056–1060, 2011. 12
[21] Stuart Barlow and Dusan Fiala, “Occupant comfort in UK officeshow adap-tive comfort theories might influence future low energy office refurbishment strategies”, Energy and Buildings, vol. 39, no. 7, pp. 837–846, 7 2007. 12
[22] Chartered Institution of Building Services Engineers, “Energy use in of-fices”, Energy Consumption Guide 19, 2000. 12
[23] Commercial Buildings Energy Consumption Survey, “Overview of commer-cial buildings - Full report”, Commercial Buildings Energy Consumption Survey, United State, 2003. 12
[24] Tugce Kazanasmaz, Murat Gunaydin, and Selcen Binol, “Artificial neural networks to predict daylight illuminance in office buildings”, Building and Environment, vol. 44, no. 8, pp. 1751–1757, 2009. 12, 30
[25] S. L. Wong, K. K. W. Wan, and T. N. T. Lam, “Artificial neural networks for energy analysis of office buildings with daylighting”, Applied Energy, vol. 87, no. 2, pp. 551–7, 02 2010. 12, 30
[26] B. B. Ekici and U. T. Aksoy, “Prediction of building energy consumption by using artificial neural networks”, Adv. Eng. Software, vol. 40, pp. 356–362, 2009. 13
[27] Nyuk Hien Wong and Shan Shan Khoo, “Thermal comfort in classrooms in the tropics”, Energy and Buildings, vol. 35, no. 4, pp. 337–351, 2003. 13
REFERENCES
[28] N. Gaitani, C. Lehmann, M. Santamouris, G. Mihalakakou, and P. Patar-gias, “Using principal component and cluster analysis in the heating eval-uation of the school building sector”, Applied Energy, vol. 87, no. 6, pp. 2079–2086, 2010. 13
[29] Heschong Mahone Group, “Windows and offices: A study of office worker performance and the indoor environment”,California Energy Commission’s Public Interest Energy Research (CEC PIER), 2003. 13
[30] Olli Seppanen, William J. Fisk, and Q.H. Lei, “Effect of temperature on task performance in office environment”, Lawrence Berkeley National Lab-oratory, 2006. 13
[31] M. B. C. Aries, J. A. Veitch, and G. R. Newsham, “Physical and psycholog-ical discomfort in the office environment”, Light, Performance and Quality of Life – Light and Health Research Foundation (SOLG) Symposium, 2007.
13
[32] Michael O’Neill, “A model of environmental control and effective work”,
Knoll Workplace Research, vol. Knoll, Inc., 2008. 14
[33] P. Rashidi, D.J. Cook, L.B. Holder, and M. Schmitter-Edgecombe, “Discov-ering activities to recognize and track in a smart environment”, Knowledge and Data Engineering, IEEE Transactions on, vol. 23, no. 4, pp. 527 –539, april 2011. 14,16, 18, 28, 63
[34] Jing Liu, Runming Yao, and Rachel McCloy, “A method to weight three categories of adaptive thermal comfort”, Energy and Buildings, vol. 47, pp. 312–320, 4 2012. 14, 23
[35] Runming Yao, Jing Liu, and Baizhan Li, “Occupants’ adaptive responses and perception of thermal environment in naturally conditioned university
classrooms”, Applied Energy, vol. 87, no. 3, pp. 1015–22, 03 2010. 14
REFERENCES
[37] Shengxian Wei, Ming Li, Wenxian Lin, and Yanlin Sun, “Parametric studies and evaluations of indoor thermal environment in wet season using a field survey and pmv/ppd method”, Energy and Buildings, vol. 42, no. 6, pp. 799–806, 6 2010. 14
[38] Guodong Ye, Changzhi Yang, Youming Chen, and Yuguo Li, “A new approach for measuring predicted mean vote (pmv) and standard effective temperature (set)”, Building and Environment, vol. 38, no. 1, pp. 33–44, 1 2003. 14
[39] Canadian centre for Occupantional health and Safety, “Thermal comfort for office work”, Mitsubishi Electric Research Laboratories [online] Available: http://www.merl.com/wmd/. 14,93
[40] ASHRAE Press,Air Conditioning System Design Manual (Second Edition), pp. 1–7, Butterworth-Heinemann, Burlington, 2007. 14
[41] Hugo S. L. C. Hens, “Thermal comfort in office buildings: Two case studies commented”, Building and Environment, vol. 44, no. 7, pp. 1399–1408, 7 2009. 14
[42] Yaning Wang and Zhaofeng Wang, “Design of intelligent residential light-ing control system based on zigbee wireless sensor network and fuzzy con-troller”, in Machine Vision and Human-Machine Interface (MVHI), 2010 International Conference on, 2010, pp. 561–564. 15, 29, 40
[43] Jiang He, Akira Hoyano, and Takashi Asawa, “A numerical simulation tool for predicting the impact of outdoor thermal environment on building energy performance”, Applied Energy, vol. 86, no. 9, pp. 1596–1605, 9 2009.
15
[44] Ashfaque Ahmed Chowdhury, M. G. Rasul, and M. M. K. Khan, “Thermal-comfort analysis and simulation for various low-energy cooling-technologies applied to an office building in a subtropical climate”, Applied Energy, vol. 85, no. 6, pp. 449–462, 2008. 15
[45] Zhang Lin, T. T. Chow, K. F. Fong, Qiuwang Wang, and Ying Li, “Com-parison of performances of displacement and mixing ventilations. Part I:
REFERENCES
thermal comfort”, International Journal of Refrigeration, vol. 28, no. 2, pp. 276–287, 3 2005. 15,26
[46] Johnny Wong, Heng Li, and Jenkin Lai, “Evaluating the system intel-ligence of the intelligent building systems: Part 1: Development of key intelligent indicators and conceptual analytical framework”, Automation in Construction, vol. 17, no. 3, pp. 284–302, 3 2008. 15
[47] Johnny K. W. Wong and Heng Li, “Application of the analytic hierarchy process (AHP) in multi-criteria analysis of the selection of intelligent build-ing systems”, Building and Environment, vol. 43, no. 1, pp. 108–125, 1 2008. 15
[48] Johnny Wong and Heng Li, “Development of a conceptual model for the selection of intelligent building systems”, Building and Environment, vol. 41, no. 8, pp. 1106–1123, 8 2006. 15
[49] Haris Doukas, Christos Nychtis, and John Psarras, “Assessing energy-saving measures in buildings through an intelligent decision support model”,
Building and Environment, vol. 44, no. 2, pp. 290–298, 2009. 15, 16
[50] N. K. Suryadevara, A. Gaddam, R. K. Rayudu, and S. C. Mukhopad-hyay, “Wireless sensors network based safe home to care elderly people: Behaviour detection”, Sensors and Actuators A: Physical, vol. 186, pp. 277–283, 10 2012. 16, 17
[51] Long Xiao, Bo Cheng, Bo Yang, Rong Du, Wenbin Yu, and Xinping Guan, “A context-aware entrance guard in smart home: An event-driven appli-cation based on the human motion and face recognition”, in Automation, Robotics and Applications (ICARA), 2011 5th International Conference on, 2011, pp. 184–189. 16
[52] Chao Chen, B. Das, and D. J. Cook, “A data mining framework for activity recognition in smart environments”, inIntelligent Environments (IE), 2010 Sixth International Conference on, 2010, pp. 80–83. 16
REFERENCES
2010 IEEE International Conference on, dec. 2010, pp. 1069 –1075. 16,21,
28,63
[54] Hamid Medjahed, Dan Istrate, Jerome Boudy, and Bernadette Dorizzi, “Human activities of daily living recognition using fuzzy logic for elderly home monitoring”, in Proc. of the International Conference on Fuzzy Sys-tems, Republic of Korea, August 2009, pp. 2001–2006. 16,17, 29
[55] Hermie J. Hermens and Miriam M. R. Vollenbroek-Hutten, “Towards re-mote monitoring and rere-motely supervised training”, Journal of Electromyo-graphy and Kinesiology, vol. 18, no. 6, pp. 908–919, 12 2008. 16, 17
[56] Vincent Rialle, Jean-Baptiste Lamy, Norbert Noury, and Lionel Bajolle, “Telemonitoring of patients at home: a software agent approach”, Com-puter methods and programs in biomedicine, vol. 72, no. 3, pp. 257–268, 11 2003. 16
[57] Yuanlong Liu, “Wireless remote patient monitoring on general hospital wards”, Ph.D.- Bournemouth University, Poole, 2010. 16
[58] Venet Osmani, Sasitharan Balasubramaniam, and Dmitri Botvich, “Human activity recognition in pervasive health-care: Supporting efficient remote collaboration”, Journal of Network and Computer Applications, vol. 31, no. 4, pp. 628–655, 11 2008. 16, 17, 18
[59] Saifullizam Puteh, Caroline Langensiepen, and Ahmad Lotfi, “Similarity pattern mining in intelligent office environments”, in Workshop Proceedings of the 7th International Conference on Intelligent Environments, vol. 10, pp. 562–573, 2011. 16
[60] S. Puteh, C. Langensiepen, and A. Lotfi, “Fuzzy ambient intelligence for in-telligent office environments”, inFuzzy Systems (FUZZ-IEEE), 2012 IEEE International Conference on, 2012, pp. 1–6. 16,63
[61] Saifullizam Puteh, Caroline Langensiepen, and Ahmad Lotfi, “University office simulator for energy and comfort optimisation”, the 25th European Conference on Modelling and Simulation (ECMS 2011), pp. 430–435, 2011.
16
REFERENCES
[62] Eunju Kim, Sumi Helal, and D. Cook, “Human activity recognition and pattern discovery”, IEEE Pervasive Computing, vol. 9, no. 1, pp. 48–53, 01 2010. 17, 63
[63] Vincent Tabak and Bauke de Vries, “Methods for the prediction of inter-mediate activities by office occupants”, Building and Environment, vol. 45, no. 6, pp. 1366–1372, 2010. 17
[64] Xin Hong and C. D. Nugent, “Partitioning time series sensor data for activity recognition”, in Information Technology and Applications in Biomedicine, 2009. ITAB 2009. 9th International Conference on, 2009, pp. 1–4. 17
[65] Saisakul Chernbumroong, Shuang Cang, Anthony Atkins, and Hongnian Yu, “Elderly activities recognition and classification for applications in assisted living”, Expert Systems with Applications, vol. 40, no. 5, pp. 1662– 1674, 4 2013. 17, 23
[66] A. H. Shabani, D. A. Clausi, and J. S. Zelek, “Evaluation of local spatio-temporal salient feature detectors for human action recognition”, in Com-puter and Robot Vision (CRV), 2012 Ninth Conference on, 2012, pp. 468– 475. 17
[67] Fco Javier Ordez, Jos Antonio Iglesias, Paula de Toledo, Agapito Ledezma, and Araceli Sanchis, “Online activity recognition using evolving classifiers”,
Expert Systems with Applications. 17
[68] D. Naranjo-Hernandez, L. M. Roa, J. Reina-Tosina, and M. A. Estudillo-Valderrama, “SoM: A smart sensor for human activity monitoring and assisted healthy ageing”, Biomedical Engineering, IEEE Transactions on, vol. 59, no. 11, pp. 3177–3184, 2012. 18,23, 24
[69] R. R. Fletcher, K. Dobson, M. S. Goodwin, H. Eydgahi, O. Wilder-Smith, D. Fernholz, Y. Kuboyama, E. B. Hedman, Ming-Zher Poh, and R. W. Picard, “iCalm: Wearable sensor and network architecture for wirelessly communicating and logging autonomic activity”, Information Technology in Biomedicine, IEEE Transactions on, vol. 14, no. 2, pp. 215–223, 2010.
REFERENCES
[70] Javad M. Akhlaghinia, “Occupancy monitoring and prediction in ambient intelligent environment”, PhD Thesis, School of Science and Technology, Nottingham Trent University, 2010. 18, 21,22, 23, 38
[71] R. Ali, M. ElHelw, L. Atallah, B. Lo, and Guang-Zhong Yang, “Pat-tern mining for routine behaviour discovery in pervasive healthcare envi-ronments”, in Information Technology and Applications in Biomedicine, 2008. ITAB 2008. International Conference on, 2008, pp. 241–244. 18
[72] M. Ros, M. Delgado, and A. Vila, “A system to supervise behaviours using temporal and sensor information”, in Fuzzy Systems (FUZZ), 2010 IEEE International Conference on, 2010, pp. 1–8. 18,29
[73] Panagiota Kitsantas, Trent W. Moore, and David F. Sly, “Using classifi-cation trees to profile adolescent smoking behaviors”, Addictive Behaviors, vol. 32, no. 1, pp. 9–23, 1 2007. 18
[74] Yu-Jin Hong, Ig-Jae Kim, Chul Ahn Sang, and Hyoung-Gon Kim, “Activity recognition using wearable sensors for elder care”, in 2008 Second Interna-tional Conference on Future Generation Communication and Networking (FGCN), Piscataway, NJ, USA, 13-15 Dec. 2008 2008, Imaging Media Res. Center, Korea Inst. of Sci. Technol., Seoul, South Korea, vol. 2, pp. 302–5, IEEE. 18
[75] H. Madokoro, K. Honma, and K. Sato, “Classification of behavior patterns with trajectory analysis used for event site”, inNeural Networks (IJCNN), The 2012 International Joint Conference on, 2012, pp. 1–8. 18
[76] N. Suzuki, K. Hirasawa, K. Tanaka, Y. Kobayashi, Y. Sato, and Y. Fujino, “Learning motion patterns and anomaly detection by human trajectory analysis”, in Systems, Man and Cybernetics, 2007. ISIC. IEEE Interna-tional Conference on, 2007, pp. 498–503. 18
[77] S. Nishio, H. Okamoto, and N. Babaguchi, “Hierarchical anomality de-tection based on situation”, in Pattern Recognition (ICPR), 2010 20th International Conference on, 2010, pp. 1108–1111. 18
![Figure 2.1: Energy consumption in the UK by sectors [10].](https://thumb-us.123doks.com/thumbv2/123dok_us/8769992.898416/28.595.113.500.148.388/figure-energy-consumption-uk-sectors.webp)
![Figure 2.2: Energy consumption by energy source and sector in the UK (2010)[10].](https://thumb-us.123doks.com/thumbv2/123dok_us/8769992.898416/29.595.116.502.147.389/figure-energy-consumption-energy-source-sector-uk.webp)
![Figure 2.3: Different time-series feature representation [93]: a) binary data rep-resentation b) change point representation.](https://thumb-us.123doks.com/thumbv2/123dok_us/8769992.898416/40.595.152.464.278.550/figure-dierent-series-feature-representation-binary-resentation-representation.webp)
