International Journal of Emerging Technology and Advanced Engineering
Website: www.ijetae.com (ISSN 2250-2459, ISO 9001:2008 Certified Journal, Volume 3, Issue 6, June 2013)
255
Probabilistic Neural Network for the Automatic Detection of
QRS-complexes in ECG using Slope
M. K. Bhaskar
1, S. S. Mehta
2, N. S. Lingayat
31
Associate Professor, 2 Professor, Department of Electrical Engg., MBM Engg. College, JNV University, Jodhpur-India
3Head, Department of Electrical Engg., Dr. B. A. T. University’s, I.O.P.E, Lonere-402103, Maharashtra-India
Abstract— This paper presents the application of
Probabilistic Neural Networks (PNN) for the classification automatic detection of QRS-complexes in Electrocardiogram (ECG). Raw ECG signal contains the power line interference and baseline wander. This can be removed by using Digital filtering techniques. For the QRS-detection, Probabilistic Neural Networks is used as pattern classifier. MATLAB is applied to implement the proposed algorithm. The performance of the algorithm is validated using each lead of the 12-lead simultaneously recorded ECGs from the dataset-3 of the CSE multi-lead measurement library. The QRS-complexes detection rate of 99.23% is achieved. The percentage of false positive is 1.03% and false negative is 0.77%. The overall results obtained of the PNN in terms of the detection rate performance in comparison to the other methods reported in literature. The proposed algorithm shows the effectiveness for QRS-detection.
Keywords— Detection, Electrocardiogram (ECG),
Morphologies of QRS-complexes, Probabilistic Neural Networks (PNN), QRS-complexes.
I. INTRODUCTION
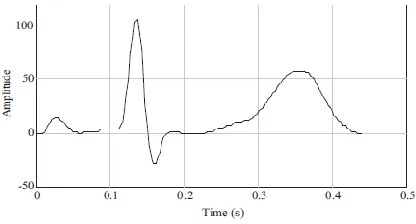
[image:1.612.337.545.237.349.2]The ECG signal provides important information about the electrical activity of the heart. The electrical activation (depolarization) and recovery (repolarization) of the heart can be measured by using a series of electrodes placed on certain specific points on the body surface.Fig. 1 shows an ECG signal consists of a different wave sequence of P-wave, QRS-complex and T-wave in each beat of ECG signal. ECG is method to express about cardiac abnormalities of the heart‘s electrical activity. Since the electrical activity of both atria and ventricles is reflected in ECG, the test is of particular value in defining cardiac rhythms. Heart related diseases which results in changes in the myocardial muscle mass will changes the ECG. For example, an increase in ventricular muscle mass (hypertrophy) usually results that increased in amplitudes of QRS-complex. Some diseases which cause death of heart muscle and replacement by scar tissue (such as myocardial infractions) will be reflected in characteristic changes in morphology of the QRS-complex. Therefore, QRS-detection is an important step in almost all automated ECG analysis systems.
Fig.1 Electrocardiogram (ECG) signal
The extensive review of the various methods developed for the detection of QRS-complexes is given in [1-4]. Few other QRS-detectors are reported recently using Hybrid Complex Wavelet [5], transformative approach [6], PCA-ICA based algorithm [7], continuous wavelet transform [8], multiscale filtering based on mathematical morphology [9], Support Vector Machine [10-13] Adaptive quantized threshold [14] etc. Most of the QRS-detectors consist of two main stages: a preprocessing stage, including linear filtering followed by nonlinear transformation and the decision rule [2]. Digital filtering techniques are used in the present work to remove power line interference and baseline wander present in the ECG signal during preprocessing stage.
PNN is used as a classifier to detect QRS and non-QRS regions. Most of the QRS detection algorithms reported in literature detects R-peak locations and separate rules are applied for the delineation of QRS i.e. to locate the onsets and offsets of the QRS complexes. The proposed PNN based algorithm not only detects the QRS complexes but also delineates it simultaneously. The onsets and offsets of the detected QRS complexes are well within the tolerance limits specified by the expert cardiologists in the CSE study and are available in the CSE library.
International Journal of Emerging Technology and Advanced Engineering
Website: www.ijetae.com (ISSN 2250-2459, ISO 9001:2008 Certified Journal, Volume 3, Issue 6, June 2013)
256 If the searching space is large, the training time becomes prohibitively long, without guaranteed global minimum. Another drawback of such architecture is that it is difficult to decide not only how many layers are needed but also how many neural nodes are required in each layer. All these parameters have to be tried experimentally, which is very time consuming. Furthermore, if the architecture of the neural network is decided after these trials and then architecture is once fixed, the network will have difficulty to adapt itself to a new environment. To overcome these shortcomings, Probabilistic Neural Networks (PNN) was proposed by Specht in 1988 [15].
PNN may require more neurons than a standard feed-forward back propagation network, but they require less set-up time and training time. PNN‘s works best when an adequate number of samples are available to train with and those samples possess good class distinctions. The PNN has been chosen as the network model to use in the present problem of QRS-detection. This paper is structured as follows. A brief architecture of the PNN is described in section 2. In section 3, preprocessing of the ECG signal is explained. Description of the dataset 3 of the CSE multi-lead measurement library is provided in section 4. An algorithm for the detection of the QRS-complexes is explained in section 5. The detection results of the proposed algorithm are reported in section 6 with the aid of computer simulations.
II. ARCHITECTURE OF PROBABILISTIC NEURAL NETWORK
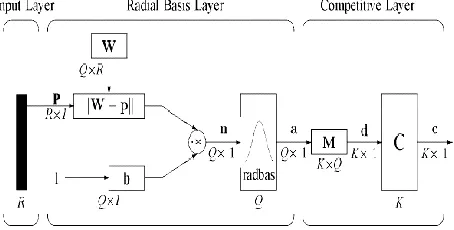
An The PNN provides a general solution to pattern classification problems. The basic idea behind PNN is the Bayes classification rule and Parzen‘s method of density estimation. The architecture and computation units of PNN implement these approaches. The most important advantage of PNN is that training is easy and instantaneous. Weights are not trained but assigned. Existing weights will never be altered but only new vectors are inserted into weight matrices during training. The PNN model of Mathwork‘s Matlab Neural Network Toolbox has been used in the present work for the detection of QRS-complexes. The architecture of the PNN is shown in Fig. 2. The symbols and notations used in the Matlab Neural Network Toolbox are adopted in this section to describe the architecture of PNN. It has three layers: the input layer, the Radial Basis Layer and the competitive layer. Radial basis layer evaluates vector distances between input vector and row weight vectors in the weight matrix. These distances are scaled by Radial Basis Function non-linearly.
Then the competitive layer finds the shortest distance among them, and thus finds the training pattern closest to the input pattern based on their distance.
The R×1 dimensional input vector p is presented as a black vertical bar as shown in Fig. 1. In Radial Basis Layer, the vector distances between input vector p and the weight vector made of each row of the weight matrix W are calculated. The vector distance is defined as the dot product between the two vectors. Assuming the dimension of W as
Q×R, the dot product between p and the ith row of W produces the ith element of the distance vector || W – p || , whose dimension is Q×1 as shown in Fig. 1. Then, the bias vector b is combined with || W – p || by an element by element multiplication, represented as ‗.*‘ in Fig. 2 and the result is denoted as n = || W – p ||.*b.
The transfer function in PNN has built into a distance criterion with respect to a center. It is defined as
2
)
(
n
e
n
radbas
(1)Each element of n is substituted in Eq. (1) and produces corresponding element of a, the output vector of Radial Basis Layer. The ith element of a can be represented as
a
i
radbas
(
W
i
p
.
*
b
i)
(2)Where Wi is the vector made of the ith row of W and bi is the ith element of bias vector b.
[image:2.612.331.558.564.679.2]The ith element of a equals to 1 if the input p is identical to the ith row of input weight matrix W. Radial basis neurons with a weight vector close to the input vector p produces a value near 1 and then its output weights in the competitive layer will pass their values to the competitive function. It is also possible that several elements of a are close to 1 since the input pattern is close to several training patterns.
International Journal of Emerging Technology and Advanced Engineering
Website: www.ijetae.com (ISSN 2250-2459, ISO 9001:2008 Certified Journal, Volume 3, Issue 6, June 2013)
257
Q=number of input/target pairs = number of neurons in layer 1 and K=number of classes of input data = number of neurons in layer 2.
There is no bias in a competitive layer. In this layer, the vector a is first multiplied with layer weight matrix M, producing an output vector d. The competitive function c, produces 1‘s corresponding to the largest element of d and 0‘s corresponding to the other elements. The output vector of the competitive function is denoted as c.
III. PRE-PROCESSING OF ECGSIGNAL
A recorded ECG signal may contain noise from various sources. Therefore, before any kind of processing these noises should be minimized. This section describes the techniques used for the removal of power line interference, baseline wander and enhancement of the ECG signal. A raw ECG signal of a patient is acquired. The finite impulse response (FIR) notch filter proposed by Alste and Schilder [16] has been used to remove baseline wander. The adaptive filter to remove baseline wander is a special case of notch filter, with notch at zero frequency (or dc). This filter has a ―zero‖ at dc and consequently creates a notch with a bandwidth of (µ/π)*fs , where fs is the sampling frequency of the signal and µ is the convergence parameter. Frequencies in the range 0-0.5 Hz are removed to reduce the baseline drift. The convergence parameter used is 0.0025. The filter proposed by Furno and Tompkins [17] has been used to remove 50Hz power line interference.
IV. CSEECGDATABASE OF ECG
The dataset-3 of CSE multi-lead measurement library [19] is used in the present study to validate the detection and delineation results of the proposed algorithm. This library has been developed to standardize and evaluate the performance of computer measurement programs. It consists of 125, original 12-lead simultaneously recorded ECGs covering a wide variety of cardiac abnormalities such as incomplete right bundle branch block, complete right bundle branch block, left anterior fascicular block, complete left bundle branch block, acute myocardial infraction, anterior myocardial infraction, postero-diafragmatic myocardial infraction, lateral or high-lateral myocardial infraction, apical myocardial infraction, myocardial infraction + intraventricular, conduction defect, left ventricular hypertrophy, right ventricular hypertrophy, pulmonary emphysema, ischemic ST-T changes, bigeminy, trigeminy, multiple PVC‘s, multiple APC‘s, supraventricular tachycardia, atrial flutter, atrial fibrillation, 1st AV-block, 2nd AV-block, Wolf-Parkinson-white syndrome, pacemaker, etc.
Every record picked from CSE ECG database is of 10 sec duration sampled at 500 samples per second thus giving 5000 samples. These ECGs were analyzed by a group of five referee cardiologists and eleven different computer programs. Attention was focused on the exact determination of the onsets and offsets of P, QRS and T-waves. Median results of the referee‘s coincided best with the medians derived from all the programs studied in the CSE library and therefore combined program median can be used as a robust reference.
V. FEATURE SIGNAL GENERATION
Slope is used as an important discriminating feature because slope of the ECG signal is greater in the QRS-region than in the non-QRS-QRS-region. The slope at every sampling instant is calculated and then squared to enhance the QRS-complexes. This is then smoothened using moving window integrator. Various window sizes ranging from 10 samples to 40 samples were tried in the present work. The window size of 20 samples was found optimum. Too large window size affects the onsets and offsets of the detected QRS-complexes where as too small size leads to more number of false negatives. By using this technique the feature signal in which QRS-complexes has been enhanced while other components are suppressed.
VI. QRS-DETECTION ALGORITHM
The PNN model of Mathwork‘s Matlab (7.5) Neural Network Toolbox is used for the detection of QRS-complexes. In this section a formal QRS detection algorithm is presented.
Step 1: Preprocessing
1.1 Acquire raw ECG signal.
1.2 Use digital filtering techniques to remove baseline wander and power line interference.
1.3 Calculate the slope at every sampling instant of the filtered ECG signal.
1.4 Calculate the square of the slope at every sampling instant of the filtered ECG signal.
1.5 Feature signal is generated, using moving average criteria with 20 samples window size of the filtered ECG signal.
1.6 Normalized the feature signal of 20 samples window size of the filtered ECG signal.
Step 2: Training of PNN
International Journal of Emerging Technology and Advanced Engineering
Website: www.ijetae.com (ISSN 2250-2459, ISO 9001:2008 Certified Journal, Volume 3, Issue 6, June 2013)
258 2.2 Transform the data into the format of PNN. Training
instance matrix is an R by Q matrix of Q training instances. Where R = No. of elements in the input vector. In this case, the number of training instances is equal to the number of samples of the selected of ECG covering a wide variety of QRS morphologies. 2.3 Select the value of spread factor (SF). The value of s
cannot be selected arbitrarily. A too small spread factor (SF) value can result in a solution that does not generalize from the input/ target vectors used in the design. In contrast, if the spread constant is large enough, the radial basis neurons will output large values for all the inputs used to design a network. The optimum value of SF obtained in the present work is 0.1.
Step 3: Testing of PNN
3.1 Begin with the first record of the CSE ECG data set- 3.
3.2 Each record from CSE ECG data set 3 is of 10 second duration sampled at 500Hz, giving 5000 samples, i.e. 5000 testing instances.
3.3 For each testing instance, testing label of ―1‖ is obtained if it belongs to the QRS region and a label of ―0‖ is obtained if it belongs to the non-QRS region.
Step 4: Post processing phase
4.1 Club the continuous train of labels of 1‘s from the predicted labels to form a pulse of unit amplitude. Pick up the trains of labels of 1‘s and using their duration, calculate average pulse duration of 1‘s. Those trains of 1‘s, whose duration turns out to be more than the average pulse duration, can be marked as QRS regions and the other ones as non-QRS regions.
4.2
In some cases, when the P or T waves are peaky in nature, the PNN gives trains of labels of 1‘s but of smaller duration as compare to that of QRS complex. In order to differentiate between trains of labels of 1‘s for QRS complex and peaky P or T waves, calculate an average duration of all the trains of labels of 1‘s.Those trains of labels of 1‘s whose duration is greater than average pulse duration can be picked up as QRS complexes and those whose duration is smaller than the average pulse width can be discarded. Thus, average pulse duration criterion reduces the number of false positive detections.
VII. TEST RESULTS
Table-1 displays the lead-wise test results of the QRS-detection algorithm using slope as a feature. Detection rate (DR) of 99.23% is achieved when slope is used as a feature. The percentage of false positive detection is 1.03% and false negative detection is 0.77%. The false positive detections are relatively more. This is mainly due to the peaky P and T-waves in some records. Highest detection rate is obtained in lead-aVR and the lowest detection rate is obtained in lead-aVF. False positive detections are more in lead III, aVL, aVF, V3 and V6. False negative detections are more in lead II, aVF and V3 compared to other leads. Table-2 shows the comparison with other referred methods is that the proposed method quite encouraging and good detection rate.
TABLE-1
LEAD-WISE DETECTION OF THE QRS-COMPLEXES
Lead Total QRS
Correct Detection
False Positive
False Negative
% Detection
I 1488 1475 7 13 99.13
II 1488 1472 15 16 98.92
III 1488 1476 19 12 99.19
aVR 1488 1484 17 04 99.73
aVL 1488 1477 18 11 99.26
aVF 1488 1464 20 24 98.39
V1 1488 1483 11 05 99.66
V2 1488 1477 15 11 99.26
V3 1488 1469 18 19 98.72
V4 1488 1482 17 06 99.60
V5 1488 1479 04 09 99.40
V6 1488 1481 23 07 99.53
Total 17856 17719 184 (1.03%)
137 (0.77%)
International Journal of Emerging Technology and Advanced Engineering
Website: www.ijetae.com (ISSN 2250-2459, ISO 9001:2008 Certified Journal, Volume 3, Issue 6, June 2013)
259
TABLE-2
COMPARISON OF PROPOSED PNN BASED ALGORITHM WITH OTHER
QRS-DETECTION ALGORITHMS VALIDATED USING CSE DATABASE
Sr.
No. Reference Method
Number of Cases/beats used for testing
Detection rate
1
Proposed Algorithm (Slope as feature)
Probabilistic Neural Network
125 cases,
17856 beats 99.23%
2 Mehta and Lingayat [12] Support vector machine 125 cases, 17856 beats 99.30%
3 Chouhan and
Mehta [13]
Adaptive quantized threshold
125 cases,
17856 beats 98.56%
4 Mehta et al. [18] Pattern
Recognition 100 cases 99.83%
5 Saxena et al. [19] Wavelet
transform 125 cases 99.86%
6 Gritzali[20]
Length and energy transformation
14292 beats 99.60%
7 Kyrkos et al. [21]
Time recursive prediction technique
1181beat 99%
8 Trahanias, and
Skordalalkis [22]
Bottom up
approach 14292 beats 98.49%
9 Trahanias[23] Mathematical
morphology 14292 beats 99.38%
10 Vijaya et al. [24] Neural network 3657beats 98.96%
The following cases illustrate the effectiveness of the PNN based algorithm for a given problem of QRS-detection.
Fig. 3 explains procedural steps for QRS-detection algorithm using slope as feature of lead aVF of record MO1_018. Fig. 3(a) shows raw ECG signal. Fig. 3(b) shows filtered ECG whereas it can be seen that 50-Hz power line interference and base line wander has been removed. Fig. 3(c) & (d) shows the slope & square of the slopes. It can be seen that from Fig. 3(d) that the signal in QRS-region is enhanced whereas signal in non-QRS-region, it is suppressed. This reduces the burden on the PNN classifier. Fig. 3(e) shows more enhanced signal is called feature signal and this feature signal is generated by using moving average window of 20 sample sizes. Fig. 3(f) shows the location of QRS-complexes identified by PNN. It can be seen that all the QRS-complexes have been correctly identified. The Fig. 3(g) shows the QRS-detection by PNN after post-processing.
1 501 1001 1501 2001 2501 3001 3501 4001 4501 Time ( Data Samples )
A
mp
li
tu
d
e
(a)
(b)
(c)
(d)
(e)
(f)
[image:5.612.336.562.133.289.2](g)
Fig. 3 : Steps for QRS-detection algorithm using PNN and Slope as feature of lead aVF of record MO1_018 (a) Raw ECG (b) Filtered ECG (c) Slope of the filtered ECG (d) Square of the slope (e) Feature
signal (f) QRS-detection by PNN (g) QRS-detection by PNN after post-processing
Some of the ECG signal has peaky P and T-Waves, inverted peaky P and T-Waves, some noisy signals look like a QRS region, P and T-Waves. Therefore, due to presence of this kind of signal mentioned above, the algorithm wrongly detects as false positive case. So, post-processing phase is developed and applied in the algorithm. In this post-processing phase, the average width of the candidate QRS-Complexes is calculated. If the width of a candidate QRS-complex is less then the average width then those QRS-detection is discarded & if it is more, it is identified as QRS-complex. Thus, post-processing reduces the false positive cases and improves the accuracy of the algorithm.
[image:5.612.45.296.165.432.2]International Journal of Emerging Technology and Advanced Engineering
Website: www.ijetae.com (ISSN 2250-2459, ISO 9001:2008 Certified Journal, Volume 3, Issue 6, June 2013)
260 1 501 1001 1501 2001 2501 3001 3501 4001 4501
Time ( Data Samples )
A
mp
li
tu
d
e
(a)
(b)
[image:6.612.67.284.137.303.2](d) (c)
Fig. 4 : Detection of QRS-complexes using Slope as feature in Lead-L1 of record MO1_103 (a) Raw ECG (b) Filtered ECG (c) Feature
signal (d) QRS-detection by PNN
Fig. 5 illustrates QRS-detection in lead aVF of record MO1_045. As displayed by the curve Fig. 5(b), the amplitude of the 8th QRS-complex is very low as compare to the other QRS-complexes. Therefore its slope value is very low as shown by the curve in Fig. 5(c). Therefore, the algorithm fails to detect this QRS-complexes having lower amplitude. Any attempt to detect 8th QRS-complex by the way of adjusting the parameters of PNN increases the overall number of false positives.
1 501 1001 1501 2001 2501 3001 3501 4001 4501
Time ( Data Samples )
A
mp
li
tu
d
e
(a)
(b)
(d) FN
[image:6.612.65.277.456.624.2](c)
Fig. 5 : Detection of QRS-complexes using Slope as feature in Lead-aVF of record MO1_045 (a) Raw ECG (b) Filtered ECG (c) Feature
signal (d) QRS-detection by PNN
VIII. CONCLUSION
ECG is method to express about cardiac abnormalities of the heart‘s electrical activity. Since the electrical activity of both atria and ventricles is reflected in ECG, the test is of particular value in defining cardiac rhythms. Heart related diseases which results in changes in the myocardial muscle mass will changes the ECG. For example, an increase in ventricular muscle mass (hypertrophy) usually results that increased in amplitudes of QRS-complex. Some diseases which cause death of heart muscle and replacement by scar tissue (such as myocardial infractions) will be reflected in characteristic changes in morphology of the QRS-complex. Therefore, QRS-detection is an important step in almost all automated ECG analysis systems.
Much work has been carried out in the field of QRS-detection. Though the performance is good, each method has situations where it fails. Using the CSE database, the algorithm performed effectively with accurate QRS-detection over 99.23% of the total beats, even in the presence of peaky P and T-waves and wide variety of QRS-morphologies. The algorithm can be implemented by using PNN architecture of MATLAB to reproduce the results. The PNN model of Mathwork‘s Matlab Neural Network Toolbox has been used in the present work for the detection of QRS-complexes.
REFERENCES
[1] B. U. Kohler, C. Henning, and R. Orglmeister, ―The principles of software QRS detection,‖ IEEE Eng. in Med. and Bio., vol. 21, pp. 42-47, 2002.
[2] F. Gritzali, ―Towards a generalized scheme for QRS Detection in
ECG waveforms,‖ in Signal Processing, vol. 15, 1988, pp. 183-192.
[3] O. Pahlm and L. Sornmo, ―Software QRS detection in ambulatory
monitoring- A review,‖ Med. Biol. Eng. Comp., vol. 22, pp. 289-297, 1984.
[4] G. M. Friesen, T. C. Jannett, M. A. Jadallah, S. L. Yates, S. R. Quint, and H. T. Nagle, ― A Comparison of noise sensitivity of nine QRS detection algorithms‖, IEEE trans on Biomed. Engg., vol. 37, pp. 85-98, 1990.
[5] P. J. M. Fard, M. H. Moradi, and M. R. Tajvidi, ―A novel approach
in R peak detection using Hybrid Complex Wavelet,‖ Int. J. Card., 2007, doi:10.1016/j.ijcard.2006. 11.136.
[6] M. B. Messaoud, ―On the algorithm for QRS complex localization in
Electrocardiogram‖, I. J. of Computer Science and Network Security, vol. 7, pp. 28-33, 2007.
[7] M. P. S. Chawla, H. K. Verma, V. Kumar, ―A new statistical
International Journal of Emerging Technology and Advanced Engineering
Website: www.ijetae.com (ISSN 2250-2459, ISO 9001:2008 Certified Journal, Volume 3, Issue 6, June 2013)
261
[8] A. Ghaffari, H. Golbayni, and M. Ghasemi, ―A new mathematical
based QRS detectorsusing continous wavelet transform,‖ Computers and Electrical Engg. 2007. doi:10.1016/j.compeleceng.2007.10.005
[9] F. Zhang and Y. Lian, ―Electrocardiogram QRS detectionusing
multiscale filtering using wavelet transform,‖ Proc. 29th Annual Int.
Conf. of the IEEE EMBS, Lyon, France, pp. 3196-3199, Aug. 2007.
[10] S. S. Mehta and N. S. Lingayat, ―Development of Entropy based
algorithm for cardiac beat detection in 12-lead electrocardiogram,‖ Sig. Proc., vol. 87, pp. 3190-3201, 2007.
[11] S. S. Mehta and N. S. Lingayat, ―Combined Entropy based method
for detection of QRS complexes in 12-lead electrocardiogram using SVM,‖ Comp. in Biol. and Med, vol. 38, pp. 138-145, 2008. [12] S. S. Mehta and N. S. Lingayat ―Detection of QRS Complexes in
Electrocardiogram using Support Vector Machine,‖ Journal of Medical Engineering and Technology, vol. 32, no. 3, pp. 206-215, 2008.
[13] S. S. Mehta and N. S. Lingayat ―SVM-based algorithm for
recognition of QRS complexes in Electrocardiogram,‖ ITBM-RBM (2008),doi:10.1016/j.rbmret.2008.03.006
[14] V. S. Chouhan and S. S. Mehta, ―Detection of QRS-complexes in
12-lead ECG using adaptive quantized threshold,‖ IJCSNS International Journal of Computer Science and Network Security, vol.8, no.1, pp. 155-163, 2008
[15] D. F. Specht, ―Probabilistic neural networks for classification,
mapping, or associative memory,‖ Proc. IEEE Int. Conf. Neural Networks, San Diego, CA, vol. 1, pp. 525-532, July 1988.
[16] J. A. Van Alste, and T.S. Schilder, ―Removal of base-line wander and power line interference from the ECG by an efficient FIR filter with a reduced number of taps,‖ IEEE Trans. Biomed. Eng., vol. 32, pp.1052- 1059, 1985.
[17] G. S. Furno, and W. J. Tompkins, ―A learning filter for removing noise interference,‖ IEEE Trans. Biomed. Eng., vol. 30, pp. 234-235, 1983.
[18] J.L. Tou and R.C. Gonzalez, Pattern Recognition Principles,
Addison-Wesley Publishing Company MA, 1974
[19] J. L. Willems, P. Arnaud, J. H. Van Bemmel, P. J. Bourdillon, R. Degani, B. Denis, I. Graham, F. M. A. Harms, P. W. Macfarlane, G. Mazzocca, J. Meyer, and C. Zywietz, ―A reference database for multilead electrocardiographic computer measurement programs,‖ J. Amer. Coll. Cardiol., vol. 10, pp. 1313-1321, 1987.
[20] S. S. Mehta, S.C. Sexana and H.K Verma, Computer-aided
interpretation of ECG for diagnostics, Int. J. of System Science, vol. 27, pp. 43-58, 1996.
[21] S. C. Saxena, V. Kumar, S. T. Hamde, Feature extraction from ECG
signals using wavelet transform for disease diagnostics, Int. J. of System Science, vol . 33, pp. 1073- 1085, 2002.
[22] F. Gritzali, Towards a generalized scheme for QRS Detection in
ECG waveforms, Signal Processing, vol.15, pp. 183-192, 1988.
[23] A. Kyrkos, E. A. Giakoumakis, G. Carayannis, QRS detection
through time recursive prediction technique, Signal Processing, vol. 15, pp. 429-436, 1988.
[24] P. Trahanias, E. Skordalalkis, Bottom up approach to the ECG
pattern-recognition problem, Med. Bio. Eng. and Compu., vol . 27, pp. 221-229, 1989.
[25] P. E. Trahanias, An approach to QRS complex detection using
mathematical morphology, IEEE Trans. Biomed. Eng., vol . 40, pp. 201-205, 1993.
[26] Vijaya G, Kumar V, and Verma H. K., Artificial Neural Network
Based Wave Complex Detection in Electrocardiograms, Int. J. of System Science, vol. 28, 1997, pp125-132.
[27] Zahia Zidelmal, Ahmed Amirou, Mourad Adnane, Adel
Belouchrani, ―QRS detection based on wavelet coefficients‖, Computer Methods and Programs in Biomedicine,Volume 107, Issue 3, Pages 490-496, September 2012.
[28] Shih-Chin Fang, Hsiao-Lung Chan, ―QRS detection-free