Validating the new student evaluation
form
Fox, RP
Title
Validating the new student evaluation form
Authors
Fox, RP
Type
Monograph
URL
This version is available at: http://usir.salford.ac.uk/2112/
Published Date
1998
USIR is a digital collection of the research output of the University of Salford. Where copyright
permits, full text material held in the repository is made freely available online and can be read,
downloaded and copied for noncommercial private study or research purposes. Please check the
manuscript for any further copyright restrictions.
From Quantitative to Qualitative Assessment: evaluating student questionnaires of teaching effectiveness
Roland Fox, Dept. of Business, Salford University, M5 4WT, U.K.
ABSTRACT
This paper records a process of organizational change with respect to evaluating student questionnaires. Salford University has largely replaced what many would term the traditional approach (based on mean class scores using a 5-point scale) with an analysis of comments. As well as recording the change itself, the rationale for the change is also explored in the form of two critical assessments. The first is a critique of the current literature, where it is argued that insufficient attention is paid to the criteria for implementation. Reported results meet academic but not practical criteria. The second critique assesses initial organizational reactions to the evaluative approach and assesses validation issues.
Introduction
In most higher education establishments in the UK, North America and Australia, students are regularly asked to evaluate their current modules. The process is familiar to most, questionnaires are distributed usually per module per year, but also on a rota basis - some courses evaluate sections and even individual sessions separately. The number of questions varies considerably from about a dozen to over 50 (e.g. Tiberius et al 1989). Typically, question responses employ 1-5 Likert type scales and results are reported as mean scores.
The subsequent use of the data varies considerably. In the UK, anecdotally, some establishments regard the results as being for personal use , others have more formal committee based procedures. The literature reports that in the US, and possibly in the UK, scores are used as input for promotion and tenure decisions, though tests suggest that the weight placed on such data may well be limited (Leventhal et al. 1981; Salthouse, McKeachie, and Lin, 1978). Scores are also used by students to make module choices, the results being a popular publication (Marsh, 1984). They are also reported as input for general reviews of the teaching process carried out by the universities own administrations (Marsh and Dunkin 1992) and by external regulatory bodies (Centra 1979). In sum, the results reach into virtually all parts of the teaching process.
The experience at Salford has, in one sense, been similar to that of other institutions. The original questionnaire introduced in 1991 contained some 16 Likert type questions on aspects of the lecturer s performance, use of teaching aids, clarity of spoken delivery, adjustment to the pace of the class, and so on. Although the questionnaire was not a standard version, it followed a similar pattern to others as reported in papers. Revisions were made in 1995, 19 questions of a similar type were now being asked. An internal study was also commissioned to examine the contribution and effects of the questionnaire. As a result, a sub committee was set up to revise the existing form. The outcome was marked. A new form was introduced consisting of only 4 questions. The first two related to overall evaluation, followed by two questions asking students to name up to 3 most liked and most disliked aspects of the module. The main emphasis of the new version was to be evaluative. Overall measures did not have to be reported in the form of means and standard deviations and comments could be listed individually, though lecturers were encouraged to group and sum similar responses.
criticisms of tradition represented by the evaluative approach, reflect unanswered concerns that arose in the review process. The second section is a summary of the University s experience of using the traditional questionnaire; and the third section outlines the rationale of the evaluative approach and initial experiences.
CRITICAL COMMENTS ON THE LITERATURE
There are many excellent reviews of the literature. To obtain a broad spectrum of the varying interpretations of the results, papers by Abrami (1994) and Marsh (1994) are recommended, and for an example of a dissident view, Newton (1998). Although the literature is large and has long since extended into meta analysis (statistical tests of data published in articles), there is nevertheless a common and quite strictly defined methodology that governs the assessment process. As many of the criticisms are methodological, a brief exposition of this aspect of the literature will be useful.
Analysis of student questionnaires is directed almost uniquely at establishing validity. This is a concept that is central to any form of psychometric testing using questionnaires (Cronbach, 1990). There is no single validity test, rather there is a series of tests addressing various aspects of validity. Nor is there a clear accept or reject criterion in relation to validity. Most individual papers address only a section of these tests, as together they are very extensive. Only in reviews are all the elements drawn together to enable an informed, but essentially subjective judgement as to validity.
Criterion validity consists of tests to see if the students’ interpretation of a question is broadly in line with that of the users of the results. The mean class scores are correlated with other data taken by the user to be a parallel measure of the same attribute. In the case of the overall evaluation score, the other output measure available to the user is the average exam and project mark. The reasoning is that if the student is assessing effectiveness and not something else, then students taught by a highly rated teacher should on average achieve higher exam marks than those who are given a lower score.
A similar concept is construct validity. A measure of overall effectiveness should be associated with commonly accepted elements of effectiveness - ability to use teaching aids, create an interest in the course, encouragement of questions etc. Also, it is argued that the scores should not be associated with rival explanations. For example, some may argue that scores are influenced by the type of subject, numbers in the class, the year of the course and so on. Tests of association with these so called divergent factors are introduced to establish that they are not significant.
The final test of validity relevant to evaluative questionnaires is of reliability. Research in this area seeks to ensure that questions on similar topics and similar questions over time are highly correlated. Where the correlations are high, the measure is considered reliable.
Tests therefore seek to establish that the consequences and the elements of effectiveness are as one would expect, and that the measure does not vary excessively due to time and student. Unavoidably, criterion validity also establishes that the measures are good. Coupled with reliability, the claim that the student scores are valid is therefore a strong claim and is rightly the central issue in the testing of questionnaires.
The differences between the two groups should not be overdone. Both accept that the questionnaire is a valid measure of effectiveness, both advocate supplementary measures but do not elaborate. It is unfortunate that the debate between the two groupings has become so heated, because there are other important issues.
The contention here is that the omissions in the debate are principally concerned with the implementation of the forms. Because there are unanswered questions, a serious gap has opened up between theory and practice. That such a gap exists is not in contention. Advocates of questionnaires ask why they are so controversial and so widely criticised (Marsh and Dunkin 1992)? Their answer, not untypical of other gap debates, is that such attitudes are the result of fear and ignorance. The view here is that validity has not been sufficiently established for practice and that research does not take sufficient account of the difference in standards between scientific investigation and use. The following comments summarise the main concerns:
The volume of literature is now so great that it is in itself a cause for concern. It is estimated that there have been some 2000 articles over 30 years (Marsh 1994). Yet still the conclusions appear tentative. Even in the ideal testing conditions of multi-section courses - where numbers are such that students are taught in parallel by different lecturers and assessed by a common exam - the conclusions are described by one of the principal reviewers as follows: specific rating dimensions, as well as global ratings, are moderately correlated with student learning in multisection college courses. On average, there exists a reasonable, but far from perfect, relationship between some student ratings and learning. To a moderate extent, student ratings are able to identify those instructors whose students learn best... (Abrami 1994). Such volume with so little by way of firm conclusions is in itself worrying. The suspicion must be that the literature has already reached a position that is not going to change greatly with further research.
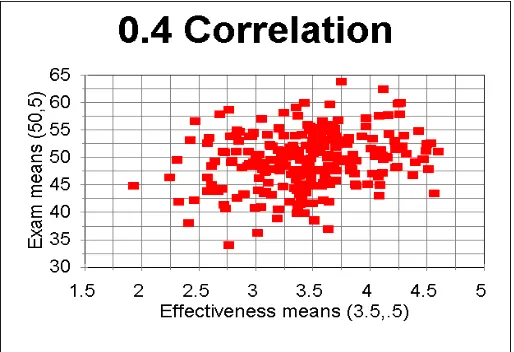
The workhorse of validity studies is the correlation coefficient. The academic benchmark for correlation is statistical significance - one that is met in one way or another by most studies. The question not addressed having established significance is: how high does the correlation have to be in order to serve as an acceptable measure for practice? There is no clear answer to this question, but it is certainly much more than statistical significance. In their standard textbook, Wonnacott and Wonnacott (1972, p.188) lament the use of the term. Although it sounds as if it is referring to a form of significance enhanced by statistics, the meaning is in fact the opposite. They suggest that the term “statistically discernable” represents the true status of this measure. In a meta analysis of multi-section studies (the most favourable scenario for testing validity) Cohen (1987) estimated that criterion validity relating assessment score to effectiveness rating was .45. But this also implies that only 20% of the variation in class averages can be explained by student evaluation of teaching effectiveness (i.e. .452). This, it should be remembered, is for students who have been randomly assigned to classes - there is no reason to expect that the averages should differ. Reviewers seem to accept that this figure is sufficient to verify that the measure meets criterion validity. But no real evidence is offered other than the size of the correlation.
To give a better idea as to how such correlations appear in practice, table 1 gives simulated results for 250 observations between mean 5-point scores and mean exam marks. The moments of the distributions have been chosen not on the basis of reported data, which for reasons of confidentiality are not reported, but rather on what is reasonable and representative of Salford’s own experience. Perfect association is not expected. The judgement of students is not perfect and the exam is not a perfect representation of effectiveness. Nevertheless, even a correlation coefficient as apparently as high as .45 implies that there is only a very loose relationship between the two scores.
Most studies find a high correlation between explanatory variables thereby creating multicollinearity. The effect is to make the regression equation very unstable in its choice of variables and the significance that it attaches to each one. The literature uses factor analysis to make up combinations of variables that are less correlated (Marsh 1991). But in a sense this is the same problem only on different ground. How are the variables making up the factor to be weighted? What are the weights of the individual factors in a combined equation? Without this information one can have very little idea as to the relative importance of the elements of teaching that make up the overall effectiveness judgement. But such vagueness raises a practical problem. If the weights cannot be determined, it is impossible to find out from the questionnaire how the overall score can be improved, so why measure? Given that users are faced with a whole battery of results, it seems natural to take a particularly low score for one aspect of the teaching and invest time and effort in improving that aspect. But it is distinctly unclear from the literature that such effort will be rewarded. As a result one sees a certain amount of questionable behaviour - a large increase in beautifully prepared manuals, particularly in the less popular subjects, is one such manifest example.
One body of opinion (Abrami and d’Appolonia 1991, Abrami 1994), does not regard the differing traits of teaching and their weights as measurable. It is argued that only an overall score should be used. In practice, one suspects that questionnaires are rarely if ever as short as this body of opinion recommends and that the temptation to ask numerous questions is too great for most institutions. Certainly, the literature predominantly reports large questionnaires.
Because the use of the scores is at best vague, validity tests have to be broad in design. The predominant concern at Salford was to identify and analyse problem courses. At the risk of adding to the literature, discriminant models of validity may be effective in identifying a subset of uses of practical significance. If better validation results can be achieved for more limited purposes, the trade-off for many users may be seen as worthwhile.
An important concern in practice is the problem of errors in measurement and their potential effect. Following the type I and type II rationale and simplifying the assessment as being either effective or ineffective, there are two types of error that can be made. Effective lecturers may be judged as ineffective and ineffective lecturers judged as effective. If effectiveness is measured by the exam score, then it would appear from Table 1 that such outcomes are not unusual. The literature does not contain case studies of such errors. From the institutions point of view, the discontent of staff who are erroneously judged as inefficient is a serious problem. Their possible loss and the retention of high scoring lecturers who do not achieve high standards of education is a potential worrying trend.
One of the principal supporting validity measures is reliability. If students change their views over time or differing students make very different judgements on essentially an unchanged course, there are obvious measurement problems. Longitudinal studies of the same students are lacking, though one study suggests that the means are stable over time though there is considerable movement within the mean (Marsh 1984). Other studies based on the judgements of differing groups of students produce correlation of between .6 and .85 (36% and 72% of the variance respectively, Marsh 1992). The shape of the correlation is instructive. Table 2 is a plot of simulated results for a correlation of .85 between two sets of mean scores again with reasonable moments. At the .85 level, the comparison would be likely to be for the same teacher course combination and different students. As can be seen, the relationship is much better than in Table 1 but the line is still quite ‘thick’. Unfortunately papers do not report plots, but they seem unlikely to be too different.
surely it can also happen in the abstract world of opinions. Peer views are more informed, and perhaps their lack of agreement is a sign that the phenomenon that is being measured does not behave quite as regularly as supposed when viewed ‘close-up’. An anecdote illustrates the practical consequences:
A lecturer at Manchester University, now a professor, was asked to teach a first year management accounting course. Although very different from his specialism in auditing, by his own admission he struggled through by relying on the textbook. The questionnaire asked the students to evaluate the lecturer’s knowledge of the subject. Of course, he received a higher rating for management accounting than for auditing. His explanation was that in auditing he would try to show both sides of a problem, whereas in management accounting he merely gave the textbook answer.
The pressure to give a simplified account of ones subject is clearly there, a similar anecdote is given by Newton (1988). Perhaps it is unfair to report isolated incidents, but it is only to underline what most would accept without question. A student’s judgement is naïve. Although they are experienced receivers of instruction, they are not aware of the subject of which they have received only a sample exposition. That their judgement does not change is solely a measurement issue, it does not imply that they have seen any deeper into the problem than an academic. Furthermore, one must strongly expect that the uncertainties of judgement are real, and that this is the cause of differences in academic assessments.
Content validity in part seeks to ensure that divergent variables do not offer better competing explanations. But it is almost inevitable that, for instance, a statistics course on a business degree will never score as highly as psychology, later years with smaller groups are also likely to score well. Some papers refer to adjustments being easily made (Koon and Murray 1995). But it is not clear, to this user at least, as to how this is to be done. The problem does not appear to be addressed in any operational sense in the literature. Also, where the argument is that comparisons should be limited, how does one determine the limits?
These seven critical points have centred on the validation process. The general criticism has been that there has been insufficient attention to the problems of practice. But it would be wrong to assert that the literature has not concerned itself with this area. The following selects the two principal issues.
One of the more obvious concerns in implementing questionnaires is that lecturers may attempt to ‘buy’ higher scores by giving undeservedly high marks or lowering grades. A much quoted paper (Ryan et al. 1980) suggests that this did indeed happen. Yet reviews are clear that the grading leniency hypothesis as it is called has no bearing on the average effectiveness score. Accepting that this is so, there is perhaps insufficient appreciation of the position in which teachers are placed. It has already been suggested that failures in content validity have resulted in a form of an induced psychosis as teachers try to guess the weights placed on factors by students. One should also appreciate that the levers at the disposal of lecturers are relatively few. It seems entirely possible that such behaviour may persist in spite of a lack of evidence that it is effective. After all, even though the benefit may be very small, the cost to the lecturer is negligible.
A second area concerned with implementation is concerned with feedback studies. Research here seeks to measure the tangible benefits of having an interim questionnaire and assessing the effects of a mid term review. There are methodological problems, studies tend to be based on volunteers and to last for just one term. Nevertheless, these studies show a small beneficial effect. The practical aspects of having even more questionnaires is daunting to say the least. But there are two further concerns. What is the alternative? And does this beneficial effect extend to years or is any improvement lost in the variation between years?
to improve them. But one must be concerned at such interpretations as the literature shows that a considerable amount of the difference in scores is unexplained.
Whether there is improvement over time is not evident in the scores (Feldman 1983). Perhaps more generally one might ask whether levels of learning have improved over the years. Comparisons of exam papers and answers would be a useful exercise.
To sum up, this critical review of the acknowledged gap between theory and practice has suggested that tests rather than practice are lacking. Although the measures meet academic, exploratory standards, their operational strength is questionable. If measures are prone to error, then there is a need to assess the cost of measurement error. There is also a lack of case study and anecdotal evidence from users that this approach has been responsible for real improvements. Ultimately validation must persuade. Given the relatively poor strength of the statistics and the somewhat dismissive attitude to the problems of practice, there is little to persuade the user that questionnaires are a net benefit.
THE EXPERIENCE AT SALFORD
In 1991, a questionnaire form was introduced consisting of 16 questions asking students to score on a 5-point scale a number of lecturer related attributes. Summarized results were distributed to members of staff and the process became integrated into the University assessment procedures.
A paper based on the summarized scores reported findings similar to Abrami and d’Appolonia (1991) (Fox ,1994). Firstly, no criterion validity was established - there were no relationships between exam marks and teaching attributes. Secondly, significant correlations existed between scores and divergent factors such as year subject difficulty and the type of subject. The application problems were evident. Juxtaposed in a Business Department are psychology courses scoring 4.6 and accounting courses scoring 3.5. Is this a signal that there are no problems with the psychology course but that the accounting course is experiencing difficulties? Or are we to say that the courses are not comparable. At what point does one say that there are problems, and what is the justification for a particular dividing line?
In an attempt to produce more objective results, a revised version was used in 1995. This questionnaire consisted of 19 questions that contained evaluations related to the structure (lectures, tutorials, practical sessions etc) rather than the lecturer. A questionnaire study of a small sample of lecturers (n=15) in the Business department revealed a number of divergent factors affecting the analysis. Overall effectiveness scores were influenced by the degree of numerical skills required -.73, whether a course was compulsory (1)or optional (0) -.53 and perceived importance by students, .62. Multiple regression analysis added year of course, hours per week, lecturer ambition, tendency to ask questions (dislike) and comprehensiveness of lectures (preference) as significant at the 5% level. There was also evidence of anxiety amongst staff related to overall effectiveness score -.46 and evidence that lecturers had made low scoring courses ‘somewhat easier’ -.44. Although this was a small study not intended for publication, it found wide sympathy within the University. As a result, a sub committee was set up to review module assessment procedures.
THE QUALITATIVE APPROACH
The previous questionnaire included an enhanced comments section. Instead of the traditional request for “further comments”, students were prompted to name up to 3 aspects of the course they liked and three aspects disliked. The response was much larger than the previous perfunctory request. Lecturer reaction was also much more enthusiastic, typically numbers were ignored and the comments were read with interest. This reaction very much echoes the findings by Tiberius et al (1989). The revised form built on this success by asking only two general questions followed by comments (Exhibit 1).
A number of trials were carried out to test student response and the process of reporting. It was estimated that a full manual summary took approximately 1 minutes per form. To cope with the problems that might be posed for larger courses, a computerised version is being developed. Forms using Question Mark will be posted on the intranet. These can be opened by students and e-mailed to the lecturer in much the same way as the manual version. When sending the form to the lecturer, the address will be anonymised. Lecturers will be able to check a code number that will accompany the e-mail with a listing of codes to ensure that the replies are from students on the course. It is currently estimated that this aspect may in future be automated. The system will produce a summary response of the first two questions and a listing of the comments classified into likes and dislikes. Comments will still have to be sorted, though typing and much of the sorting time will be avoided.
From an auditing perspective the preparation of reports by lecturers may seem an obvious weakness (though much the same procedure was used for the previous version). An important consideration was the concern expressed by local lecturer union representatives about the “staining” effect of slanderous comments. Apart from the legitimate union concerns, it was also felt that a more regulated approach would adversely affect the authority of the lecturer in the classroom. Some checks on the process exist in that results have to be countersigned by another member of staff who may review the supporting documents. Wholesale falsification would have to be a very deliberate act. Current results under this system report a range of opinions and do not suggest manipulation.
Consideration was also given to the problem of validity. The limited literature on the analysis of comments shows them to be well related to overall scores (Marsh 1992). A survey reported by Marsh (1992) suggests that one university regarded comments as preferable to global scores and not as good as ratings of specific teaching behaviours. Our experience is that students are more willing to make comments when there are fewer questions. That this approach should perform well when students are being asked over 30 questions is promising. Criterion validity would require some level of association between comments and an output measure (exam results). That there appears to be a good association with the overall rating is an indication that the association with mean exam results may be similar. Whether lower exam means associated with particular complaints about the lecture is undecided? These and other validity tests need to be carried out, for it is entirely possible that student complaints may ultimately have little to do with measures of the level of lecturer related learning.
If validity results were similar to the scoring approach, would evaluative methods have the same status as scores? There are arguments to suggest that there are other important qualities. If a mean score has low validity, interpretation becomes very difficult. The suggestion that students gave a low score for no clear reason is difficult to refute. In that a comment is altogether a more thoughtful act than a “tick”, they are more likely to be a valid and interpretable representation of those particular students’ feelings, even if little else can be established.
Business: I think the form is a significant improvement on the previous one. The written responses give lecturers useful feedback on which they can take action. The responses to the first question give an approval rating which, when used in conjunction with the qualitative answers provide the lecturer with an understanding as to how the module is being received...
English: Three modules were assessed last semester and staff were asked to analyse them themselves, summarise the results and suggest ways in which they would deal with the perceived problems. The questionnaire seemed very simple, well designed, and to produce clear and informative results. Students needed five minutes to fill them in. So we like it and prefer it to the previous questionnaires.
Environmental research: I am reasonably happy with the structure of the questionnaire since it encourages students to reflect upon their experiences...at the same time the first two questions act as a general indicator of quality...
Leisure and Hospitality: This questionnaire is heaps better than the predecessor, but I do not find the second question about recommending the module to be very useful - the responses are usually much the same as those of the first question, perhaps with a slight downward shift. analysing them is not difficult and these are more helpful than the graded questions.
Management: I think this form is better than the previous one and I find the qualitative comments helpful. I don’t think that more than two or three qualitative scales are necessary. However, students have queried the point of Q2. For postgraduates in particular I think there should be two satisfaction questions, one relating to content and the other relating to teaching methods.
Nursing: academic staff in the department consider the questions to be too vague ...We would like to see questions related to the availability of resources e.g. library facilities IT etc. More specific questions are required about teaching methods/ materials / environment. It would be more helpful to ask if students were aware of the modular aims and outcomes...
Physics: I have consulted one or two colleagues but do not have a consensus view. We find the second formal question ...is of very little help...The comments are the most useful part of the responses, but are difficult to treat quantitatively.
Podiatry: New format has been well received. The qualitative data is generally thought to be more useful than the quantitative. The reduced quantitative data is not more relevant...Some of our modules are taken by 70+...collating the responses can take a good deal longer than the optimistic estimate given in the instructions to module leaders.
The initial responses from users are encouraging. The predominant view appears to be that it is useful and also that the scores are more useful when read in conjunction with an analysis of the comments.
Quantitative Qualitative feedback, a brief illustrative comparison
As an example, reports form two courses in business are shown here to illustrate the problems of analysis.
Course 1
1= high score 5=low score Mean score
Explanation of course aims and objectives 3.5 Placing course in the context of the degree programme 3.4
Description of the course structure 3.8 Explanation of assessment methods 3.1
Choice of teaching aids 2.9
Use of teaching aids 2.8
Adjustment to the pace of the class 3.2 Encouragement of questions in class 3.5 Recommendation of support materials 4.0 Creating an interest in the course 3.6 Approachability on academic problems. 3.4
Feedback on assignments 3.2
Lecturers overall effectiveness 4.0
Course 2
7= high score 1=low score
Satisfaction 3.73 Recommendation 3.51
out of 60
Overall likes
Material handouts 10
Outlines 9
Reading references 7 Course design 6 Relevance to business 6 Interest 5
Core text 5
Learning real life strategies 4 Well structured / good linkages 4
Lectures likes
different lectures variety 8
Lecturers good explain well 4
Seminars Likes
Case studies 12
Seminar management 9 seminar thorough 7 regular presentations 6 seminar discussion 6
Assessment likes
course work as part of final assessment 8
Overall dislikes
A lot of reading and preparation 7 too much to remember 5
too fast 5
Lecture dislikes
sometimes too theoretical 11 lack of continuity 8 some lecture unstructured 4 lecturers patronising at times 3
Seminars dislikes
Some students read from copied notes 5
seminars should address exam technique 4
Assessment dislikes
These two courses were chosen because, although not identical, they are similar in subject and style. The difficulties of interpretation of the first form are manifest. Why is the effectiveness score so high? Recommendation of support materials and description of course structure are the next two highest scores, the choice and use of teaching aids receive the lowest scores. How important are these factors to students? There is in large measure evaluation without explanation. Possibly the low scores should be investigated further or possibly they are thought to be not especially important for this particular course or possibly they are low simply through random variation. Similar questions can be raised for almost all such questionnaire responses.
Course 2 is not the perfect alternative: a) There are no majority comments. Those who have not answered presumably have no strong feelings on the matter. b) There is a danger that one is swayed by minority opinion. c) The groupings of comments are necessarily subjective. For example, are the first four overall likes for course 2 essentially about teaching material i.e. 32 comments?
But there are advantages. a) All the comments can be understood. b) The absence of certain types of comments is a measure of reassurance. c) The characteristics of the course become clear as one reads through the comments. In other words, the questionnaire fits the particular shape of this course as it does with all other structures. d) There is a measure of assurance both from the likes and the dislikes that this is a challenging course. There is the suggestion in this example that students were giving low scores because there was a lot of reading and preparation and too many things to remember - it may have been excessive, it may not! e) The frequency score is some indication of the strength of feeling on any one matter. But low frequency comments (not reported here) can be useful. One student complained that many of the books could not be found in the library, two found some overheads too dark and cramped. These are factual complaints that may be directly relevant or may be due to a misunderstanding - but they are not to be dismissed on the basis of low frequency.
For course 2, overall scores are lower than reported for other courses in the department. However, the extent of the comments (an average of 4 per student) and their nature shows satisfaction with important aspects of the teaching process.
It may be argued that an example of just two courses is not of great relevance. On the other hand, studies that demonstrate relationships that exist on average, fail to show that they can be traced to individual results. This is important in that results are analysed on an individual basis. In this sense, the analysis here offers more reassurance that course 2 type responses can offer insights on individual courses than a statistical exercise. The e-mails provide further evidence.
SUMMARY AND CONCLUSIONS
The change in the method of evaluation at Salford has been motivated by dissatisfaction with the operation of the traditional scoring questionnaire. With regard to the literature supporting the use of scores, the principal observation here is that the standards used are those of academic investigation - the null hypothesis is of no relationship. Statistical significance in this context is perhaps better described as statistically discernable. For practice, a null hypothesis of 1 would be more appropriate. The findings of the literature are very short of this standard. Consequently, the lack of studies of the cost of errors in measurement is an important drawback.
Table 1 Plot of simulated mean exam scores with mean effectiveness scores (n=250) for differing correlations
Exhibit 1
Module Evaluative Questionnaire
Module title... Date...
Degree etc title... Year of Study...
1. Overall, how satisfied were you with this module (7 responses extremely satisfied - extremely dissatisfied
2. In response to the statement: I would recommend this module to a friend who was interested in the course Do you: (7 responses very strongly agree - very strongly disagree
3. Please comment on up to 3 aspects of the module which you like:
4. Please comment on up to 3 aspects of the module which you dislike:
Thank you for your contribution
References
Abrami, P.C. and d'Appolonia, S.,1991, 'Multidimensional students evaluations of teaching effectiveness - generalizability of 'N=1' research ; comment on Marsh (1991)'. Journal of Educational Psychology, Vol. 83, pp.411-415.
Abrami, P.C., D Appolonia, S. and Rosenfield, S., 1994, The Dimensionality of Student Ratings of Instruction: What We Know and What We Do Not, in Higher Education. a Handbook of Theory and Research, Vol. 8, Agathon Press, New York, pp.213-263.
Centra, J.A., 1979, Determining Faculty Effectiveness, San Francisco, Josey - Bass.
Cronbach, L.J., 1990, Essentials of Psychological Testing, 5th edn, Harper & Row, New York.
Eskew, R., Faley, R.H. (1988), Some Determinants in the First College Level Financial Course, Accounting Review, vol. LXIII, No.1, pp.137-147.
Fox, R.P. (1994) 'Validating lecturer effectiveness questionnaires in accounting' Accounting Education
Jacobs, L.C., 1987, University faculty and students opinions of student ratings, Bureau of Evaluative Studies and Testing, ERIC Document Reproduction Service No. ED 291291.
Koon, J., Murray, H.G., 1995, Using Multiple Outcomes to Validate Student Ratings of Overall Effectiveness, Journal of Higher Education, vol. 66, No. 1, pp.61-81.
Leventhal, L., Perry, R.P., Abrami, P.C., Turcotte, S.J.C. and Kane, B., 1981, Experimental investigation of tenure/promotion in American and Canadian universities. Paper presented at the Annual Meeting of the American Educational Research Association, Los Angeles.
L Hommedieu, R., Menges, R.J., Brinko, K.T., 1988, The effects of student ratings feedback to college lecturers: A meta analysis and review of research. Unpublished manuscript, Northwestern University, Center for the teaching professions, Evanston, IL.
Marsh, H.W., 1984, Students Evaluations of University Teaching:Dimensionality, Reliability, Validity, Potential Biases, and Utility, Journal of Educational Psychology, vol 76, No. 5, pp. 707-754.
Marsh, H.W. (1991). 'Multidimensional student's evaluations of teaching effectiveness. A test of higher order structures'. Journal of Educational Psychology, Vol. 83, pp.285-296.
Marsh, H.W. and Dunkin, M.J., 1992, Students Evaluations of University Teaching: A Multidimensional Perspective, in Higher Education. a Handbook of Theory and Research, Vol. 8, Agathon Press, New York, pp.143- 223.
Newton, J.D., 1998, Using Student Evaluation of Teaching: The Validity Problem, Journal of Accounting Education, vol 6, pp1-14.
Porcano, T., 1984, An Empirical Analysis of Some Factors Affecting Student Performance, Journal of Accounting Education, vol.2, No.2, pp.111-126.
Ryan, J.J., Anderson, J.A. and Birchler, A.B. (1980). 'Student evaluation: The faculty responds'. Research in Higher Education, Vol 12 (4) pp.317-333.
Salthouse, T.A., McKeachie, W.J., and Lin Y.G., 1978, An experimental investigation of factors affecting university promotion decisions, Journal of Higher Education, 49, pp. 177-183.
Tiberius, R.G., Sackin, D.H., Slingerland, J.M., Jubas, K., Bell, M., Matlow, A. ,1989, The Influence of Student Evaluative Feedback on the Improvement of Clinical Testing, Journal of Higher Education, vol 60, No.6, November/December, pp.665-681.