International Journal of Emerging Technology and Advanced Engineering
Website: www.ijetae.com (ISSN 2250-2459, Volume 2, Issue 7, July 2012)200
Friction Welding to Join Dissimilar Metals
Shubhavardhan RN
1, Surendran S
21Department of Ocean Engineering & IIT Madras, Chennai 600036, India 2
Department of Ocean Engineering & IIT Madras, Chennai 600036, India
Abstract -The purpose of this work was to join and assess the development of solid state joints of dissimilar material AA6082 aluminum alloy and AISI 304 stainless steel, via continuous drive friction welding process, which combines the heat generated from friction between two surfaces and plastic deformation. Tests were conducted with different welding process parameters. The results were analyzed by means of tensile test, Vickers micro hardness test, fatigue test, Charpy v-notch impact test, and SEM-EDX (energy dispersive X-ray) analysis in order to determine the phases that occurred during welding. The strength of the joints varied with increasing friction pressure and friction time keeping upset pressure and upset time constant. The joint strength increased, and then decreased after reaching a maximum value, with increasing friction pressure and friction time. The process of friction welding between the aluminum alloy and the stainless steel is proposed to evolve as follows: welding progresses from the outer to the inner region; an unbounded region is retained at the centre of the weld interface with shorter friction time; longer friction time causes the formation of an intermetallic reaction layer at the weld interface and the reaction layer grows as the friction time increases. Some of the welds had poor strength due to the accumulation of alloying elements at the joint interface. When the thickness of the reaction layer increased above a critical value, the joint was brittle and fractured at the weld interface. The joint was sound when there was no unbounded region and a thin reaction layer formed along the entire weld interface.
Keywords -Aluminum, Friction welding, Microstructure, Stainless Steel, and Welding strength.
I. INTRODUCTION
The establishment of energy saving and natural resource saving systems is an important issue, and
relevant research and development should be
accomplished without delay. Making structures lighter is one way to save energy. The study of light metals such as aluminum alloys and magnesium alloys has
received much attention. Aluminum alloys are
especially attractive because of superior
recyclability and workability. However, present structures made of stainless steels cannot be entirely replaced with aluminum alloy structures, taking into account strength, weld ability, and economics, although it is possible to replace part of a structure with aluminum alloy components.
In this case, it is necessary to join stainless steels to aluminum alloys. Few sound joints have been obtained, owing to the formation of a large amount of brittle intermetallic compounds in the weld using fusion
welding. In the recent years welding of dissimilar metals
by conventional welding techniques has become difficult. The flux used for the welding will create lot of heat which declines the strength of the welded joints. In order to overcome this, Friction welding is more effective in joining dissimilar metals when compared with fusion
welding, because it is a solid state process. Heat in friction
welding is generated by conversion of mechanical energy into thermal energy at the interface of work pieces during rotation under pressure. Various ferrous and non-ferrous alloys having circular or non-circular cross sections and that have different thermal and mechanical properties can easily be joined by the friction welding method.
International Journal of Emerging Technology and Advanced Engineering
Website: www.ijetae.com (ISSN 2250-2459, Volume 2, Issue 7, July 2012)201 Friction welding is classified by the American Welding Society (AWS) as a solid state welding process that produces a weld at temperatures lower than the melting point of the base metals under compressive force contact of work pieces rotating or moving relative to one another to produce heat and plastically displays material from the faying surfaces. Various ferrous and non-ferrous alloys having circular or non-circular cross sections and that have different thermal and mechanical properties can easily be joined by the friction welding method. While considered a solid state welding process, under some circumstances a molten film may be produced at the interface. However, even when the final weld should not exhibit evidence of a molten state because of the extensive hot working during the final stage of the process. Filler metal, flux, and shielding gas are not required with this process.
II. RELATED WORK
Vill, Kinley and Fomichev [1, 2and 3] studied the friction welding set-up and the strength of the joints. Murti et al. [4] Directed a study about parameter optimization in friction welding of dissimilar materials. Yılbas et al. [5] investigated the mechanical and metallurgical properties of friction welded steel aluminum and aluminum-copper bars. Yılbas et al. [6] investigated the properties of friction-welded aluminum bars. Rhodes et al. [7] examined microstructure of 7075 aluminum using friction stir welding. Fukumoto et al. [8, 9] investigated amorphization process between aluminum alloy and stainless steel by friction welding. Then, Sahin and Akata [10] studied joining of plastically deformed steel (carburizing steel) with friction welding. Sahin and Akata [11] carried out an experimental study on joining medium-carbon steel and austenitic stainless steel with friction welding. Sahin [12, 13] studied joining austenitic-stainless steel with friction welding. Surface cleanliness in terms of contaminants, especially grease, reduces the quality of joints. Furthermore, the cleanliness of the parts must be considered as important. Therefore, the ends of the parts were cleaned with acetone prior to the welding process to minimize the effect of organic contamination in the welding zone. Friction welding of aluminum and austenitic stainless steel has been studied experimentally ([5, 8, 9]), however, the aim of the present study is to suggest optimum welding parameters to investigate the effect of factors related with joint performance of the friction-welded aluminum and austenitic stainless steel pair.
Friction time, friction pressure, and upset pressure have a direct effect on the tensile strength of joints. Therefore, the optimum parameters were used in order to discover the effect of factors that have a significant role on the experimental results of previous studies [4, 5, 15]. The effect of factors on friction welding method of joints under optimum process parameters were examined both metallurgical and mechanically.
Several studies of the joining of aluminum alloys to steels by friction welding have been reported. Okita et al., [16] who used transmission electron microscopy (TEM) with an energy dispersive spectroscopy (EDS) analysis attachment, investigated the interdiffusion of each element at the weld interface between pure aluminum and steel. Ochi et al.[17] studied the friction welding of carbon steel to an Al-Mg-Si alloy using a filler metal of pure aluminum, and also reported the effect of welding parameters on the mechanical properties of joints comprising an Al-Mg-Si alloy and an Al-Cu alloy with stainless steel and carbon steel, respectively. Yashan et al.[18] suggested that the bond strength of the inner part was different from that of the outer part in a pure aluminum-stainless steel friction weld joint. The inter diffusion behavior of each element at the weld interface and the friction welding process of commercial pure aluminum and 6061 aluminum alloy. to stainless steel joints were investigated using SEM and ultrasound microscopy by the present authors The conclusions of the above studies1 to 18 were that, in the case of aluminum alloy-steel friction welding, the welding mechanism was based on diffusion bonding in the solid state, welding progressed from the outer to the inner part, and the reaction layer was mainly composed of (Fe,Cr,Ni) 2Al5. Moreover, excess formation of intermetallic compounds at the weld interface degraded the joint strength. However, the evolution of the friction welding process and the reaction layer growth behavior, and the relationship between them, were not fully clarified.
International Journal of Emerging Technology and Advanced Engineering
Website: www.ijetae.com (ISSN 2250-2459, Volume 2, Issue 7, July 2012)202 III. THE EX PERIMENTAL PROCEDURE
A.Dissimilar materials used
[image:3.612.55.279.281.574.2]In the experiment, AISI 304 austenitic stainless steel and AA6082 aluminum alloy materials were used. The chemical composition analysis (OES) was carried out for both the metals AISI 304 stainless steel and AA6082 aluminum alloy in MICROLAB metallurgical test house Chennai. Chemical composition obtained by chemical analysis of AISI 304 stainless steel is given in Table1. Chemical composition obtained by chemical analysis of AA 6082 aluminum alloy is given in Table 2.
Table 1
Chemical composition of AISI304 stainless steel
Elements Symbol Unit Obtained
Values
Carbon C % 0.021
Silicon Si % 0.445
Manganese Mn % 1.67
Phosphorous P % 0.35
Sulphur S% % 0.011
Chromium Cr % 18.27
[image:3.612.337.579.385.612.2]Nickel Ni % 8.01
Table 2
Chemical composition of AA6082 aluminum alloy
Elements Symbol Unit Observed
values
Silicon Si % 0.750
Iron Fe % <0.100
Copper Cu % 0.052
Manganese Mn % 0.536
Magnesium Mg % 0.718
Chromium Cr % <0.001
Zinc Zn % 0.080
Aluminum Al % 97.73
B.Geometry of the specimens
Specimens were machined from materials according to the required dimensions. AISI 304Stainless steel (step cut) bars of length 100mm, outer diameter of 18mm and inner extruded part diameter of 14mm, and AA 6082aluminum alloy (step cut) bars of length 100mm, outer diameter of 17mm and inner extruded part diameter of 15mm respectively.
C. Continuous drive friction welding equipment
The setup used for the present work was designed and constructed according to the principals of continuous-drive welding machine. The spindle is driven by an asynchronous servomotor and braked by line-generation.
Axial forces are controlled by a hydraulic servo valve. In this machine up to 20 Ton capacity a load cell is used to measure the axial force and controlled on a closed loop. An industrial PC stores and displays all important parameters – Axial Force, Spindle speed, Displacement and Spindle torque. These data are plotted graphically against Time, for each and every weld and archived.
A drive motor capacity with 6 kW power and to the 1400 rpm speed with adequate torque capacity was used for the friction welding of steel and aluminium bars of different diameters taking into account the friction and the upset pressures. Friction and upset pressures can be seen on number 2 pressure indicator, and the stages of the welding sequences are controlled by the number 3 solenoid valve driven by an external timer. Usually the structure is fairly rigid to provide stability to the equipment working at high speeds and is driven by high pressure forging. Modern equipment is automatic and allows all the parameters be adjusted, controlled and monitored directly on the control panel. Figure 1 shows the continuous drive friction welding setup.
Figure.1 Continuous drive friction welding setup
International Journal of Emerging Technology and Advanced Engineering
Website: www.ijetae.com (ISSN 2250-2459, Volume 2, Issue 7, July 2012) [image:4.612.39.300.139.426.2]203 Table 3
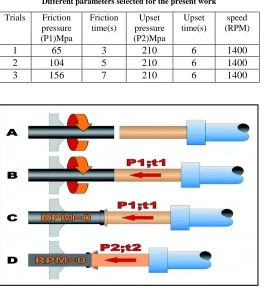
Different parameters selected for the present work
Trials Friction pressure (P1)Mpa Friction time(s) Upset pressure (P2)Mpa Upset time(s) speed (RPM)
1 65 3 210 6 1400
2 104 5 210 6 1400
3 156 7 210 6 1400
Figure.2 Phases of continuous drive friction welding process. (A) Period of approximation; (B) P1, t1 application; (C)end of P1, t1 application, and braking of the machine (RPM = 0); (D) P2, t2 application and finish
welding.
First one work piece is rotated and other is held stationary as shown in the Figure A. When the appropriate rotational speed is reached, the two work pieces are brought together the axial force is applied, as shown in the Figure B. Rubbing at the interface heats the work piece locally and upsetting starts, as shown in the Figure C. Finally, the rotation of one of the work pieces stops and the upsetting is completed, as shown in the Figure D. The weld produced is characterized by the narrow heat affected zone, the presence of plastically deformed material around the weld (flash), and the absence of fusion zone.
IV. RESULTS AND DISCUSSIONS
A. Tensile test
After welding was performed, tensile tests were carried out to evaluate the tensile strength of joints, besides parameter settings, optimization and qualification of welding procedures and processes. The welded specimens were machined according to ASTM E 8M (2004), and subjected to tensile tests on a machine with a load cell capacity of 100 KN at room temperature of 25°C, and a test speed of 1 mm/minute.
The effect of friction time and friction pressure on the strength of joints were examined in welding of equal diameter parts. Upset time was kept constant. The strength of joints was determined by tensile tests, and the results were compared to those of fully machined specimens. Obtained tensile strength for all the three corresponding trials is given in the table 4.Tensile strength of the joints was estimated dividing the ultimate load by area of the specimen. The fracture occurred at the interface of the dissimilar metal weld joint, strength of the weld joint was lesser than tensile strength of AA6082 aluminum alloy 290Mpa, there was an unbounded region around the centre of the fracture surface, although the aluminum alloy was partially bonded to the stainless steel. The unbounded region is defined as the region where the adhesion between the materials and interdiffusion of each element are insufficient, and elements are not metallically bonded to each other. That is, insufficient friction time meant that the faying surfaces had not entirely reached the bonding temperature; therefore, an unbounded region remained at the centre of the weld interface. Only the outer region was bonded because the temperature here was higher than that of the inner region in the friction stage. The obtained results are plotted between tensile strength versus friction pressure friction time and are shown graphically in Figs. and 4. As friction time and friction pressure for the joints are increased, tensile strength of the joints also increases (Figs.3 and 4), but, strength of the joints passes through a maximum, then, when friction time and friction pressure for the joints are further increased, tensile strength of the joints decreases (Figs. 3 and 4). Thus, it is shown that friction time and friction pressure have a direct effect on joint y time and friction pressure affect cue of the metals the weld reduces the joint quality, but it was slightly softened. The fracture mechanism of joints with a shorter time may be different from that of joints with a longer friction time. The initial step was to examine fracture surfaces for any noticeable difference in fracture mechanism between unsound joints with shorter and longer friction times. Obtained tensile strength results were given in Table 4.
Table 4
Obtained tensile strength results
Trials Friction pressure (Mpa) Friction time (s) Upset pressure Mpa Upset time(s) Tensile strength
1 65 3 210 6 136.43
2 104 5 210 6 188.40
International Journal of Emerging Technology and Advanced Engineering
Website: www.ijetae.com (ISSN 2250-2459, Volume 2, Issue 7, July 2012) [image:5.612.332.590.119.238.2] [image:5.612.49.311.121.299.2]204 Figure 3 Relation between tensile strength and friction pressure
Figure 4 Relation between tensile strength and friction time
B .Vickers Micro hardness test
Strength of the joints is related to hardness variation within the HAZ. Hardness variation was obtained under 500 g loads by micro hardness using a digital micro
hardness tester (Wolpert Wilson Instruments) testing, and
measuring locations are shown in Fig. 5. Micro hardness was conducted at the interface of the weld and in the regions near both the AISI 304 stainless steel side and the AA 6082
aluminum alloy side. Hardness variations on horizontal
[image:5.612.50.312.328.504.2]distance from the centre in the welding zone of joints are shown in Figs.6, 7 and figure 8.
Figure.5 Hardness test orientation
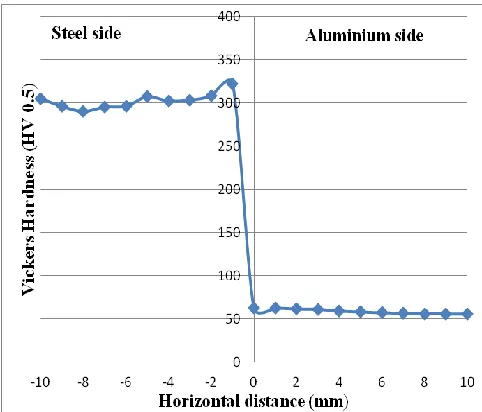
Micro-hardness test results with respect to the horizontal distance from the centre are shown in Fig.6. Increase in hardness corresponds to the steel side. A heat affected zone (HAZ) with a small width was formed that resulted in softening of the aluminum alloy. As the aluminum used in the present study was a cold-drawn bar, it was already work-hardened before the friction welding process. The aluminum recovered and recrystallised as a result of friction heat and deformation, thus was slightly softened. As shown in Fig.7, the hardness on the stainless-steel side of the joints decreases as it is advanced towards the end of the parts. On the other hand, hardness on the aluminum side of the joints did not change significantly (Fig.8).
[image:5.612.324.565.414.620.2]International Journal of Emerging Technology and Advanced Engineering
Website: www.ijetae.com (ISSN 2250-2459, Volume 2, Issue 7, July 2012)205 Figure 7 Hardness distributions on horizontal distance of the weld
[image:6.612.49.289.123.299.2]joints for trial2.
Figure 8 Hardness distributions on horizontal distance of the weld joints for trial3.
C. Fatigue test
Fatigue is the condition whereby a material cracks or fails as a result of repeated (cyclic) stresses applied below the ultimate strength of the material. Basic fatigue testing involves the preparation of carefully polished test specimens (surface flaws are stress concentrators) which are cycled to failure at various values of constant amplitude alternating stress levels.
For the present work the applied stresses was axial (tension-compression) with low cycle completely reversed constant amplitude fluctuating stress-time modes where the alternating stress varies from a maximum tensile stress to a minimum compressive stress of equal magnitude. Three smooth specimens were tested under strain controlled conditions in order to identify the strain-life and cyclic elastoplastic behavior.
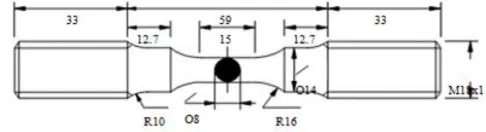
The geometry and dimensions of the specimens are represented in Figure 9 with the recommendations of ASTM E606 (ASTM, 1998). After machining, the specimen surfaces were mechanically polished. The experiments were carried out in a close-loop servo hydraulic test machine, with 100 kN load capacity. A sinusoidal waveform was used as command signal. The fatigue tests were conducted with constant strain amplitudes, at room temperature, in air. The specimens were cyclic loaded under strain control with symmetrical
push-pull loading, with a nominal strain ratio, Rε= 0.1,
Maximum load of 8KN, Minimum load of -2KN and frequency 10Hz were applied. Obtained results are given in the table5.
[image:6.612.336.579.300.366.2] [image:6.612.48.290.335.518.2]Figure9. Geometry and dimensions of the specimens used in the strain-controlled fatigue tests (dimensions in mm)
Table 5
Number of cycles taken for complete fracture/failure of the weld joint.
Trials Friction pressure (Mpa)
Friction time (s)
Upset pressure
Mpa
Upset time(s)
No.of cycles for fracture
1 65 3 210 6 1900
2 104 5 210 6 3077
3 156 7 210 6 2888
The weld joint specimen of trial2 failed for 3077 number of cycles, when compared with the other two specimens, trial2 specimen life is more. Trial1 specimen resisted cyclic load for 1900 number of cycles and finally, trial3 specimen fractured completely for 2888 number of cycles respectively. Observing the fatigue test results obtained from the present work, simply it was revealed that the dissimilar metal weld joints are susceptible for cyclic loading conditions. Dissimilar metal weld joints life was found to be less for repeated/cyclic loads.
D. Impact test
International Journal of Emerging Technology and Advanced Engineering
Website: www.ijetae.com (ISSN 2250-2459, Volume 2, Issue 7, July 2012) [image:7.612.51.296.214.337.2]206 A major disadvantage is that all results are only comparative.The standard test piece for the present work were prepared according to the ASTM E23 shall be 55 mm long and of square section with 10 mm sides. In the centre of the length, there shall be a notch. V notch of 45°, 2 mm deep with a 0.25 mm radius of curve at the base of notch. Figure10 below shows the charpy V-notch dimensions.
Figure 10 Charpy V-notch dimensions.
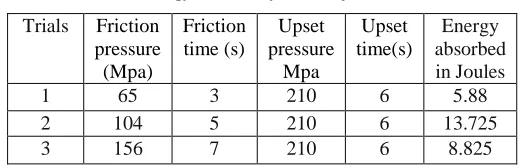
[image:7.612.37.299.513.597.2]The results found for three different welding parameters were given in the table 6, which gives us the clear view that the specimen weld joint of trial2 had absorbed more energy (13.725 joules) representing that it bears more toughness, since the resistance to applied load at the weld joint interface of trial specimen is more because the quality of bonding between the two dissimilar metals was sound. As compared with the other two specimen weld joint parameters, that is trial1 specimen absorbed 5.88 joules of energy, and finally, the trial3 specimen weld joint absorbed 8.825 joules of energy.
Table 6
Energy absorbed by the weld joints.
Trials Friction pressure (Mpa)
Friction time (s)
Upset pressure
Mpa
Upset time(s)
Energy absorbed in Joules
1 65 3 210 6 5.88
2 104 5 210 6 13.725
3 156 7 210 6 8.825
The results of these three specimen weld joints concludes that low friction pressure and friction time does not provide the sufficient frictional heat and time required to form a sound bonding between the two dissimilar metal joints. The metal bonding becomes brittle or simply the quality of the joint decreases gradually as the friction pressure and friction time provided reaches the excess limit than that of the required value to reach maximum limit hence, the sound bonding at the interface of the two dissimilar metals.
It is noticed that optimum parameters with sufficient friction pressure and friction time results in a strong bonding at the interface of the dissimilar metal joints which provides greater weld strength.
E. Macrostructure
In macrostructure level, it was observed the formation of flashes with circular symmetry, different formats, and also significant reductions in length of the cylindrical pin AA6082 aluminum alloy in accordance with the used/adapted parameters. The AISI 304 stainless steel side was not deformed because this material has higher strength than the aluminum alloy, and it thus provide more resistance to deformation. Hence, the formation of flashes was restricted to AA 6082 aluminum alloy only. Figures.11A, 11B and 11C given below show the appearance of the weld joints for different trials.
Figure11A. Appearance of the weld joints for trial 1
International Journal of Emerging Technology and Advanced Engineering
Website: www.ijetae.com (ISSN 2250-2459, Volume 2, Issue 7, July 2012) [image:8.612.315.588.120.357.2]207 Figure 11C Appearance of weld joint for trial 3.
F. Microstructure
The microstructure-photos in the parent metals and interface region of the joints are shown in Figs.12, 13, and 14. .The microstructure of the base metal consists of austenitic grain structure. Micro photographs (Figs. 12, 13,
and 14) shows that aluminum was greatly deformed with
[image:8.612.48.326.125.412.2]grains elongated and refined near the weld interface. Stainless steel was slightly deformed and partly transformed at the faying surface from austenite to marten site owing to hard friction. Constituent elements of both materials had interdiffused through the weld interface, and intermetallic compounds such as Fe-Al and Fe3Al, were formed at the weld interface.
Figure.12 Micro-photo of AISI 304 stainless steel (100x1)
[image:8.612.325.588.376.614.2]International Journal of Emerging Technology and Advanced Engineering
Website: www.ijetae.com (ISSN 2250-2459, Volume 2, Issue 7, July 2012) [image:9.612.306.584.125.345.2]208 Figure.14 Micro-photo at the interface region of the dissimilar metals
welds joint (100x1).
G. EDX analysis
Scanning electron microscopy (SEM) and energy dispersive X-ray (EDX) analysis were performed in order to investigate the phases that occur during welding at the welding interface. Observations were realized with a 200-kV field- effect scanning electron microscope
(SEM-Quanta 200F@MSRC) associated to an EDS (energy
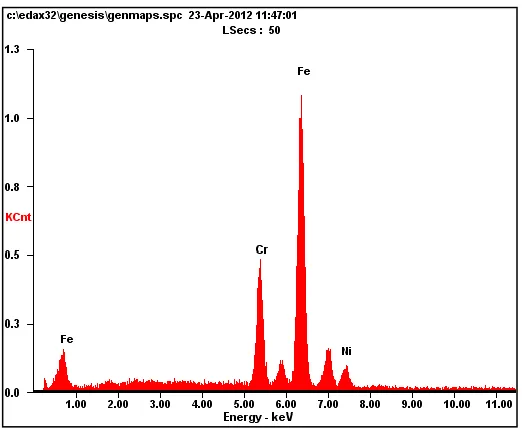
dispersive X-ray spectroscopy) analysis. EDS point analysis was used in the examinations. The software allowed piloting of the beam, scanning along a surface or a line to obtain X-ray cartography or concentration profiles by elements, respectively. SEM microstructure of interface region in the friction-welded steel-aluminum joint and EDX analysis results are given in Fig. 15, while distribution of elements within the determined location are observed. EDS analysis was carried out for various points of the SEM image. Figure 15A shows EDX analysis points defined on the SEM microstructure in interface region of the friction welded St-Al joints. Figure 15B, C, D and E illustrate the EDX analysis results taken from the points 1, 2, 3, and 4 represented to Steel-Al joint, respectively. Then, the EDS point analysis results represented to SEM. The EDS results confirm that St-Al joints contain some intermetallic compounds. Therefore, formation of brittle intermetallic compounds degrades the strength of the joints.
Figure 15a: SEM microstructure of the interface region of friction welded steel-aluminum joint.
[image:9.612.319.580.373.613.2]International Journal of Emerging Technology and Advanced Engineering
Website: www.ijetae.com (ISSN 2250-2459, Volume 2, Issue 7, July 2012) [image:10.612.36.294.141.364.2]209
Figure 15c: EDX analysis result taken from point 2represented to SEM image.
[image:10.612.311.579.143.364.2]
Figure 15d: EDX analysis result taken from point3 represented to SEM image.
Figure 15e: EDX analysis result taken from point 4 represented to SEM image.
V. CONCLUSIONS
In the present study, austenitic stainless steel (AISI 304) and aluminum materials were welded successfully. The welding process was investigated by tensile testing, impact testing, Vickers micro hardness testing, fatigue testing, micro structural observation, and EDS measurements with the following results:
1.Optimum welding parameters should be properly selected in the friction welding of parts. 2.Tensile strengths for austenitic stainless steel and
[image:10.612.37.298.404.619.2]International Journal of Emerging Technology and Advanced Engineering
Website: www.ijetae.com (ISSN 2250-2459, Volume 2, Issue 7, July 2012)210
3.It is showed by the results of tension mechanical
tests that presented mechanical properties which are not possible to achieve by means of fusion welding processes.
4.The presence of contaminants at the interface of the metals reduces the joint quality. No significant effect was observed on welding properties with respect to the surface finish operations.
5.In the micro-photos, the broken up aluminum oxide film resulted in increased deformation at the interface. Formation of an oxide in the joints causes a barrier that prevents diffusion.
6.The difference in weight of alloying elements can be clearly seen by analyzing spectrum of elements. EDX measurements clearly show that Steel-Al joints consist of some intermetallic compounds.
7.Hardness of both materials in the vicinity of the weld interface was higher than that of the base metals. 8.The weld joint with optimum friction pressure and friction time absorbed valuable amount of energy representing the complete bonding and good weld strength at the interface, compared with the other two, lesser friction pressure and friction time, and higher friction pressure and friction time weld joint specimens.
9.Fatigue test results concluded that dissimilar metal joints are susceptible for repeated/cyclic loading. Dissimilar metal weld joints life was found to be less for repeated/cyclic loads.
10. The results of this study have fundamental
importance for the understanding and
comprehension of the main characteristics of friction welding process, the bonding mechanisms between dissimilar materials, and the feasibility of applying this process in the production of structural joints that will be used in ship building, light and heavy automotive, electrical, chemical and civil, space and nuclear engineering. these components include concerned the manufacture of hollow aluminum extrusions for deep freezing of fish on fishing boats, explosive cladding of heat exchanger tubes, air bag canisters, axle cases and tubes, drive shafts, drill pipes, tunneling rods, electrical connectors, hydraulic piston rods and cylinders, LNG reactor cooling tanks pump shafts, swivel pins, track rollers, turbo chargers and various agriculture equipments.
REFERENCES
[1 ] Vill VI (1962) friction welding of metals.AWS New York. [2 ] Kinley. W. (1979) Inertia welding simple in principle and
application, weld metals.
[3 ] Fukumoto S, Tsubakino H, Okita K, Aritoshi M, Tomita T (1999) Friction welding process of 5052 aluminum alloy to 304 stainless steel. Mater Sci Techno 15:1080-1086
[4 ] Murti KGK, Sundaresan S (1983) parameter optimization in friction welding dissimilar materials. Metal construct June, pp331-335 [5 ] Ylbas, B.S. et al., 1995, “Friction welding of St-Al and Al-Cu
materials”, Journal of Materials Processing Technology, Vol. 49, Nº. 3-4, pp. 431-443. Doi: 10.1016/0924-0136(94)01349-6 [6 ] Yılbaş BS, Şahin AZ, Çoban A, Abdul Aleem BJ (1995)
Investigation into the properties of friction: welded aluminum bars. J Mater Process Technol 54:76-81
[7 ] Rhodes CG, Mahoney MW, Bingel WH, Spurling RA, Bampton CC (1997) Effects of friction stir welding on microstructure of 7075 aluminum. Scripta Materialia 36(1):69-75
[8 ] Fukumoto S, Tsubakino H, Okita K, Aritoshi M, Tomita T (2000) Amorphization by friction welding between 5052 aluminum alloy and 304 stainless steel. Scripta Materialia 42:807-812.
[9 ] Fukumoto S, Tsubakino H, Okita K, Aritoshi M, Tomita T (1999) Friction welding process of 5052 aluminum alloy to 304 stainless steel. Mater Sci Technol 15:1080-1086
[10 ] Sahin M, Akata HE (2003) Joining with friction welding of plastically deformed steel. J Mater Process Technol 142(1):239-246 [11 ] Sahin M, Akata HE (2004) An experimental study on friction
welding of medium carbon and austenitic stainless-steel components. Indust Lubricat Tribol 56(2):122-129.
[12 ] Sahin M (2005) An investigation into joining of austenitic stainless steels (aisi 304) with friction welding. Assemb Automat 25(2):140-145
[13 ] Sahin M (2006) Evaluation of the joint-interface properties of austenitic-stainless steels (aisi 304) joined by friction welding. Mater Des 28(7):2244 2250
[14 ] Stahlschlüssel, Verlag Stahlschlüssel Wegst Gmbh (1995)
[15 ] Draper NR, Smith H (1981) Applied regression analysis, 2nd edn. Wiley, New York
[16 ] Okita who used transmission electron microscopy (TEM) with an energy dispersive spectroscopy (EDS) analysis attachment investigated the interdiffusion of each element at the weld interface between pure aluminum and steel. J. Jpn Friction Weld. Assoc. 1995,
[17 ] Ochi et al. friction welding of carbon steel to an Al-Mg-Si alloy using a filler metal of pure aluminium,J. Jpn Inst. L ight Met., 1994, 44, 320-324.1, 123-127.