International Journal of Emerging Technology and Advanced Engineering
Website: www.ijetae.com (
ISSN 2250-2459,
ISO 9001:2008 Certified Journal,
Volume 3, Issue 3, March 2013)
505
Load Flow Analysis of Mini-Grid Connected Load and its
Compensation
Rohit kumar verma
1, S. N. singh
21M.Tech student, 2 senior scientific officer, Alternate hydro energy centre, Indian Institute of Technology Roorkee
Uttarakhand-247667
Abstract—This paper presents a load flow analysis of Mini-grid connected load by using MatLab programming of 13 and 33 load connected bus. Reactive power compensation is done by using switch shunt capacitor. This method gives the optimal placement of capacitor to inject reactive power in Mini-grid connected. The used program provides information of voltage at each load connected bus. This method helps in providing injection of reactive power at exact location of load bus. The MatLab program is very user friendly. This method of compensation is seen to be very effective for radial distribution system to make voltage profile flat.
Keywords—Mini-grid, voltage profile improvement, reactive power compensation, MatLab, switch shunt capacitor.
I. INTRODUCTION
India is the big country with 29 states and 6 union territories. The numbers of village in India is 593732, out of these village India has 34491 unelectrified village (5.809 %) [1]
The challenges for the electrification in the India are the rural areas or location , they are away from the load centre, the private parties are also not interested in electrifying these areas because of uncertainty in the revenue. [2]
There are two methods of supplying electricity to these rural areas:
1) With the help of existing grid, near to that area. 2) With the help of decentralized generator.[3] The transportation of fuel like coal, oil is ether not possible or not economical because these village may locate in the rural area like forest, desert, hills. Therefore with the help of renewable energy available in that area.
The extension of grid is not possible in all these unelectrified village because with the increase in distance of grid, the cost of electricity is increases very much as shown in figure1. So it is not feasible. [4]
Fig.1.varying cost of electricity with distance from grid[4]
We can generate the electricity in rural unelectrified village and distributes it locally. The commonly used renewable energy(ies) are solar energy, wind energy, hydro energy, geothermal energy and biomass. With the use/integration of these renewable energies, or singly we can satisfy the energy demand in that rural areas.
International Journal of Emerging Technology and Advanced Engineering
Website: www.ijetae.com (
ISSN 2250-2459,
ISO 9001:2008 Certified Journal,
Volume 3, Issue 3, March 2013)
506
Cost comparison of energy generated by conventional i.e., coal, natural gas, petrol etc renewable energy resources like small hydro power plant, solar photovoltiac, biofuel, biomass etc. is shown in figure 2. it is clear from the Fig 2, the cost of conventional source of energy is more
than the cost of renewable source of energy [2]
Under the guidelines Rajiv Gandhi Grameen Vidyutikaran Yojana in the XI Plan – Scheme of Rural Electricity Infrastructure and Household Electrification the choice of technology is defined by the flow chart in which opting of technology become easy shown in figure 3.[5]
Fig.3. preference for opting the renewable energy.[5]
The many developing countries have renewable energy and hybrid energy based mini grids like srilanka, china, Nepal and many others.
Mini-grid is the new technology (which is under development ) which integrates the renewable energies or sometimes hybrid energy. Mini-grid fulfills the demand of electricity in the particular area. The Mini-grid may be connected with the main existing grid or serve the area in isolated mode (Islanded Mini-grid). The Mini-grid serves the consumers which are far away from the utility grid. [6] The grid comes under the range of mini grid having the power range from few Watt to 1MW and voltage level is 230V-11kV.[7].
The transmission voltage have the empirical formula considering the cost for V in kV, L in kilometer and KVA is power to be transmitting.
V=5.5√L/1.6 +KVA/150 [8]
The voltage drop in mini-grids during the peaks loads is very high in some cases is the voltage drop at tail end is around 36%[9]
The effect of change in voltage to the different device are given in the Table I:
TABLEI
The effect of change in voltage to the different device[10]
ELECTRICAL LOADS
DECREASING VOLTAGE INCREASING VOLTAGE
HEATING LOADS
(without ventilators)
- generated heat/power varies with the square of the voltage variations; requires more time to do the same work (cooking
etc .)
- heating element may burn due to excess heat generated
LIGHTING LOADS - decreases light output but improves service life.
- decreases service life considerably even at small
increase of voltage.
- incandescent bulbs - lamp may not start or may flicker during operation.
- fluorescent bulbs
TRANSFORMERS - not affected (power decreases)
- transformer heats up because of a higher magnetizing current (it operates at a higher saturation
level).
MOTOR LOADS - torque of induction motors varies with the square of the voltage ; motor may not be able to start the driven equipment with the reduced
- as transformers
REFRIGERATORS
- absorber type - as heating loads - as heating loads
- compressor type - as motors - as motors
ELECTRONIC DEVICES (ratio, TV, tape, computer)
- accept fairly high voltage variations without damage
From the table I it is found that voltage drop cause many terminal equipment-either working under performance or not working at all. In some cases instrument burns like induction machine. So it becomes necessary to compensate the grid so that voltage come under specified limit i.e., ±5%. So it is ne
Methods of improving the voltage drop in the mini-grid: 1) Increase the voltage of transmission to reduce the
I2R losses. However it is not feasible in all the cases. [11]
2) Redistribute load and straighten feeders. 3) Increase the size of conductor.
International Journal of Emerging Technology and Advanced Engineering
Website: www.ijetae.com (
ISSN 2250-2459,
ISO 9001:2008 Certified Journal,
Volume 3, Issue 3, March 2013)
507
5) Install new feeders.
6) Use switched shunt capacitor. 7) Install a new substation.
However the installing of new substation is the last choice and shunt capacitor is found to be very effective in low voltage network.[9]
If the capacitor is used is a compensating device at the load terminal, the reactive power injected decreases directly proportional to the square of the voltage. So, when we need reactive power at the time of drop in voltage it is not supplying required Reactive power Q. so it is not a reliable friend. That's why in this paper switched shunt capacitor have been used to make voltage profile constant( approx to 1 p.u). This paper is divided into VIII subsections.
II. LOAD BUS SYSTEM:
[image:3.612.339.537.206.485.2]IEEE 13 and 33 bus radial distribution test system is used n in figure 4, figure 5 respectively. These load bus systems are taken from IEEE standards. Mini-grid supplies the required power to the load.
Fig.4. 13 bus load system.
Fig.5. 33 bus load system.
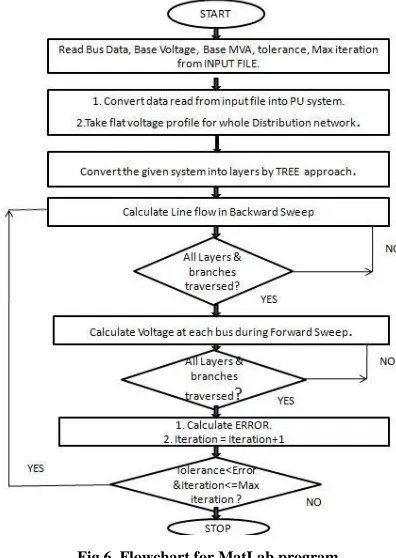
III. FLOW CHART AND PROGRAM
The flow chart of load flow analysis using the forward and backward sweep method to run the program in MatLab environment is shown in figure 6. The MatLab program has calculated the voltage at each load bus.
Fig.6. Flowchart for MatLab program.
[image:3.612.59.292.397.667.2]IV. LOAD BUS VOLTAGE FOR 13BUS SYSTEM The output of program which is showing load bus voltage for 13 bus system is shown in table II. It is found that bus voltage is within the specified range. So there is no need of compensation for the given 13 bus system. The voltage of each bus is also shown in figure 7.
TABLE II Voltage at 13 load bus
NODE NO.
MAGNITUDE ( P.U)
ANGLE (degree)
NODE NO.
MAGNITUDE ( P.U)
ANGLE (degree)
1 1 0
2 0.994614 -0.301118 0.988024 -0.740619
3 0.993069 -0.4156959 0.991488 -0.532652
4 0.992149 -0.48363110 0.99135 -0.543131
5 0.989247 -0.64849411 0.991329 -0.544793
6 0.988846 -0.67886312 0.988693 -0.690465
[image:3.612.323.566.599.707.2]International Journal of Emerging Technology and Advanced Engineering
Website: www.ijetae.com (
ISSN 2250-2459,
ISO 9001:2008 Certified Journal,
Volume 3, Issue 3, March 2013)
[image:4.612.54.269.138.304.2]508
Fig.7. bus voltage for 13 bus system.
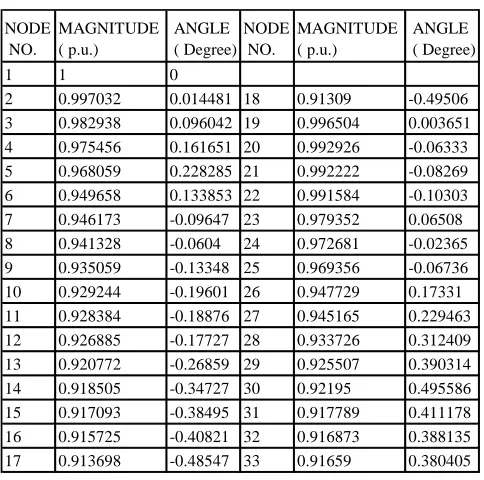
[image:4.612.320.565.155.369.2]V. LOAD BUS VOLTAGE FOR 33BUS SYSTEM The output of program which is showing load bus voltage for 33 bus system is shown in table III. It is found that bus voltage is not within the specified range(± 5%). So it becomes necessary to provide compensation for the given 33 bus system. So that the voltage profile fall within limit of ±5%. The voltage of each bus is also shown in figure 8.
Fig.8. The voltage for 33 bus system.
TABLE III Voltage at 33 load bus
NODE NO.
MAGNITUDE ( P.U)
ANGLE (degree)
NODE NO.
MAGNITUDE ( P.U)
ANGLE (degree)
1 1 0
2 0.997032 0.014481 18 0.91309 -0.49506
3 0.982938 0.096042 19 0.996504 0.003651
4 0.975456 0.161651 20 0.992926 -0.06333
5 0.968059 0.228285 21 0.992222 -0.08269
6 0.949658 0.133853 22 0.991584 -0.10303
7 0.946173 -0.09647 23 0.979352 0.06508
8 0.941328 -0.0604 24 0.972681 -0.02365
9 0.935059 -0.13348 25 0.969356 -0.06736
10 0.929244 -0.19601 26 0.947729 0.17331
11 0.928384 -0.18876 27 0.945165 0.229463
12 0.926885 -0.17727 28 0.933726 0.312409
13 0.920772 -0.26859 29 0.925507 0.390314
14 0.918505 -0.34727 30 0.92195 0.495586
15 0.917093 -0.38495 31 0.917789 0.411178
16 0.915725 -0.40821 32 0.916873 0.388135
17 0.913698 -0.48547 33 0.91659 0.380405
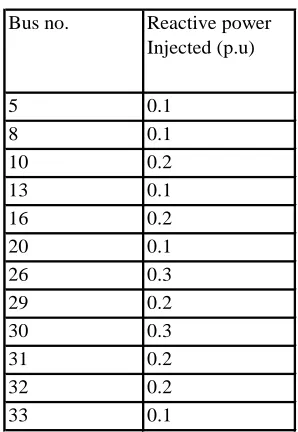
VI. LOAD BUS VOLTAGE WITH COMPENSATION To make the voltage profile flat close to 1 p.u. We have
used switch shunt capacitor at (5,
[image:4.612.57.272.420.557.2]8,10,13,16,20,26,29,30,31,32,33) buses and the amount of reactive power needed to inject into the system to make voltage profile flat is shown in Table IV. now program output after compensation is shown in Table V, it is found that the voltage of each load bus has come under the limit.
TABLE IV
Reactive power injected at every bus.
Bus no. Reactive power
Injected (p.u)
5 0.1
8 0.1
10 0.2
13 0.1
16 0.2
20 0.1
26 0.3
29 0.2
30 0.3
31 0.2
32 0.2
[image:4.612.369.518.502.718.2]International Journal of Emerging Technology and Advanced Engineering
Website: www.ijetae.com (
ISSN 2250-2459,
ISO 9001:2008 Certified Journal,
Volume 3, Issue 3, March 2013)
[image:5.612.48.290.156.396.2]509
TABLE V
Voltage profile after capacitor placement
NODE NO.
MAGNITUDE ( p.u.)
ANGLE ( Degree)
NODE NO.
MAGNITUDE ( p.u.)
ANGLE ( Degree)
1 1 0
2 0.997032 0.014481 18 0.91309 -0.49506 3 0.982938 0.096042 19 0.996504 0.003651 4 0.975456 0.161651 20 0.992926 -0.06333 5 0.968059 0.228285 21 0.992222 -0.08269 6 0.949658 0.133853 22 0.991584 -0.10303 7 0.946173 -0.09647 23 0.979352 0.06508 8 0.941328 -0.0604 24 0.972681 -0.02365 9 0.935059 -0.13348 25 0.969356 -0.06736 10 0.929244 -0.19601 26 0.947729 0.17331 11 0.928384 -0.18876 27 0.945165 0.229463 12 0.926885 -0.17727 28 0.933726 0.312409 13 0.920772 -0.26859 29 0.925507 0.390314 14 0.918505 -0.34727 30 0.92195 0.495586 15 0.917093 -0.38495 31 0.917789 0.411178 16 0.915725 -0.40821 32 0.916873 0.388135 17 0.913698 -0.48547 33 0.91659 0.380405
VII. COMPARISON OF LOAD BUS VOLTAGE
The voltage profile with and without Reactive power compensation is shown in figure 9.
Fig.9. The voltage profile with and without compensation.
VIII. CONCLUSION
It is clear from the output obtained of load flow analysis that there is no need of compensation(injection of reactive power) in 13 load bus system. The output voltage at the load bus of 33 load bus system is not flat(1 p.u. ). So it becomes necessary to provide compensation. Switch shunt capacitor is used for compensation of 33 load bus system. This method of compensation is seen to be very effective for radial distribution system to make voltage profile flat. The amount of reactive power needed to be injected is given in table IV.
REFERENCES
[1] Central Electricity Authority,Progress report of village electrification as on 31-01- 2013.
[2] V. S. K. Murthy Balijepalli, Smart and Sustainable Energy Systems for Developing Countries: An Indian Perspective Student Member, IEEE, and S. A. Khaparde, Senior Member, 2011 IEEE.
[3] Mohan munasinghe rural electrification in the third word,july1990, power engineering jounral, pp-189-202.
[4] Kamalapur G D , Uday kumar R Y, "Electrification in rural areas of India and consideration of SHS "2010 5th International Conference on Industrial and Information Systems, ICIIS 2010, Jul 29 - Aug 01, 2010, India,pp-596-601.
[5] Guidelines for Village Electrification through Decentralized Distributed Generation (DDG) under Rajiv Gandhi Gramen Vidyutikaran Yojana in the XI Plan –Scheme of Rural Electricity Infrastructure and Household Electrification, Government of India Ministry of Power ,12th January, 2009.
[6] Glenn platt, cornforth, tim moore berry, "The practical challenges of minigrids" CSIRO energy Technology news castle, Australia, pp-950-954.
[7] Tawatchai suwannakum, "Mini grid system for rural electrification in the great Mekong sub regional countries", Kassel university press gmbh, 2008.
[8] Guide lines for power evacuation and interconnection with grid- ahec/ mnre/ shp standard/ E&M works page- 3, Sep 19, 2008. [9] D .p. Sen gupta, "Rural electrification in india: the achievements
and the shortcomings", IEEE 1989, pp752-755.
[10] V. K. Mehta, Rohit Mehta, "principles of power system"S. Chand & Co., 2008
[11] Anshu bhardwaj and Rahul tongia, member, "Distributed power Generation : rural india – A case study" IEEE.
[12] M.H.Haque, " Efficient load flow method for distribution systems with radial or mesh configuration" IEE Proc-Germ Transm. Distrib. Vol. 143, No. 1, January 1996 pp-33-38.
[image:5.612.52.296.453.632.2]