Journal of Chemical and Pharmaceutical Research, 2014, 6(6):2610-2623
Research Article
CODEN(USA) : JCPRC5
ISSN : 0975-7384
Monitoring and performance control of RP–HPLC method for simultaneous
quantification of water-soluble vitamins during its life cycle
H. Bouchafra
1,2, M. Elkarbane
2,3, B. Ihssane
1, M. Azougagh
2, F. Jhilal
5, S. A. Sosse
1, EL.
Elhadrami
1and T. Saffaj
1,41Application Organic Chemistry Laboratory, Sciences and Techniques Faculty,Sidi Mohamed Ben Abedallah
University, BP 2202 route d’immouzer, Fès, Morocco
2Physicochemical Service, Drugs Quality Control Laboratory, Direction of Drugs and Pharmacy, Ministry of
Health, Rabat, Morocco
3Laboratory of Pharmacology and Toxicology, Faculty of Medicine and Pharmacy, Mohammed V University,
Soussi, Rabat, Morocco
4Regional University Center of Interface, University Sidi Mohamed Ben Abedallah, BP 2626 route d’immouzer, Fès,
Morocco
5Laboratory of Engineering Materials, Modeling and Environment, Faculty of Sciences Dhar El Mahraz, University
sidi Mohammed Ben Abdallah, BP 1796 Atlas, Fès, Morocco
_____________________________________________________________________________________________
ABSTRACT
This research aims to propose a new vision to examine an analytical method during its life cycle, in order to show its performance and capability to guarantee good results for future analysis at a confidence level accepted. In this context, A method was proposed for separate and quantify simultaneously of five vitamins, that is ascorbic acid (vitamin C: VC), Thiamine hydrochloride (vitamin B1: VB1), Riboflavin (vitamin B2: VB2), Nicotinamide (vitamin B3: VB3) and Pyridoxine hydrochloride (vitamin B6: VB6) in tablet multivitamin. Chemometric tools, namely screening design factors (Plackett-Burman) and response surface methodology (Box-Behnken) were used to optimize the operating conditions of the liquid chromatography method chosen at the selection stage. The performances of the developed method were highlighted by applying of the approach based on the concept of the total error and accuracy profile. Results of accuracy profile showed that the 95%-expectation tolerance limits for all vitamins fell well within the acceptance limits at±10%. Therefore, chromatography method was capable of providing accurate results in the concentrations range studied of each vitamin. On the other hand, measurement uncertainty was calculated at each concentration level for each vitamin from validation data which these relative values did not exceed 5%. Finally, according to its life cycle, we can say that our method is apparent suitable for quality control the finished products contain water-soluble vitamins.
Keywords: Vitamins, Accuracy profile, Measurement uncertainty, Life cycle, Control performance.
_____________________________________________________________________________________________
INTRODUCTION
Vitamins could be important in human endogenous metabolism, they are essential for our health and they are found in small quantities in natural food. Currently many vitamin supplements such as multivitamins tablets are regularly used in the therapeutic management [1-3]. In fact of the large consumption of these products necessitates control methods to assure their quality.
different analytical methods for vitamins analysis. HPLC is the technique which mostly used, like HPLC with electrochemical detection [4], HPLC reversed-phase with gradient elution with photodiode array detector [5,8, 15,
17, 21, 22, 23, 26], HPLC method with UV-Vis detector [9, 11, 16, 25, 27, 28], HPLC/electrospray ionization-mass [19], chromatography multiple detection with confirmation by electrospray ionization mass spectrometry [20],
HPLC with Fluorescence Detector and Mass Spectrometry [24], a bench-top robotic system coupled to reversed phase (RP-18) HPLC with UV detection [13], HPLC and polarographic analyzer [18]. In addition, the capillary electrophoresis method [6, 12], Fourier Transform Infrared Spectroscopy (ATR-FTIR) method [7] and fluorescence spectrometry method [10, 14] were used for determining vitamins. On the other hand, a few studies employing chemometrics tools in vitamins determination, like experimental design [5], and multivariate data analysis (PLS) in
[18]. That’s why, in this work we try to investigate combination of an optimized ion pair reversed phase
chromatography that provides complete separation of the water soluble vitamins in a reasonable analysis time and acceptable resolution by the systematic study of the factors influencing the chromatographic behavior on the separation of vitamins. We performed by a multivariate approach using experimental design methodology which allowed modeling and optimization of the chromatographic separation of water soluble vitamins.
In addition, certainly there are many LC methods have been reported for simultaneous analysis of water soluble vitamins. All of these methods are validated with the classical approach of validation. None had dealt the validation strategy based on total error and accuracy profile described in harmonization guidelines of the “French Society of Pharmaceutical Sciences and Technology” (SFSTP). This new strategy allows us to assess the accuracy (precision + trueness) as well as to estimate the uncertainty at each level of concentration. Each drug should be controlled by an analytical method that is well chosen and clearly defined. However, it turns out that in some cases, the routine application of analytical methods do not necessarily lead to a satisfactory result or pose some problems. So, it is important to provide a good result and be able to show and give the guarantee that it is correct [29]. If the measurement result cannot generate an acceptable level of confidence, then it will present little interest. The customer still expects a result with some confidence on which he take important and crucial decisions. Thus, the performance of the analytical method must be checked and the uncertainty of the result to a given confidence level, be estimated [30, 31]. In this context, and in order to guarantee the quality of drug, we tried during the life cycle of our proposed method to determine its performance and demonstrate its ability to accurately quantify the five vitamins.
Recently, H. Jin et al and P. Soni [26, 27] were interested in their work by development and validation of HPLC method for simultaneous determination of water soluble vitamins, but their studies were limited with classical tools, most of the experimentation in vitamins separation development is still performed by changing the levels of each variable separately at a time, in an unsystematic way, keeping all other variables constant in order to study the effects of the specific variable on the selected response or to find the optimal conditions of a complete system, this methodology is based on large number of experiments and often relies simply on the experience of the analyst, that why in this work the experimental design methodology has been generally adopted for optimization of various parameters influencing the separation of vitamins. Furthermore, an optimization of the vitamins separation method was performed using polynomial mathematical equations and response surface plots.
In all the analytical methods of chemistry, method validation is a very fruitful topic, as indicated in the literature, nevertheless, they has still been some ambiguity concerning the conclusions of the realized tests, without answering the question whether the method is fit its purpose, in order to avoid this problem, an original statistical approach based on the concept of accuracy profile (total error), by means of tolerance intervals in validating this LC analytical method has been applied. In addition to that the uncertainty was estimated in each level of concentration, for the reason that every scientist knows that an analytical result must be necessarily accompanied by a measurement uncertainty. Indeed, the expression of the uncertainty associated with measurement results becomes an important parameter of performance of an analytical method.
In this paper, we propose a simple and fast chromatographic method for the determination of five vitamins in drug formulations. Thus, we recommend a strategy of monitoring and control along its life cycle that begins with the selection step, the development, validation and ends with its application in routine phase in the quality control laboratory.
used to identify the most influential factors on the selected responses. While, Box–Behnken design is used to observe the interaction effect of the independent variables on the response and determine the optimal setting of experimental factors at different levels [32, 33].
The second objective of this paper is to validate the optimized method using the approach based on total error and accuracy profile described in harmonization guidelines of the “French Society of Pharmaceutical Science and Technology” (SFSTP) in order to show the performance and capability of our procedure. Accuracy profile is a decision-making graphical tool aiming to help the analyst in deciding whether an analytical procedure is valid. Good analytical procedure cannot be sure that the probability of the difference between each measured value (x) of a sample and its true value (µ), which must be within the limits of acceptance that the analyst had predefined, and can result in the following relation with β is the proportion of measures inside the acceptance limits, and being the acceptance limits fixed a priori by the analyst according to the objectives of the method. One way to build the accuracy profile is to compute the β-expectation tolerance interval introduced by Mee [34], and to compare it to acceptance limits. A method is claimed to be valid when tolerance intervals are fully included within the acceptability limits. A validity domain is, then, defined between the limit of quantification and the upper tested concentration.
Finally, the third objective is to estimate the measurement uncertainty from validation data for the determination of five water soluble vitamins in each level of concentration. For this purpose, the approach described in [35-38] is applied.
EXPERIMENTAL SECTION
Apparatus
The chromatographic system consisted of Waters 2695 pump, auto sampler and Waters 2996 photodiode-array detector (PDA). Data acquisition was performed by the Empower Software data registration, pH meter of Schott (Germany).
Chromatographic conditions
The HPLC analyses were carried out in isocratic mode with LiChrospher RP-selected B C18-5µm 125 × 4 mm column; thermostatised at 30°C. The mobile phase is consisted of a mixture of buffer (0.015M hexane sulfonic acid sodium salt) and acetonitrile (90:10 v/v). The flow rate was 1.2 mL/min, the injection volume was 50 µ L and the wavelength of the detector was set at 270 nm.
Preparation of standard
Accurately weighed amount, 400.0 mg of Ascorbic Acid (VC), 100.0 mg of Nicotinamid (VB3), 20.0 mg of
Pyridoxine hydrochloride (VB6), 30.0 mg of Thiamine hydrochloride (VB1), and 10.0 mg of Riboflavin (VB2) were
taken into 200 mL volumetric flasks, completed to the mark with mobile phase and sonicated 15 min. Then 2.0 ml of stock solutions of vitamins were transferred to 20 ml volumetric flask and the volume was made up with mobile phase and missed well, the solution was filtered through a 0.45µm Millipore filter. The final solution contain as a concentration: respectively 0.2, 0.05, 0.01, 0.005 and 0.015 mg/mLof vitamins VC, VB3, VB6, VB2 and VB1.
Sample preparation
Twenty tablets were weighed and finely powdered. Weighed exactly amount of powder 800.0 mg which contain 30 mg of VB1, 10 mg of VB2, 20 mg of VB6, 100 mg of VB3 and 400 mg of VC, it was taken into 200 ml volumetric
flask and 50 ml mobile phase was added, the volumetric flask were sonicated for 15 min to effect complete dissolution of vitamins, the solution were then made up to volume with mobile phase, 2.0 mL of this solution were transferred to a 20 mL volumetric flask and complete with mobile phase. The solution was filtered through 0.45 µ m Millipore filter.
Standard solution of validation
The validation of the analytical method was studied using two lines: one that contains only the different standards of vitamins (VC, VB3, VB6, VB2 and VB1) which were used for calibration; and the validation standards were prepared
in the placebo (the reconstituted solution described above).
The calibration standard solutions were replicated on three different days, with four concentration levels and three repetitions. The chosen concentration levels for each vitamin were VC (0.16, 0.2, 0.24 and 0.28 mg/mL), VB3 (0.04,
0.05, 0.06 and 0.07 mg/mL), VB6 (0.008, 0.01, 0.012 and 0.014 mg/mL), VB2 (0.004, 0.005, 0.006 and 0.007
The concentration levels selected for the validation standards were the same as the levels of the calibration standards. Four replicated were prepared at each concentration level for three days.
Computations
JMP software was used for the treatment of experimental design in screening factors and response surface
methodology, Matlab was used for tolerance interval calculation.
Development step Plackett-Burman design
Before starting an optimization procedure, it is an important to identify the crucial affecting the quality of the derived outcomes. In the present study the significance of six independent factors on the quality of the separation was investigated using a tow-level Plackett-Burman design.
Screening design can identify significant main effects rather than interaction effects [39, 40]. In this study six factors were examined in tow levels: type of organic modifier (X1), type of column (X2), concentration of ion-pair reagent
(X3), column temperature (X4), pH of buffer (X5) and flow rate of mobile phase (X6). The high and low levels of
factors were determined based on preliminary experiments (Table 1). The responses factors chosen were: R1
resolution between VC and VB3, R2 resolution between VB3 and VB6, R3 resolution between VB6 and VB2, R4
resolution between VB2 and VB1 and retention time of the last peak.
Table 1: Factors examined in screening phase by Plackett-Burman design
Independent factors Unit level (-1) level (+1)
Type of organic modifier - Acetonitrile Methanol
Type of column - A B
Concentration of ion-pair mol/L 0.01 0.02
Column temperature °C 20 30
pH of buffer - 2 2.5
Flow rate of mobile phase mL/min 0.8 1.2
Box-Behnken design
Box-Behnken experimental design is one of the most frequently employed designs for nonlinear response. It is preferable to the face-centered central composite and Doehlert designs not only because it requires fewer test runs but also because it is rotatable. Indeed, Box–Behnken designs do not contain any points at the extremes of the cubic region created by the two-level factorial. All of the design points are either on a sphere or at the center of a sphere. This design is advantageous when the points on one or more corners of the cube represent factor-level combinations that are prohibitively expensive or impossible to test because of physical constraints on experimentation [41, 42].
Based on the factors selected previously from the screening stage, the levels of the significant parameters and the interaction effects between various factors (% acetonitrile, pH-value, Concentration pair-ion) which influence significant the chromatography retention times and the separation of vitamins were analyzed and optimized using Box-Behnken design. In the present study, the experimental plan consisted of 15 trials and the independent variables were studied at three different levels, which are listed in (Table 2).
Table 2: Factors examined in optimization phase by Box-Behnken design
Independent factors levels (-1) 0 (+1)
Proportion of Acetonitrile (%) 5 10 15
pH 2 3 4
Concentration of ion-pair reagent (M) 0.01 0.02 0.03
The statistical model using for this design is of the following form:
Eq.1
Where Y is the selected response; which calculated by the model, X1, X2 and X3 are coded variables, corresponding
to proportion of acetonitrile, pH of buffer solution and concentration of ion-pair reagent respectively, b1, b2 and b3
are linear effects, b12, b13 and b23the interaction effects and b11, b22 and b33are quadratic effects of X1, X2 and X3 on
the response e is an error term.
The selected responses were: Rt (Y1) retention time of the last peak, R1 (Y2) resolution between VC and VB3, R2
(Y3) resolution between VB3 and VB6, R3 (Y4) resolution between VB6 and VB2 and R4 (Y5) resolution between VB2
Validation step
Validation based on accuracy profile approach
The new approach of validation based on total error has a number of very important advantages, it can be consider as a simple decision tool, whose we don’t use many statistics; however we can be aware precision and accuracy at each concentration level using this approach. In the other hand, it allows us to calculate the uncertainty of the method and the accuracy profile.
Selectivity
According with the goal defined in selection Method step, the chromatographic separation of five vitamins was checked by selectivity. Indeed, the selectivity of the method is a very important step that can check on the one hand, the existence or absence of any interference with the retention time of five vitamins, on the other hand, the absence of the matrix effect.
Response function
The choice of the response function is the critical step of the validation. This step is one of the most important that the reliability of validation results which are obtained will depend on the selected regression model. Several regression models were fitted in order to analyze the relationship between concentration and analytical response. In this study more accurate profiles are built with same data but using different models of regression; we tested eight models namely the linear regression through 0, the linear regression model, the weighted 1/X or 1/X2linear model, the quadratic regression model, the linear regression after square root transformation data, the linear regression after log transformed data. From each regression curve obtained, the concentrations of the validation standards were back-calculated, which allowed obtaining at each concentration level relative mean bias, the upper and the lower β -expectation tolerance limits at 90 % level by considering the standard deviation for the intermediate precision. Then we can select the accurate profile which is more favorable and easier that achieves the goal. Also validation is based on two essential concepts: precision and trueness [43-55].
Estimation of precision
The precision of an analytical procedure is usually expressed as the variance, standard deviation or coefficient of variation of a series of measurements [43-55]. In the present study, no data is missed; therefore the repeatability and intermediate precision can be evaluated at each level of concentration using one way analysis of variance. Indeed, two main variances are estimated within-series variance (SW) and between-series variance (SB).
If ;
The repeatability and intermediate precision will respectively:
and Eq.2
If not
Where, was the total variance of the set of measures.
Estimation of trueness
The trueness of an analytical procedure (or bias), at each concentration level, is obtained by calculating the difference between the introduced concentrations mean ( and the calculated concentrations mean ( . The bias can be expressed in absolute or relative terms or in recovery terms, compared to the introduced quantities
[43-55] and was assessed from the validation standards in the matrix at four concentration levels, as follows:
Eq.3
Eq.4
Accuracy profile
Each method can be considered as accurate over the concentration range investigated, as long as the upper and lower
β-expectance limits did not exceeded the European Pharmacopoeia acceptance limits settled at λ= ±10% for each concentration level.
Using the parameters calculated previously; bias (%), , and ,the lower and the upper β -expectation tolerance interval limits are calculated as follows [43-54].
Eq.5
Eq.6
Where is the quantile of the Student t distribution with degrees of freedom, where p is the number of
series, n the number of replicates for the validation standards, and , with was calculated at jth concentration level.
Measurement uncertainty
To simplify the interpretation of the results performed by this method and judge its capability to provide accurate measurements, uncertainty is estimated for each concentration level. The Uncertainty values calculated by Equation 7 are compared with the limits for acceptance [35-38].
Eq.7
Where, and were the β-expectation tolerance intervals, t(υ) is the (1+β)/2quantile of the student t distribution
with degrees of freedom and was the calculated concentration at jth level.
RESULTS AND DISCUSSION
Development of RP – HPLC Method
The statistical analysis of ANOVA is given in (Table 3). An independent factor had effect on a given response when it had a p-value< 0.05
Table 3: Factor effects and associated p-values results for Plackett-Burman design
Factors Tr R1 R2 R3 R4
Estimate p-value Estimate p-value Estimate p-value Estimate p-value Estimate p-value Intercept 24.18 0.002 10.88 0.000 11.20 0.000 13.72 0.000 8.33 0.000
X1 -12.95 0.026 -1.10 0.042 -2.78 0.024 -3.78 0.026 1.22 0.111
X2 2.12 0.631 0.09 0.827 -0.19 0.829 -2.37 0.107 3.24 0.004
X3 3.47 0.442 0.13 0.757 -0.11 0.902 -0.68 0.594 0.66 0.341
X4 0.31 0.944 0.40 0.366 0.94 0.327 0.66 0.608 -0.41 0.544
X5 -2.8 0.53 -0.04 0.908 -0.86 0.369 -1.60 0.243 2.21 0.017
X6 0.27 0.951 1.61 0.01 2.65 0.029 1.18 0.373 1.85 0.032
Analytically, the type of organic modifier (X1) has the most significant influence on the selected response except
response 5 (R4). It is important to note that when acetonitrile was used as an organic modifier, we find better results
compared to methanol. The retention time of the last peak was minimized with acetonitrile rather than methanol. Acetonitrile was chosen as the proper organic modifier for the optimization phase. The effect of type of column is positive (except RT and R3) that is to say that column A is better than column B for this analytical method. It also
appears clear that there is an effect of ion-pair reagent concentration and buffer solution‘s pH. However, this effect takes both negative and sometimes positives. Accordingly, we must seek the optimal values of effect of these factors.
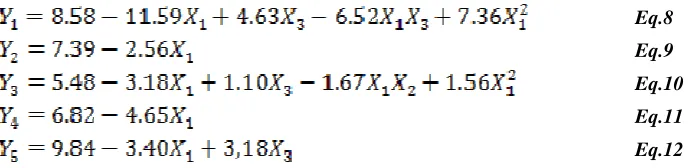
For estimation of coefficient in the approximating polynomial function (Eq.1) applying coded values of factor levels, the least square regression method was performed. The resulted equations (Eqs.8–12) for all four responses
Y1, Y2, Y3, Y4 and Y5 are presented below:
Eq.8
Eq.9
Eq.10
Eq.11
Eq.12
Statistical parameters obtained from ANOVA are given in (Table 4). Taking a risk of 5%, non-significant terms were eliminated from the model postulated a priori.
From result illustrated in table 4, it was concluded that proportion of acetonitrile (X1) were the most significant
factor affecting the five responses, whilst concentration of ion-pair reagent(X3) mostly affected Rt, R2 and R4.the pH
(X2) had any significant effect in the selected responses. Quadratic terms also created important effect, X12 had
significant effect on the investigated retention time Rt and resolution R2. Factor interaction X1X3 had also significant
[image:7.595.73.420.117.201.2]effect on the measured responses (retention time Rt and resolution R2).
Table 4: Factor effects and associated p-values results for Box-Behnken design
Factors Rt R1 R2 R3 R4
Estimate p-value Estimate p-value Estimate p-value Estimate p-value Estimate p-value ACN -11.59 0.000 -2.56 0.000 -3.18 0.000 -4.65 0.005 -3.40 0.024
pH 1.21 0.403 0.27 0.354 -0.01 0.987 -0.45 0.657 1.23 0.296 C.PI 4.63 0.017 0.55 0.091 1.10 0.025 -0.17 0.866 3.18 0.030
ACN*pH -1.81 0.378 -0.32 0.427 -0.17 0.737 -0.12 0.935 -0.32 0.840 ACN*C.PI -6.52 0.018 -0.60 0.170 -1.67 0.019 -1.68 0.272 2.16 0.208 pH*C.PI 0.04 0.984 0.35 0.391 0.50 0.355 0.12 0.931 -0.09 0.953 ACN*ACN 7.36 0.013 0.85 0.080 1.56 0.028 -0.41 0.783 1.55 0.365 pH*pH -0.22 0.913 -0.13 0.747 -0.34 0.540 2.49 0.139 -3.63 0.067 C.PI*C.PI -1.62 0.445 -0.67 0.148 -0.56 0.325 -1.18 0.443 -0.47 0.777
R2 (%) 95.94 95.7 95.95 85.45 85.61
The variation of the response was correctly related to the variation of the factors. Three dimensional plots for the measured responses were performed, based on the model polynomial functions to assess the change of the response surface. In (Fig.1), response surface (3D) showing the effect of proportion of acetonitrile (X1) and concentration of
ion-pair reagent (X3) on responses Y1, Y2, Y3, Y4 and Y5respectively are presented. The pH-value (X2) was maintained
constant at 3.6 for the five presentation of response, the choice of pH was not arbitrary, we tried to set a pH between 3.0 and 4.0 to avoid the destruction of the column.
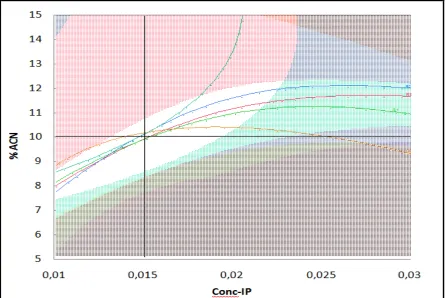
Before continuing, it was important to identify some important criteria of optimization, indeed in the first hand minimum retention time of the last peak and in the other hand maximum resolution between the peaks. A graphical method were used for global optimization which are based on contour overlay plots (Fig.2). These plots depict the alteration of all selected responses against two independent factors, whilst keeping the rest at constant level (pH=3.6). The optimum experimental conditions were defined by white area in (Fig.2). In this area the examined substances were separated in less than 10 min giving the maximum possible resolution for the critical pair of separation (R1, R2, R3 and R4). The optimum conditions identified with the aid of overlay contour plots were in the
Figure 1: Responses surfaces related to proportion of acetonitrile (%) and concentration of ion-pair (M) : (A) retention time of the last peak (Rt), (B) resolution between ascorbic acid and Nicotinamide (R1), (C) resolution between Nicotinamide and pyridoxine hydrochloride (R2), (D) resolution between pyridoxine hydrochloride and riboflavin (R3) and (E) resolution between riboflavin and
thiamine hydrochloride (R4). pH was kept constant t at (3,6)
Figure 2: Overlay contour plot of the investigated response for % acetonitrile proportion and column temperature. pH was kept constant (3,6)
Eventually the optimal conditions for the identification of the five vitamins and VC; using hexanesulphonic acid sodium salt as the ion pairing reagent were investigated and established. The best results for simultaneous determination of VB1, VB2, VB3, VB6 and VC using Box-Behnken design were obtained with following mobile
[image:8.595.84.530.324.622.2]Figure 3: Chromatogram of the optimum conditions for the separation of five vitamins: Ascorbic Acid, Nicotinamide, Pyridoxine hydrochloride, Riboflavin and thiamine hydrochloride
Under the described experimental conditions, the values of retention times were: 0.92 min for VC, 1.84 for VB3,
2.65 for VB6, 4.41 for VB2 and 7.8 for VB1.
The resolution factors between the chromatographic peaks were calculated from the equation where t2, t1 are the retention times of the two components and w1, w2 are
the peaks widths at the base of the two respective peaks: 7.3 for VB3/VC, 4.9 for VB6/VB3, 6.9 for VB2/VB6, 8.2 for
VB1/VB2.
Validation based on accuracy profile approach
Before starting the test method validation, we tried to assess the conformity of the system of the five vitamins by HPLC chromatographic method. System suitability is verified by six injections in determining the acceptability criteria (Table 5).
Table 5: System suitability
Compounds Retention time RSD (%) Aire RSD (%) Résolution
Ascorbicacid 0.78 0.8 ---
Nicotinamid 0.23 0.8 7.3
Pyridoxine 0.52 0.7 4.9
Riboflavin 0.15 0.5 6.9
Thiamine 0.96 0.6 8.4
[image:9.595.89.525.465.731.2]Selectivity
It was first thought necessary to verify the absence of any interference at the retention time of the five vitamins. For this, the selectivity of the method is verified by comparing typical chromatograms obtained by analyzing a part of solutions: placebo solution, mobile phase and standard vitamins. The result in (Fig.4) show that there is no interference with the five vitamins peaks.
Function response
Eight response functions are examined, among which we may notice that some provide better results than others such as the linear response function, linear functions through zero and the model with mathematical transformation. We noticed that the zero crossing and the maximum concentration level model provided the most efficient results for all vitamins except VB3.
Finally, it appears that the best adapted profile is the one consisting in calibrating only at the maximum concentration level for vitamins VC, VB1, VB2 and VB6 and the Straight line model for VB3.
Precision
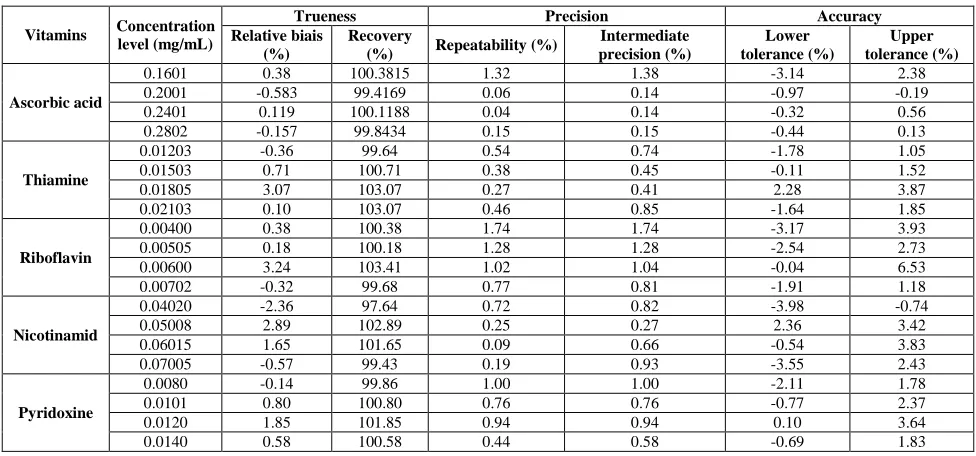
The repeatability (% RSD) and intermediate precision (% RSD) performed by one way balanced ANOVA are shown in (Table 6). For VC the %RSD values for repeatability and intermediate precision did not exceed 1.32% and 1.38% respectively. For VB2 the %RSD values for repeatability and intermediate precision did not exceed 1.74%.
For VB1, VB3 and VB6 the %RSD values for repeatability and intermediate precision did not exceed 1.0%.
Trueness
The result of trueness expressed in %bias and % recovery as can be seen in (Table 6) were assessed from the validation standards in the matrix at four concentration levels.
[image:10.595.62.550.421.649.2]The trueness of the proposed method was demonstrated of the five vitamins since the relative bias did not exceed the value of 3.5%. These values are less than ± 5%, limits for active substances and in particular to ±10% for vitamins in pharmaceutical formulations, which indicated a very low bias and the absence of matrix effect.
Table 6: Validation results for five vitamins using different models
Vitamins Concentration level (mg/mL)
Trueness Precision Accuracy
Relative biais (%)
Recovery
(%) Repeatability (%)
Intermediate precision (%) Lower tolerance (%) Upper tolerance (%) Ascorbic acid
0.1601 0.38 100.3815 1.32 1.38 -3.14 2.38
0.2001 -0.583 99.4169 0.06 0.14 -0.97 -0.19
0.2401 0.119 100.1188 0.04 0.14 -0.32 0.56
0.2802 -0.157 99.8434 0.15 0.15 -0.44 0.13
Thiamine
0.01203 -0.36 99.64 0.54 0.74 -1.78 1.05
0.01503 0.71 100.71 0.38 0.45 -0.11 1.52
0.01805 3.07 103.07 0.27 0.41 2.28 3.87
0.02103 0.10 103.07 0.46 0.85 -1.64 1.85
Riboflavin
0.00400 0.38 100.38 1.74 1.74 -3.17 3.93
0.00505 0.18 100.18 1.28 1.28 -2.54 2.73
0.00600 3.24 103.41 1.02 1.04 -0.04 6.53
0.00702 -0.32 99.68 0.77 0.81 -1.91 1.18
Nicotinamid
0.04020 -2.36 97.64 0.72 0.82 -3.98 -0.74
0.05008 2.89 102.89 0.25 0.27 2.36 3.42
0.06015 1.65 101.65 0.09 0.66 -0.54 3.83
0.07005 -0.57 99.43 0.19 0.93 -3.55 2.43
Pyridoxine
0.0080 -0.14 99.86 1.00 1.00 -2.11 1.78
0.0101 0.80 100.80 0.76 0.76 -0.77 2.37
0.0120 1.85 101.85 0.94 0.94 0.10 3.64
0.0140 0.58 100.58 0.44 0.58 -0.69 1.83
Accuracy and Accuracy Profile
The lower and the upper tolerance interval limits for each concentration level were calculated using (Eqs. 5
and 6) respectively. The results calculated expressed in % and presented in (Table 6) shows that the two-sided 90%
tolerance limits for all vitamins except VB2 fell within the acceptance limits for assay ±5% at every concentration
level studied. The accuracy profiles of each compound are presented in (Fig.5). As well as the acceptance limits for vitamins in pharmaceutical formulations prepared were set at ±10%, the accuracy profiles indicate that 90%-expectation tolerance intervals are within the limits of 5% except VB2.By examining the accuracy profile of VB2, we
dispersion measurement, especially at third concentration level. Note that these tolerance intervals fell always within the acceptance limits of 10%.
Therefore, the proposed method was accurate over the concentration range investigated, which demonstrate its ability and performance to quantify both the five vitamins.
Measurement Uncertainty
Accuracy profile is a decision-making graphical tool aiming to help the analyst in deciding whether an analytical procedure is valid. In this study, uncertainty was also estimated at each concentration level of the validation standards using (Eq. 7) with a confidence level of 95%.
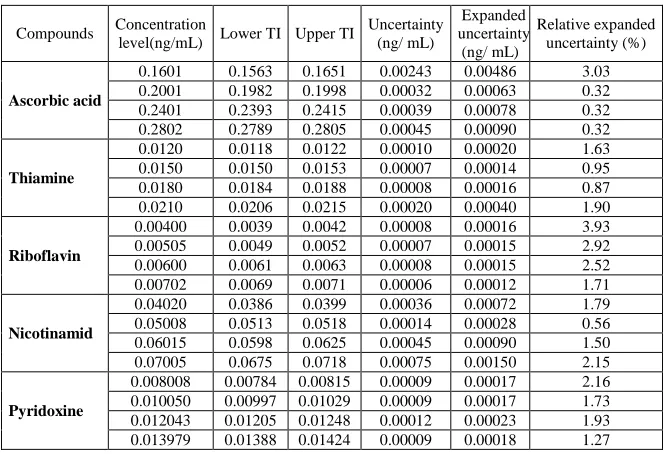
In (Table 7) is presented the values of uncertainty expressed in %. For VB1, VB3 and VB6 % uncertainty values did
not exceed 2.5%. For VC% uncertainty values did not exceed 3.1%. For VB2 % uncertainty values did not exceed4
[image:12.595.140.472.203.430.2]%. These results show again the capability and performance of our proposed method to quantify accurately and with minimal error of five vitamins in drugs formulation.
Table 7: Results of Measurement Uncertainty
Compounds Concentration
level(ng/mL) Lower TI Upper TI
Uncertainty (ng/ mL) Expanded uncertainty (ng/ mL) Relative expanded uncertainty (%) Ascorbic acid
0.1601 0.1563 0.1651 0.00243 0.00486 3.03 0.2001 0.1982 0.1998 0.00032 0.00063 0.32 0.2401 0.2393 0.2415 0.00039 0.00078 0.32 0.2802 0.2789 0.2805 0.00045 0.00090 0.32
Thiamine
0.0120 0.0118 0.0122 0.00010 0.00020 1.63 0.0150 0.0150 0.0153 0.00007 0.00014 0.95 0.0180 0.0184 0.0188 0.00008 0.00016 0.87 0.0210 0.0206 0.0215 0.00020 0.00040 1.90
Riboflavin
0.00400 0.0039 0.0042 0.00008 0.00016 3.93 0.00505 0.0049 0.0052 0.00007 0.00015 2.92 0.00600 0.0061 0.0063 0.00008 0.00015 2.52 0.00702 0.0069 0.0071 0.00006 0.00012 1.71
Nicotinamid
0.04020 0.0386 0.0399 0.00036 0.00072 1.79 0.05008 0.0513 0.0518 0.00014 0.00028 0.56 0.06015 0.0598 0.0625 0.00045 0.00090 1.50 0.07005 0.0675 0.0718 0.00075 0.00150 2.15
Pyridoxine
0.008008 0.00784 0.00815 0.00009 0.00017 2.16 0.010050 0.00997 0.01029 0.00009 0.00017 1.73 0.012043 0.01205 0.01248 0.00012 0.00023 1.93 0.013979 0.01388 0.01424 0.00009 0.00018 1.27
Application in routine step oh HPLC method
[image:12.595.137.477.537.598.2]After optimized and validated our HPLC Method, it seems necessary to apply the method in routine phase for quality control the finished product. The product containing the five vitamins was analyzed three times in different lots for one month. The recovery calculated expressed in% given with % RSD are summarized in the (Table 8). A reading of these values, we note that our proposed method still keeps these performances and it can be applied in routine phase for quality control.
Table 8: Results of the determination of five vitamins in tablets formulation
Vitamins Amount in tablet (mg/unite) Found (mg/unite) Recovery (%) RSD (%)
Ascorbic-Acid 200 208.47 104.23 0.82
Nicotinamide 50 53..6 107.19 0.38
Pyridoxine hydrochloride 10 10.11 101.07 1.83
Thiamine hydrochloride 15 15.6 103.98 0.61
Riboflavine 5 5.29 105.85 0.47
Method comparison
In order to compare our developed method with other methods in the literature, we begin with the Ivanovic method
[8] which has a long analysis time, it can come up to 27 min in acquisition time, and it is also noticed that the
validation method used is not clearly indicated, the authors speak just of the calibration curve. Regarding the recent work of Jin [26], we have found that the acquisition time is about 25 min and the development and validation is performed in a conventional manner.
CONCLUSION
A HPLC method for separate and quantify simultaneously of five vitamins was developed and validated. The method development was focused on the use of experimental design methodology. Screening design factors (Plackett-Burman) and response surface methodology (Box-Behnken) were applied to optimize the operating conditions of the liquid chromatography technique. A validation strategy based on accuracy profiles was then successfully applied to demonstrate the ability of our procedure to quantify ascorbic acid (vitamin C), Thiamine hydrochloride (vitamin B1), Riboflavin (vitamin B2), Nicotinamide (vitamin B3) and Pyridoxine hydrochloride (B6)
in tablet multivitamin over a broad concentration range. Different validation criteria were evaluated by applying an appropriate regression model. The method showed suitable performance in terms of selectivity, trueness, precision, accuracy and linearity.
Furthermore, using data of validation we have successfully estimated the measurement uncertainty at each concentration level for each vitamin. Values that do not exceed a limit of 5% indicate that our method is efficient and could assure a 95% chance of good results in future measures. This finding was confirmed by the results obtained in routine control phase of finished products containing the five vitamins during one month.
Acknowledgements
The authors would like to thank the director and staff of the Drugs Quality Control Laboratory of Rabat, Morocco, for their fruitful assistance.
REFERENCES
[1] American Medical Association (AMA) Drug Evolutions, 5th edition 1983. [2] USP Dictionary of USAN and international Drug Names, 2nd edition. [3] M Moulin, A Coquerel, Pharmacologie (1998),
[4] W Erkang, H Weiying, J. chromatography 1988;447:256-262.
[5] C Nsengiyumva, JO De Beer, WV Wauw, AJ Vlietinck, E Parmentier. J. Chromatographia 1997; 44: 11-12. [6] L Fotsing, M Fillet, I Bechet, Hubert Ph, J. Crommen. J Pharma Biomed Anal 1997;15: 1113-1123.
[7] C Wojciechowski, N Dupuy, CD Ta, JP Huvenne, P Legrand. J Food Chemistry 1998;63: 133-140. [8] D Ivanovic, A Popovic, D Radulovic, M Medenica. J Pharma Biomed Anal 1999;18: 999–1004. [9] P Moreno, V Salvado. J Chromatogr A 2000;870, 207–215.
[10] L Garcia, S Blázquez, MP San Andrés, S Vera. J Anal Chim Acta 2001; 434:193–199.
[11] CK Markopoulou, KA Kagkadis, JE Koundourellis. J Pharma Biomed Anal 2002;30:1403-/1410.
[12] MM Delgado-Zamarreno, I Gonzalez-Maza, A Sanchez-Perez, R Carabias-Martinez. J Chromatogr A 2002; 953: 257–262.
[13] U Holler, C Brodhag, A Knobel, P Hofmann, V Spitzer, J. Pharma. Biomed. Anal., 2003;31: 151-158. [14] F Feng, K Wang, Z Chen, Q Chen, J Lin, S Huang, J. Anal. Chim. Acta., 2004; 527: 187–193.
[15] B Klejdus, J Petrlová, D Potešil, V Adam, R Mikelová, J Vacek, R Kizek, V Kubá. J. Anal. Chim. Acta., 2004 520 57–67.
[16] R Amidzic, J Abrboric, O Cudina, S Vladimirov, J. Serb Chem. Soc., 2005; 70 (10): 1229–1235. [17] O Heudi, T Kilinc, P Fontannaz, J. Chromatogr. A, 2005;1070: 49–56.
[18] RC Barthus, LH Mazo, RJ Poppi, J. Pharma. Biomed. Anal., 2005;38: 94–99. [19] Z Chen, B Chen, S Yao, J. Anal. Chim. Acta., 2006; 569: 169–175.
[20] M Aranda, G Morlock, J. Chromatogr. A, 2006;1131: 253–260.
[21] S Vidovic, B Stojanovic, J Veljkovic, L Prazic-Arsic, G Roglic, D Manojlovic, J. Chromatogr. A, 2008;1202: 155–162.
[22] S Thomas, R Kumar, A Sharma, R Issarani, B Prakash Nagori. Indian J. Chemical Technology, 2008;15: 598-603.
[23] PR Maria, A Nicula, AT Nicula, C Socaciu. Bulletin UASVM, Agriculture 65(2): pISSN 1843-5246; eISSN 1843-5386; 2008.
[24] P Chen, R Atkinson, WR Wolf, J. AOAC International, 2009; 92: No. 2.
[25] Y Novi, W Diah, T Wartini. Canadian J. on Scientific and Industrial Research , 2011. [26] P Jin, L Xia, Z Li, N Che, D Zou, X Hu, J. Pharm. Biomed. Anal., 2012; 70: 151– 157. [27] H Soni, AK Singhai, K Mishra, S Sharma, Int. J. Pharm. Sci. Res., 2012;3(7): 2163-2167. [28] FMA Al-Timimi, MJA Al-Gani, EMK. Al-Dulimyi. J. Chem. Pharm. Res., 2013;5(10):15-20.
[29]Eurachem guide, the fitness for purpose of analytical methods, a laboratory guide to method validation and related topics. 1998. 1st Edition. UK.
[31] ISO 17025. General requirements for the competence of testing and calibration laboratories. ISO. Geneva ;
2000.
[32] J Goupy, Pratiquer les plans d’expériences, Dunod, Paris ;2005. [33] M Kincl, S Turk, F Vrecer, Int. J. Pharm. 2005; 291:39-49. [34] R Mee, Technometrics, 1984;26:251-254.
[35] T Saffaj, B Ihssane, Talanta, 2011;85: 1535-1542. [36] T Saffaj, B Ihssane, Talanta, 2012a; 92: 15-25. [37] T Saffaj, B Ihssane, Talanta, 2012b; 94: 361-362.
[38] T Saffaj, B Ihssane, F Jhilal, H Bouchafra, S Laslami, SA Sosse, Analyst, 2013;138:4677-4691. [39] B Dejaegher, Y Vander Hyden, J. Pharma. Biomed. Anal., 2011;56: 141-158.
[40] D Brynn Hibbert, J. Chromatogr. B, 2012;910: 2-13.
[41] B Ihssane, M Charrouf, A Abourriche, Y Abboud, A Bouabidi, A Bennamara, T Saffaj, J. Acta
Chromatographica, 2011;23: 41-57
[42] RL Mason, RF Gunst, JL Hess, John Wiley & Sons, Hoboken, NJ, 2003;586.
[43] Ph Hubert, J Nguyen-Huu, B Boulanger, E Chapuzet, P Chiap, V Cohen, P Compagnon, W Dewe, M Feinberg, M Lallier, M Laurentie, N Mercier, G Muzard, C Nivet, L Valat, STP. Pharma Pratiques, 2003;13: 101-138.
[44] Ph Hubert, JJ Nguyen-Huu, B Boulanger, E Chapuzet, N Cohen, PA Compagnon, W Dewé, M Feinberg, M Laurentie, N Mercier, G Muzard, L Valat, STP. pharma pratiques, 2006;16: 28-58
[45] Ph Hubert, JJ Nguyen-Huu, B Boulanger, E Chapuzet, N Cohen, PA Compagnon, W Dewé, M Feinberg, M Laurentie, N Mercier, G Muzard, L Valat, E Rozet. J. Pharm. Biomed. Anal. 2007;45: 82-96.
[46] Y Vander Heyden, A Nijhuis, J Smeyers-Verbeke, BGM Vandeginste, D L Massart, J. Pharm. Biomed. Anal.,
2001;24:723-753.
[47] A Bouabidi, E Rozet, M Fillet, E Ziemons, E Chapuzet, B Mertens, R Klinkenberg, A Ceccatof, M Talbi, B Streel, A Bouklouze, B Boulangerh, Ph Hubert, J. Chromatogr. A, 2009;1217: 3180-3192.
[48] AG Gonzalez, MA Herrador, Talanta, 2006;1217: 896-901.
[49] B Boulanger, P Chiap, W Dewé, J Crommen, Ph Hubert, J. Pharm. Biomed. Anal., 2003;32: 753-765. [50] M Feinberg, J. Chromatogr. A, 2007; 1158: 174-183.
[51] M Feinberg, Labo-Stat: guide de validation des méthodes d’analyse. Lavoisier, ISBN, 2009 ; 978-7430-1106-2. [52] M Feinberg, Techniques de l’ingénieur, 2012 ; p224.
[53] L Zufia, A Aldaz, N Ibanez, C Viteri. J. Pharm. Biomed. Anal., 2009;49: 547-553. [54] B Streel, B Cahay, R Klinkenberg, J. Chromatogr. B, 2009;877: 2290-2300.