Journal of Chemical and Pharmaceutical Research, 2014, 6(6):615-622
Research Article
CODEN(USA) : JCPRC5
ISSN : 0975-7384
Special display instrument for fiber current transducer
Zhigang Di
*, Chunrong Jia and Jingxuan Zhang
College of Electrical Engineering, Hebei United University, Tangshan Hebei, China
_____________________________________________________________________________________________
ABSTRACT
The current transducer is the important measurement in power system, it plays more and more significant role in power system analysis, relay protection and current measurement. With the improvement of transmission capacity of power system, traditional electromagnetic current transducer exposed more and more defects, and it is difficult for traditional electromagnetic current transducer to meet requirement of power automatic and digital development. Recent years, with the development of optoelectronic technology, fiber current transducer emerged and received extensive attention of researchers at home and abroad, and the research of fiber current transducer has been significant research area. More important, display instrument of fiber current transducer is the difficulty to solve. The special display instrument was proposed in this paper. First, the effective value chip was utilized to sample alternating signal and output effective value. Second, single chip computer and signal process technology were utilized in this instrument, single chip computer be in charge of algorithm computing and data display processing. By numeral simulation and experiment, the error of designed special display instrument was 0.04%. So this instrument can meet the requirement of 0.2 level National Standard, it is suitable for fiber current transducer to measure small current.
Key words: Fiber current transducer; current measurement; display instrument; single chip computer; signal process _____________________________________________________________________________________________
INTRODUCTION
Since the Faraday Effect and Pockels Effect were discovered, soon after optical theory was proposed to measure high voltage and current, but because of the technical constraints, this research was limited to imagining and experiment. Until 1970s, with the development of semiconductor integrated circuit technology, optical fiber transmission and sensor technology, optic fiber transducer emerged. In 1980s, the application research of optic fiber sensor technology in power system has made many breakthroughs[1]. Lots of optics voltage transducer and current transducer prototype have been developed in USA, Japan, France and the former Soviet Union, and they were carried on preliminary operation in the high-voltage power supply station[2]. In 1988, “the fiber-optic sensor” conference was convoked by IEEE Institute in New Orleans of United States, many experts and scholars from all over the world reported on their latest research on optics voltage transducer and current transducer, from then on, the fiber transducer developed from the laboratory to industrial site, and started to enter the developing period. Fiber transducer has unique advantage of simple configuration, small volume, light weight and so on[3]. So it is deemed to the ideal succedaneum for electromagnetism current transducer. Display instrument is the most important part of fiber transducer, and it will influence the accuracy of fiber transducer. As a result, a special display instrument for fiber current transducer was proposed on the base of single chip computer and signal process.
instrument. The system chart is shown in figure 1.
Fig.1: Diagram of fiber current transducer
In this transducer, ADC was utilized in high voltage side, DAC was utilized in low voltage side. The controlling time-series circuit must be adopted in high voltage side to keep ADC and DAC working synchronously. The main advantage of this fiber current transducer is that appropriate ADC can meet the accuracy requirement of system because ADC has high accuracy.
The display instrument is the most important part in fiber current transducer, the main function of display instrument is to sample alternating voltage signal from the low voltage side, then display the voltage effective value corresponding to measured current.
EXPERIMENTAL SECTION
Supposing v(t) is periodic alternating signal, T is the period, the effective value can be defined as
∫
=
TRMS
v
t
dt
T
V
0 2)
(
1
(1)v(t) can be expressed as the sum of each harmonic component
∑
+
=
k
k k
k
t
a
t
v
(
)
cos(
ω
0ϕ
)
(2)which
T
π
ω
0=
2
is fundamental wave angular frequency.[
]
∑
∑
⋅
+
+
+
+
=
cos
(
)
cos
(
)
cos(
)
)
(
2 2 0 2 0 02 n m n m k
k
k
t
a
a
m
t
n
t
a
t
v
ω
ϕ
ω
ϕ
ω
ϕ
(3)which
m
≠
n
, and2
)
2
2
cos(
2
1
)
(
cos
0 0 2 k kk
t
k
ω
+
ϕ
=
+
ω
+
ϕ
(4)
]
)
cos[(
2
1
]
)
cos[(
2
1
)
cos(
)
cos(
m
ω
0t
+
ϕ
mn
ω
0t
+
ϕ
n=
m
+
n
ω
0t
+
ϕ
m+
ϕ
n+
m
−
n
ω
0t
+
ϕ
m−
ϕ
n(5)
Take formula (1)~(5) into (1), the true RMS of periodic function can be defined
2
1 2∑
=
N k RMSa
V
(6)As for digital measurement system, the effective value of periodic function can be defined as
N
k
x
V
N m
RMS
∑
=
12
)
(
(7)
which xm(k) is the sampling value of alternating signal at kTs time, Ts is the period of sampling, m is the ordinal
number of sampling value, k is the sampling number in m periodic wave. N is the sample frequency in one period of alternating signal. As long as Ts meets Nyquist sampling theorem, VRMS is the true effective value of measured
alternating signal. When formula (7) is utilized to compute effective value, Ts should meet the following condition
LTs=T (8)
which T is the period of alternating signal, L is integer, namely that T must be integer multiple of Ts.
For the sinusoidal signal, according to formula (7), the formal sampling procedure is shown in figure 2[4].
Fig.2: Formal sampling procedure for sinusoidal signal
In figure 2, N is the sampling points in one period. Generally, N is utilized to recover the period of measured signal. Supposed alternating signal is v(t), T is the period, so the frequency f = T-1. Sampling frequency f0 should meet the
requirement that f0/f is integer, in one period sampling points N = f0/f can ensure sampling period is integer,
sampling interval Ts = T/N.
The sampling points of measured alternating signal were shown in figure 3.
Fig.3: Sampling points of measured alternating signal
which Pm, Pm+1 is zero crossing point from negative to positive.
According to figure 3, formula (7) can be modified as
m m m
m m m
m m RMS
N
N x x
x V
η
ζ
ζ
+ + −
+ + + =
1
) ( )
2 ( )
1
( 2 2
2
L
(9)
|)
)
(
|
)
1
(
/(
|
)
(
|
m m m1 m m m=
x
N
x
++
x
N
η
(10)|)
)
(
|
)
1
(
/(
)
1
(
+
−1 −1=
m m m mm
x
x
x
N
Ts is the time interval from xm(k) to xm(k+1), k = 1, 2,……, Nm-1,
ζ
mT
sis the time interval from xm(1) to Pm,s m
T
η
is the time interval from xm(Nm) to Pm+1.0
≤
ζ
m≤
1
,0
≤
η
m≤
1
,ζ
m+
η
m≠
1
. In this way, Ts may notmeet Nyquist sampling theorem, so the time interval between the first sampling point xm(1) of m wave and Pm is not
0, but
ζ
mT
s. The last sampling point xm(Nm) and the last point of m wave is the zero crossing point from negativeto positive, so the time interval between the sampling point xm(Nm) and Pm+1 is not 0, but
η
mT
s. Obviously, if0
=
m
ζ
,η
m=
0
, then xm+1(1) = 0, xm(1) = 0, and the formula (9) is the same as (7), the sampling system can meetNY Quist sampling theorem again. The curve shape of alternating signal crossing zero points from negative to positive was shown is figure 4.
Fig. 4: The curve of alternating signal
From figure 4, the curve near Pm is approximate as line. In fact, if x = 0, then
x
x
x
x
=
=
)
sin(
)
tan(
(12)If x deviates from zero point, but very close to zero point, formula (12) still comes to existence, and the sine curve can be approximated to be line. As a result, at the point of Pm,
)
(
/
)
1
(
/
m−1=
m−1 m−1 m−1m
η
x
x
N
ζ
Also because
1
1
=
+
m−m
η
ζ
so(
)
)
(
)
1
(
/(
)
(
)
(
)
1
(
/
)
1
(
1 1 1 1 1 1 1 − − − − − − −+
=
+
=
m m m m m m m m m m mN
x
x
N
x
N
x
x
x
η
ζ
(13)Same argument, at the point of Pm+1,
(
)
)
(
)
1
(
/(
)
(
)
(
)
1
(
/
)
1
(
1 1 m m m m m m m m m m mN
x
x
N
x
N
x
x
x
+
=
+
=
+ +η
ζ
(14)Formula (13) and (14) is another form of (10) and (11) respectively, but take care that the sampling points of each period may be different, namely Nm-1 may be different from Nm.
Fig.5: Further improved sampling method
Figure 5 was generated according to the absolute value of original alternating sinusoidal signal. By sampling on absolute value, as long as sampling density is enough,
ζ
mcan be appliedη
m universally, and sampling period is not necessary to be integral multiple of signal's period, but half signal's period. As a result, both the computing process is simplified and the accuracy of effective value is not influenced, andζ
m=η
m, so formlua (9) can be simplified asm m m
m m m
m m RMS
N
N x x
x V
η
ζ
ζ
+ + −
+ + + =
1
) ( )
2 ( )
1
( 2 2
2
L
(15)
In paper, the effective value of alternating signal was achieved by hardware, and mainly RMS converter AD736 was utilized to achieve effective value. Sinusoidal signal was input to AD736, then the effective value corresponding to sinusoidal signal was input AD converter, finally SCM was utilized to process corresponding digital signal and to be displayed on digital pipe.
The basic thought of software design was shown as figure 6.
Fig. 6: Chart of basic thought of software design
The rule of data process in CPU is described as follows.
First, the software must be as far as simple possible to improve the data process efficiency of CPU, and the maximum of ADC sampling points is 400 in half period because the frequency of input signal is 50 Hz, the process speed of effective value chip is 40 kHz.
Second,
ζ
m is not computed as formula (13) but can be regulated manually in the procedure of simulation toensure that
ζ
m is in reasonable range. As a result, the requirement of algorithm can be satisfied, and the system accuracy can be ensured. [image:5.595.210.406.77.177.2] [image:5.595.207.406.399.463.2]Fig.7: The software flow pattern
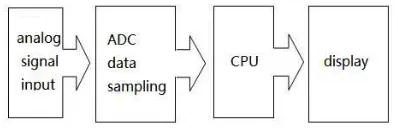
The basic thought of hardware design was shown in figure 8.
Fig.8: Chart of basic thought of hardware design
First, the analog sine signal was processed by step-down process to ensure reasonable range so as to be sampled by RMS chip. Second, the RMS value was step-up processed to input ADC chip. Third, the digital signal was processed by SCM. Finally, the RMS value was displayed on digital pipe.
Based on the design thought above, the hardware system was proposed. The hardware system was constituted by true RMS unit, operational amplifier unit, ADC unit, SCM system unit, latch and digital pipe.
The operational principle of circuit was described as following. First, the analog voltage corresponding to measured current was input to true RMS unit to achieve effective value corresponding to analog voltage. Second, the effective value was amplified by operational amplifier unit so as to be processed later. Third, the amplified effective value was input to ADC unit to achieve corresponding digital signal. Finally, the digital signal was input to SCM system to be processed, then was input to latch to drive digital pipe, and was displayed on digital pipe. As a result, the destination of displaying measured current in real time and linearly was realized.
RESULTS AND DISCUSSION
Fig.9 The simulation result of designed instrument
As for this simulation, the maximum of input sinusoidal voltage is 10 V. According to formula (1), the theoretical effective value should be 7.07 V. The simulation process last 20 minutes and the results were read every minute, which was shown in table 1.
Tab. 1 The simulation result of instrument
Time(Min) 1 2 3 4 5 6 7 8 9 10 Data(V) 7.066 7.068 7.070 7.071 7.066 7.065 7.067 7.072 7.071 7.070 Time(Min) 11 12 13 14 15 16 17 18 19 20
data(V) 7.068 7.069 7.066 7.071 7.071 7.070 7.071 7.069 7.069 7.068
From figure 9 and table 1, the designed display instrument was feasible, output voltage was very stable, and the error could be controlled less than 0.04%.
On the base of simulation result, the experiment was carried on also. The whole experiment system was constitute by sensor head Rogowski coil[6], signal process system[7], display instrument and power supply system in high voltage section. In the experiment of this system, WYP-4 stabilized voltage supply was adopted as current supply, DLB-1B 0.1 level high precise ampere meter, 0.1 level KEITHLEY2000 MULTIMETER digital multi-meter, and HG1841 power frequency phase meter to test according to the test points prescribed by GB1208-1997. The experiment results were shown in table 2.
Tab.2 The experiment results of instrument
I(A) 0.25 1 3.0 5.0 6.0 100
Eo1(mV) 25 100 300 500 600 500
Eo2(mV) 24.81 99.35 298.38 498.85 601. 52 501.80
ε
% -0.76 -0.65 -0.54 -0.23 0.25 0.36Notes: Uo is output voltage of Rogowski coil; Eo1 is theoretical output voltage; Eo2 is actual output voltage
From the result, this system meets the requirement of 0.2 level.
CONCLUSION
Acknowledgments
This research was supported in part by the Basic Research Program of Hebei province No. 12212172 and 12212201. A project supported by scientific research fund of Hebei provincial education department (ZD2013102); Doctor Scientific Research Foundation of Hebei United University.
REFERENCES
[1]Emerging Technologies Working Group, IEEE Transactions on Power delivery, 1994,9(4), 1778-1788. [2]Liu Ming, Li Jinzhong, Liu Rui, et al. TRANSFORMER, 2013, 50(2), 24-28.
[3]F.P. Kapron, D.B. Keck, R.D. Maurer, Applied Physics Letters, 1970, 17(10), 423-425. [4]Ning Y. N, Wang Z. P. Palmer A.W. Rev Sci Instrum, 1995, 66(5), 3097-3111.
[5]Xu Ken, J. Huazhong Univ. of Sci & Tech., 2006, 34(2), 51-54. [6]Liu Chunsheng, International Electronic Elements, 2001, 7(9), 66-68.