Journal of Digital Information Management
ABSTRACT: The objectives of this study are to develop integrated model for successful adoption of management information systems. The questionnaire used to collect primary data, and analyzes the data by using AMOS soft-ware and SPSS statistical program. Then use appropri-ate statistical processors and tests, for getting signs to support subject of study. The 424 completed question-naires were received from the companies. Data were ob-tained through 4 telecommunication companies in Yemen. Confirmatory factor analysis derived from exploratory fac-tor analysis of all measures used in the study and hy-pothesized model were tested with structural equation modeling techniques. A major contribution of this study is the formation of a theoretically based model which in-tegrates the technological, organizational, and people factors. Furthermore, the use of SEM in this study allows simultaneous investigations of different dimensions. The research model also serves as a diagnostic tool for the organizational administrators and managers to identify the factors that impact on successful adoption the manage-ment information systems in the organization. Addition-ally, identify the impact of adoption of management infor-mation systems in organizations. Moreover, this study provides impetus for organizational administrators and managers to continue adopting of management informa-tion systems in their organizainforma-tions.
Subject Categories and Descriptors
K.6 [Management of Computing and Information Systems]; Performance and usage measurement: H.5.3 [Group and Or-ganization Interfaces]
General Terms: Management Information Systems
Adoption of Management Information Systems in Context of Yemeni Organizations: A
Struc-tural Equation Modeling Approach
Yaser Hasan Al-Mamary *1, Alina Shamsuddin1, Nor Aziati Abdul Hamid 1,
Mohammed Hasan Al-Maamari2
1Faculty of Technology Management and Business
Universiti Tun Hussein Onn Malaysia 86400, Malaysia
2Faculty of Humanitarian & Administrative Sciences
University of Modern Sciences Yemen [email protected]
Keywords: Integrated Model, Adoption, MIS, Telecommuni-cation Companies, Yemen
Received: 9 August 2015, Revised 14 September 2015, Ac-cepted 19 September 20
1. Introduction
There are a lot of organizations in Yemen that used man-agement information systems, such as banks, telecom-munications companies, ministries and universities. The use of management information systems has become necessary for any organization to facilitate the work pro-cedures, improve efficiency, productivity, and improve per-formance in general [1].
However, studies relating to this issue within the context of Arab countries are few and lack of the ability to pro-pose an appropriate evaluation criterion for Arab organi-zations [4]. According to Al-Mamary et al. [5] the field of MIS in Yemeni companies still dealing with issues in adopting the technologies and success factors.
As mentioned by past scholars, the successful adoption of technology in any companies is much depending on technology, project, organization, user, social, and task factors [6]. However, in reality these factors are much neglected by organizations especially among small com-panies. According to Al-Mamary et al. [7] the organiza-tions must understand the factors that affect successful adoption of MIS toward enhancing the individual perfor-mance.
In addition, there are separate models that explain the factors that effect on MIS success. For example, there are separate model for use of technological factors, use, user satisfaction, individual impact and organizational impact developed by Delone and Mclean [8] ; [9]. In addi-tion, there are separate model for the organizational fac-tors developed by Igbaria et al. [10]. Moreover, there are separate model for people factors developed by Igbaria & Livari [11], and there are separate model for perceived usefulness , and ease of use developed by Davis [12]. In this study, the researcher used the theories that focus on technology factors, organizational factors, and people fac-tors. The selected theories for this study are compatible with the Yemen’s problems .The selected theories are technology acceptance model ,IS success model ,Com-puter Usage Model, and Personal Computing Acceptance Model. The proposed model will combine the four theo-ries to develop integrated model for the management in-formation systems success. The proposed model con-sists of Technology Acceptance Model variables (perceived usefulness), information system success model variables
(system quality, information quality , service quality, user satisfaction, and organizational impact) , Personal Com-puting Acceptance Model variables (top management sup-port , and user training), and Computer Usage Model vari-ables (computer self-efficacy and user experience). 2. Literature Review
The most popular models in the field of information sys-tems success, and technology adoption such as the tech-nology acceptance model and information system suc-cess model focuses on the technology factors of the successful implementation of information systems. In addition there are another model called computer usage. The theoretical grounding for this model mainly comes from technology acceptance model (TAM) social cogni-tive theory (SCT), theory of reasoned action (TRA), and theory of planned behavior (TPB). This model focuses on people factors (computer experience, computer anxiety, and self-efficacy) and organizational support. Moreover there are another model called personal computing ac-ceptance. This model focuses on the organizational fac-tors (Intra-organizational Facfac-tors, Extra-organizational Factors). This study developed integrated model for suc-cessful adoption of management information systems that link three factors (technological, organizational, and people).
2.1 Technology acceptance model
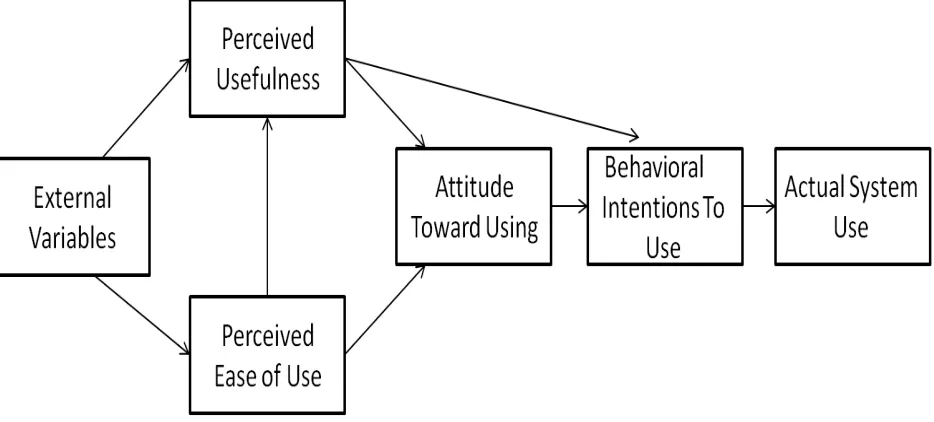
[image:2.612.74.541.505.716.2]The Technology Acceptance Model, developed by Davis et al. [13] was one of the most influential research model in studies of the determinate of information systems and information technology acceptance to predict intention to use and accept the information systems and information technology by individuals. In the Technology Acceptance Model, there are two determinants including perceived ease of use and perceived usefulness [14]. Figure 1 depicts the Technology Acceptance Model.
In summary TAM identifies two main variables for the suc-cessful adoption of the technology, and these variables are perceived usefulness, and ease of use. The model mainly focuses on the technical side only. Note that ac-ceptance of the technology in some cases need top man-agement support to encourage the end user to accept the technology or need training or self-efficacy etc. There-fore, there are several aspects to encourage the end-user to accept the technology.
2.2 Delone and Mclean’s IS Success Model
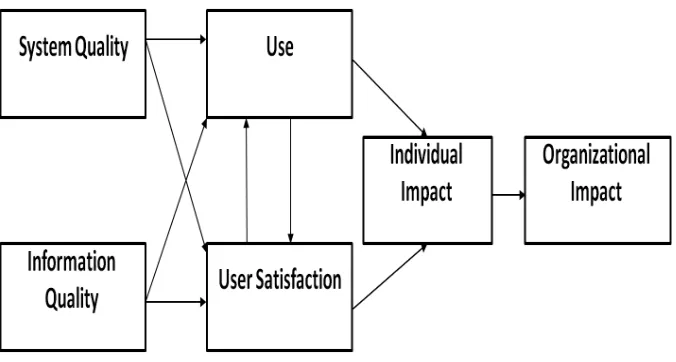
[image:3.612.169.507.148.329.2]Delone & Mclean [8] performed a review of the research published during the period 1981–1987, and created tax-onomy of IS success based upon this review. In their 1992 paper, they identified six variables or components of IS success: system quality, information quality, use, user satisfaction, individual impact, and organizational impact [15]. Figure 2 depicts IS Success Model.
Figure 2. Delon and Mclean IS Success Model In 2003, proposed updated IS success model developed
by [9]. They added service quality as one important di-mension. In addition, they added intention to use as an alternative measure because an attitude is worthwhile to
measure in some context. Finally, they combined indi-vidual and organizational impact to one dimension, named net benefits. Figure 3 depicts updated Delon and Mclean IS Success Model.
Figure 3. Updated Delone & Mclean IS Success Model
In summary Delone and Mclean [8] IS success model identifies six variables for the successful adoption of in-formation systems, and these variables are system qual-ity, information quality , use, user satisfaction , individual impact, and organizational impact as the independent variables in the model focuses on the technical side only. In addition the updated model of Delone & Mclean [9] added the service quality as an independent factor. More
over it was merged with two variables (individual impact and organizational impact) to net benefits. Despite the update, but the model is still focused on the technical mainly ignoring the rest of the factors.
2.3 Computer Usage Model
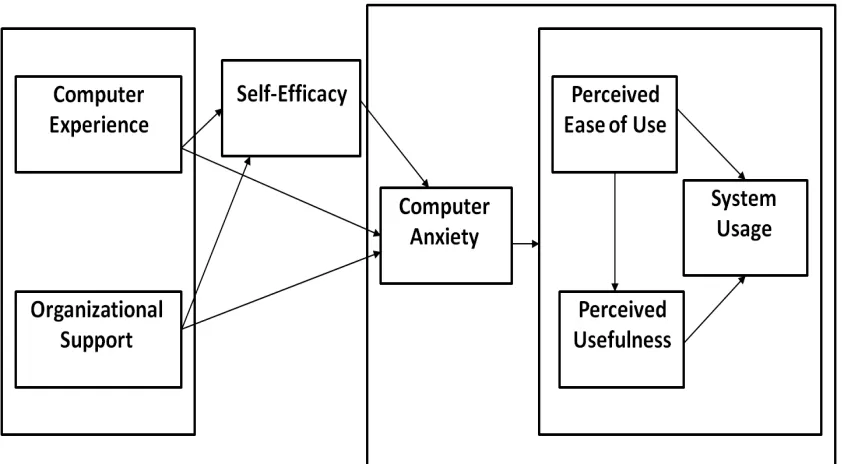
[image:3.612.172.456.425.635.2](TRA), theory of planned behavior (TPB); and technology acceptance model (TAM). This model introduces an ex-tended technology acceptance model (TAM) that explic-itly incorporates self-efficacy and its determinants (expe
[image:4.612.107.528.82.314.2]rience and organizational support) as factors affecting computer anxiety, perceived ease of use, perceived use-fulness and the use of computer technology [11]. Figure 4 depicts Computer Usage Model.
Figure 4. Computer Usage Model
In summary Computer Usage Model identifies seven vari-ables for system usage, and these varivari-ables are (com-puter experience, organizational support, self-efficacy, computer anxiety, perceived ease of use, perceived use-fulness, and system usage) and proposed that computer experience, organizational support will effect on computer anxiety, and self-efficacy. The model focuses on the people factors and organizational support and then its effect on system factors then effect on system usage. In addition, the model did not identify the organizational factors clearly. 2.4 Personal Computing Acceptance Model
[image:4.612.126.492.509.724.2]This model posits that personal computing acceptance in small firms is a function of perceived ease of use and perceived usefulness. These two factors are hypothesized to have a direct effect on personal computing acceptance in small firms. The model also proposes that these two factors mediate the effects of the intra and extra-organi-zational factors on personal computing acceptance. The figure shows that the intra- and extra-organizational ftors are expected to influence personal computing ac-ceptance indirectly through their effects on perceived ease of use and perceived usefulness [10]. Figure 5 depicts Personal Computing Acceptance Model
In summary Personal Computing Acceptance Model iden-tifies two main variables for acceptance of the use of the system, and these variables are (intra-organizational , and extra-organizational support) and proposed that these fac-tor will effect on perceived usefulness and ease of use . The model mainly focuses on the organizational side and its effect on the system factors then effect on the system usage.
3. The Conceptual Model
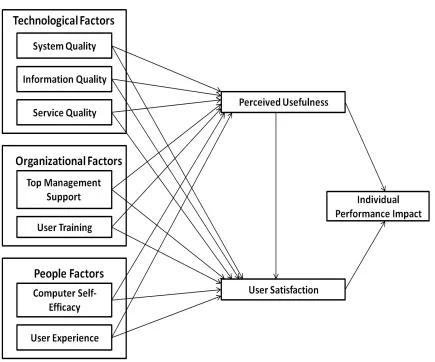
[image:5.612.104.539.149.511.2]The conceptual model combined the four theories that compatible with Yemen problem, to develop integrated model for the successful adoption of MIS in telecommu-nication companies in Yemen. Proposed model consists of the following variables : system quality, information quality, service quality, top management support, user training, computer self-efficacy, computer experience, perceived usefulness, user satisfaction, and individual performance impact. Figure 6 shows the conceptual model.
Figure 6. Integrated Success Model of Management Information Systems 4. Methodology
4.1 Research population / sample
The population for this study are the employees in tele-communication companies in capital of Yemen (Sana’a). The type of sample techniques used in this study was a purposive sample. A total of 700 questionnaires were dis-tributed, and 530 questionnaires were recovered. How-ever, among those returned questionnaire, 100 were com-pletely blank, and 6 were not answered comcom-pletely. There-fore, remaining 424 questionnaires were used for data analysis.
4.2 Data collection Method
This study used a survey for data collection. A total of 424 respondents from a telecommunication company located in Sana’a (Yemen) participated in this study by complet-ing a survey questionnaire. Draft questionnaire was
pilot-tested by 104 employees to get their opinion about word-ing, content, meaningfulness, relevance, and clarity of the scale.
4.3 Instrument Design
consultants and experienced academicians. The re-sponses were collected on seven point liker type scale ranging from strongly disagree to strongly agree (l. Strongly disagree, 2.disagree, 3.Somewhat disagree, 4.Neither agree or disagree, 5. Somewhat agree, 6. Agree, 7. Strongly agree) .
4.4 Data Analysis Method
Data was analyzed quantitatively using the appropriate descriptive analysis for the distribution of population and demographic while validate to model using structural equa-tion modeling techniques. The proposed research model was analyzed using the structural equation modeling (SEM) supported by Analysis of Moment Structures (AMOS) and the SPSS (Statistical Package for the So-cial Sciences) software program. AMOS is a SEM pack
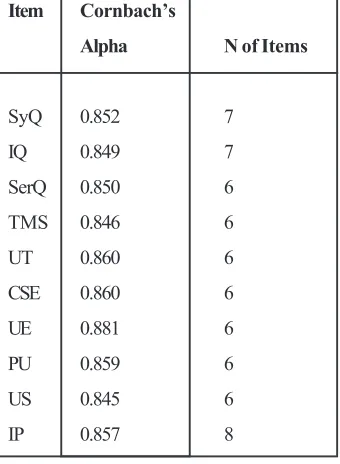
Item Cornbach’s
Alpha N of Items
SyQ 0.852 7
IQ 0.849 7
SerQ 0.850 6
TMS 0.846 6
UT 0.860 6
CSE 0.860 6
UE 0.881 6
PU 0.859 6
US 0.845 6
IP 0.857 8
age supported with SPSS. The researcher used struc-tural equation modeling technique instead of others tech-niques for the following reason .The previous techtech-niques such as multiple regression, factor analysis, multivariate analysis of variance , discriminate analysis can examine only a single relationship at a time , do not enable us to test the researcher’s entire theory. For this reason, we now analysis by using structural equation modeling. Struc-tural equation modeling can examine a series of depen-dence relationships simultaneously.
4.5 Reliability
Cronbach’s Coefficient Alpha is method used to measure the reliability of the questionnaire between each field and the mean of the whole fields of the questionnaire. Table 1 shows the values of Cronbach’s Alpha for each construct.
5. Results
[image:6.612.221.392.224.461.2]5.1 Demographic Profiles
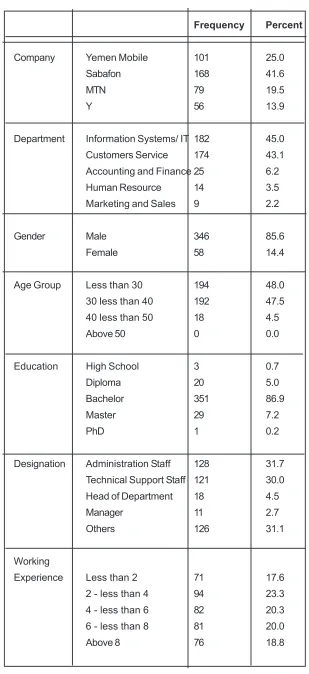
Table 2 shows the profile of respondents 5.2 Exploratory Factor Analysis
According to Suhr [16] exploratory factor analysis (EFA) is a variable reduction technique which identifies the num-ber of latent constructs and the underlying factor struc-ture of a set of variables. exploratory factor analysis (EFA) helps to determine what the factor structure looks like according to how participant responses. Exploratory fac-tor analysis is essential to determine underlying constructs for a set of measured variables.
This study employed principal components analysis (PCA) with Promax rotation , exploratory factor analysis was performed using SPSS (version 22).
5.3 Measurement model
The measurement models for each construct were as-sessed using confirmatory factor analysis (CFA) employ
ing AMOS version 21. According to Awang [17] confirma-tory factor analysis (CFA) is a special form of factor analy-sis. It is employed to test whether the measures of a constructs are consistent with the researcher’s under-standing of the nature of that construct.
In other hand, use four indicators whenever possible . Moreover having three indicators per construct is accept-able, particularly when other constructs have more than three. Constructs with fewer than three indicators should be avoided [18].
In this study, confirmatory factor analysis (CFA) was per-formed on the measurement model to assess the unidi-mensionality, reliability, and validity of measures. Two broad approaches were used in the CFA to assess the measurement model. First, consideration of the goodness of fit (GOF) criteria indices and second, evaluating the validity and reliability of the measurement model. 5.4 Measures of Goodness-of-Fit
[image:6.612.222.392.229.461.2]Frequency Percent
Company Yemen Mobile 101 25.0
Sabafon 168 41.6
MTN 79 19.5
Y 56 13.9
Department Information Systems/ IT 182 45.0
Customers Service 174 43.1
Accounting and Finance 25 6.2
Human Resource 14 3.5
Marketing and Sales 9 2.2
Gender Male 346 85.6
Female 58 14.4
Age Group Less than 30 194 48.0
30 less than 40 192 47.5
40 less than 50 18 4.5
Above 50 0 0.0
Education High School 3 0.7
Diploma 20 5.0
Bachelor 351 86.9
Master 29 7.2
PhD 1 0.2
Designation Administration Staff 128 31.7 Technical Support Staff 121 30.0
Head of Department 18 4.5
Manager 11 2.7
Others 126 31.1
Working
Experience Less than 2 71 17.6
2 - less than 4 94 23.3
4 - less than 6 82 20.3
6 - less than 8 81 20.0
[image:7.612.166.475.63.737.2]Above 8 76 18.8
Table 2. Profile of respondents fied model reproduces the covariance matrix among the
indicator variables [18]. According to Awang [17] in SEM
mo-ment , there is no agreemo-ment among the researchers which fitness indexes should be reported. Hair et al. [18] rec-ommend the use of at least three fit indexes by including at least one index from each category of model fit. The three fitness categories are absolute fit, incremental fit, and parsimonious fit . The information concerning the fit-ness index category, their level of acceptance, and com-ments are presented in Table 3.
5.5 Confirmatory Factor Analysis Results
CFA was performed on the measurement model compris-ing ten factors, which were: system quality (SyQ), infor mation quality (IQ), service quality (SerQ), top manage-ment support (TMS), user training (UT), computer
self-Name of category Name of Index Level of Acceptance
Absolute Fit RMSEA (a),(d) ,(e), (f) RMSEA <0.05 good fit (d) ,(e),(f) RMSEA <0.08 acceptable fit
Absolute Fit GFI (a),(d) ,(e),(f) GFI > 0.9 means satisfactory fit . (b),(c) ,(e),(f) Value greater than 0.80
suggests a good fit.
Incremental Fit NFI (d) ,(e),(f) NFI > 0.9 means satisfactory fit. (b) ,(e),(f) Value greater than 0.80 suggests a good fit
Incremental Fit CFI (a),(d) ,(e),(f) CFI > 0.9 means satisfactory fit .
Incremental Fit TLI (b),(d) ,(e),(f) TLI > 0.9 means satisfactory fit
parsimonious Fit Chisq/df (d) ,(e),(f), The value < 5.0 is acceptable
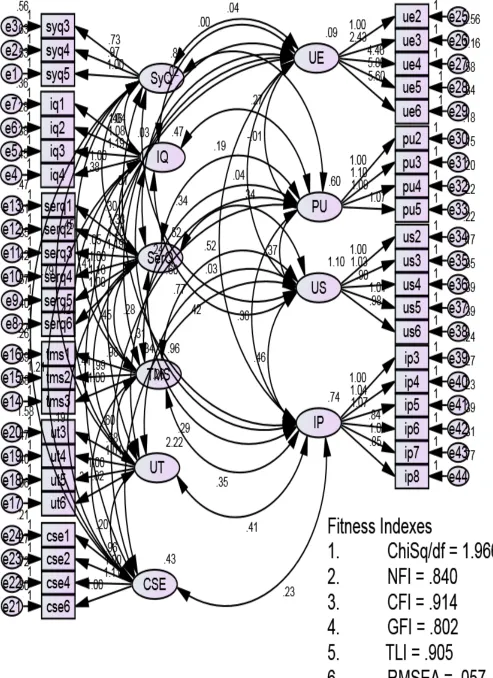
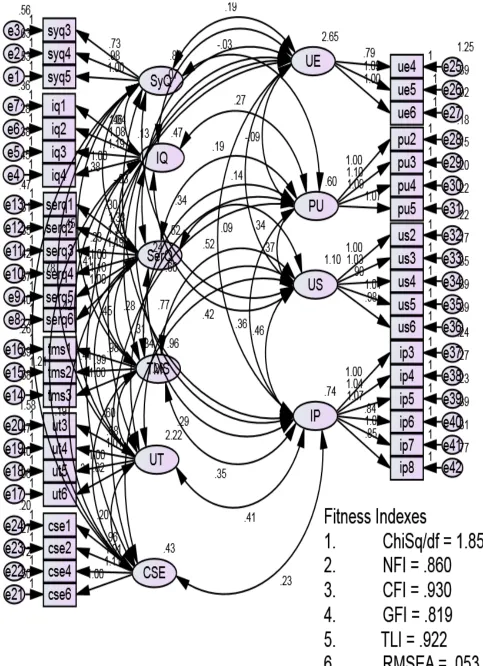
efficacy (CSE),user experience (UE), perceived useful-ness (PU),user satisfaction (US) , and individual perfor-mance (IP). Figure 2 depicts CFA model derived from EFA. In initial CFA 44 items were used which were derived from the EFA .In addition Figure 3 depicts the final CFA model after deleting these problematic items.
5.6 CFA model derived from EFA
The CFA model fit well based on GOF indexes as shown in Table 4, and Figure 7 .The NFI, GFI achieved the re-quired level was above 0.8, TLI , and CFI achieved the required level was above 0.9 the ChiSq/df <3 ,and the RMSEA was below 0.08.
Index Value Comments
Chisq/df = 1.966 The required level is achieved NFI = 0.840 The required level is achieved CFI = 0.914 The required level is achieved GFI = 0.802 The required level is achieved TLI = 0.905 The required level is achieved RMSEA = 0.057 The required level is achieved
Given the fact that the goodness of fit indices of the initial run of CFA were within the recommended level, but there are two items ue2, ue3 with low factor loading less than 0.6. According to Awang [17] factor loading value should be greater than 0.6 . According to Hair et al. [18] the size of the factor loading is one important consideration. In the case of high convergent validity, high loadings on a factor would indicate that they converge on a common point, the latent construct. At a minimum, all factor loadings should be statistically significant. Because a significant
[image:8.612.129.508.35.250.2]loading could still be fairly weak in strength, a good rule of thumb is that standardized loading estimates should be .5 or higher. According to Norhayati and Aniza [23] factor loading should to be > 0.6. According to Othman et al. [24] for the first step, any measuring item having a factor loading less than 0.6 should be deleted from the measurement model. Thus, after dropping these problem-atic items, the measurement model was re-run, as rec-ommended by ([17]; [18]). Final CFA model is depicted in Figure 8.
Table 4. The Improved Fitness Indexes for All Constructs Simultaneously (CFA model derived from EFA)
[image:8.612.219.426.451.580.2]5.7 Final CFA model
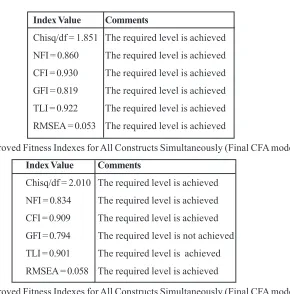
The CFA model fit well based on GOF indexes as shown in Table 5, and Figure 8. The NFI , GFI were above 0.80, and TLI, CFI were above 0.90 the ChiSq/df <3 ,and the RMSEA was below 0.08. In addition all items with factor loading value greater than 0.6.
5.8 Reliability and Validity of A Measurement Model According to Awang [17] once the CFA procedure for ev-ery measurement model is completed, the researchers need to compute other remaining measures which indi-cate the validity and reliability of the measurement model. For the validity can be assessed through convergent va-lidity (AVE >=0.50) , construct vava-lidity (all fitness indexes for the models meet the required level), and discriminant validity ( all redundant items are either deleted or strained , also the correlation between exogenous con-structs is <= 0.85). According to Zait & Bertea [25] in order to establish discriminant validity there is need for an appropriate AVE (Average Variance Extracted) analy-sis. In an AVE analysis, we test to see if the square root of every AVE value belonging to each latent construct is much larger than any correlation among any pair of latent constructs.
For the reliability can be assessed through internal reli-ability (Cronbach alpha >= 0.70), and construct relireli-ability ( CR >=0.70). Table 6 shows the measures of validity and
Index Value Comments
Chisq/df = 1.851 The required level is achieved NFI = 0.860 The required level is achieved CFI = 0.930 The required level is achieved GFI = 0.819 The required level is achieved TLI = 0.922 The required level is achieved RMSEA = 0.053 The required level is achieved
reliability of a measurement model. In this study AVE, Cronbach alpha, and CR achieved the required level. In addition, the correlation between exogenous constructs is <= 0.85. Moreover, the square root of every AVE value belonging to each latent construct is much larger than any correlation among any pair of latent constructs 5.9 Structural Model
Structural model is set of one or more dependence rela-tionships linking the hypothesized model’s constructs. The structural model is most useful in representing the interrelationships of variables between constructs [18]. Structural Equation Modeling (SEM) was rarely employed by the past researcher. Only few from past researchers used SEM in their analysis method. SEM technique help to produce a better model. Using this technique enable the researchers to simultaneously test complex relation-ship and measure the strength among item from each independents variables and dependent variables of the re-search model. Besides that, SEM can be used to confirm the model that has been developed in the study and sub-sequently the model can be used by other researcher for further study.
5.10 Initially proposed Structural Model
[image:11.612.191.481.363.657.2]The proposed model did not fit well based on GOF in-dexes as shown in Table 8, and Figure 9. The GFI were below 0.80.
Table 5. The Improved Fitness Indexes for All Constructs Simultaneously (Final CFA model)
Index Value Comments
Chisq/df = 2.010 The required level is achieved NFI = 0.834 The required level is achieved CFI = 0.909 The required level is achieved GFI = 0.794 The required level is not achieved TLI = 0.901 The required level is achieved RMSEA = 0.058 The required level is achieved
Given the fact that the goodness of fit indices of the initial run of SEM were not within the recommended level, fur-ther detailed evaluation was conducted to refine and re-specify the model, in order to improve the discriminate validity and achieve better fit of the model [26]. The model refinement procedure applied following criteria recom-mended by researchers. According to Awang [17] factor
[image:11.612.219.425.375.498.2]mended by ([17]; [18]; [26]). Final SEM model is de-picted in Figure 10.
5.11 Revised structural model
The revised model fit well based on GOF indexes as shown in Table 9, and Figure 10 . The GFI, NFI were above 0.80, TLI, and CFI above 0.90, the ChiSq/df <3 ,and the RMSEA was below 0.08. In addition, Table 10 shows the sum-mary of hypotheses testing.
Index Value Comments
[image:12.612.202.419.95.228.2]Chisq/df = 1.900 The required level is achieved NFI = 0.854 The required level is achieved CFI = 0.925 The required level is achieved GFI = 0.810 The required level is achieved TLI = 0.917 The required level is achieved RMSEA = 0.055 The required level is achieved
Table 7. Goodness of Fit Indices for the Revised Structural Model
[image:12.612.152.500.275.713.2]Path Critical Ratios p-value
SyQ—>PU -2.229 0.026 Rejected SyQ—>US 2.587 0.010 * Supported SyQ—>IQ 9.838 *** Supported IQ—>PU 3.730 *** Supported IQ—>US 0.284 0.777 Rejected SerQ—>PU 0.107 0.914 Rejected SerQ—>US -0.852 0.394 Rejected TMS—>PU 2.265 0.024 * Supported TMS—>US 0.612 0.540 Rejected UT—>PU 0.731 0.465 Rejected UT—>US 2.894 0.004 ** Supported CSE—>PU 6.173 *** Supported CSE—>US 2.193 0.028 * Supported UE—>PU -2.922 0.003 Rejected UE—>US 0.683 0.495 Rejected PU—>IP 6.428 *** Supported PU—>US 2.604 0.009 ** Supported US—>IP 5.821 *** Supported
Note: * p < 0.05; ** p < 0.01; *** P< 0.001; SyQ=System Quality; IQ=Information Quality; SerQ=Service Quality; TMS=Top Management Support; UT=User Training; CSE=Computer Self-Efficacy; UE=User Experience; PU=Perceived Usefulness; US=User Satisfaction; IP=Individual performance .
6. Discussion
The organizational administrators and managers must be aware that the there are many factors effect on individual performance. This study helps managers and policy mak-ers in Arab countries to identify the factors that impact on successful adoption the MIS in the organization. In addi-tion, the proposed model of this study serves as a diag-nostic tool for the organizational administrators and man-agers to identify the impact of adopt of MIS in organiza-tions. Moreover, The findings provide incentive for organi-zational administrators and managers to develop appro-priate implementation procedures to improve efficient use of MIS in order to improve the individual performance. In addition , the findings of this study may be helpful to or-ganizations ,mainly information systems department, in the area of successful adoption of information systems. Organizations can utilize of this model to success adop-tion of MIS in organizaadop-tion towards improve the individual performance.
According to empirical findings of this study there is posi-tive and direct relationship between system quality and information quality. This result is consistent with the past studies ([28]; [29]) reported that system quality has a significant and positive effect on information quality .
In addition, the research findings in this study indicate that there are positive and direct relationship between in-formation quality, top management support, and computer self-efficacy with perceived usefulness. This result is con-sistent with the past studies ([30]; [31]) reported that in-formation quality has a significant and positive effect on perceived usefulness. Moreover, (e.g., [32]; [33]), reported that top management support has a significant and posi-tive effect on perceived usefulness. In addition, (e.g., [34]; [35]), reported that computer self-efficacy has a signifi-cant and positive effect on perceived usefulness.
[image:14.612.212.450.27.389.2]Moreover, the research findings in this study indicate that there are positive and direct relationship between system quality, user training, computer self-efficacy, and perceived usefulness with user satisfaction. This result is consistent with the past studies (e.g., [31]; [36]), re-ported that system quality has a significant and positive effect on user satisfaction. In addition, (e.g., [37]; [38]) reported that user training has a significant and positive effect on user satisfaction. Moreover, (e.g., [39]; [40]), reported that computer self-efficacy has a significant and positive effect on user satisfaction. In addition, (e.g., [31]; [36]), reported that perceived usefulness has a significant and positive effect on user satisfaction.
Lastly, the research findings in this study indicate that there are positive and direct relationship between perceived usefulness, and user satisfaction with individual perfor-mance. This result is consistent with the past studies (e.g., [41]; [42]) reported that perceived usefulness has a significant and positive effect on individual performance. In addition, (e.g., [43]; [44]) reported that user satisfac-tion has a significant and positive effect on individual per-formance.
7. Conclusion
The purpose of this study was to evaluate the relationship between technology factors, organizational factors, and people factors with perceived usefulness and user satis-faction toward impact on the individual performance. Data was collected using a survey questionnaire. The result-ant 424 usable responses were analyzed with the SEM technique to validate the theoretical model and test the hypotheses. The proposed model of this study is built from review of literature. The selected theories were com patible with the Yemen’s problems. in particular, the se-lected theories were about information system success, acceptance of technology and usage of computer. SEM analysis were used in the analysis. Given that the final-ized structural model (see Figure 10) show that The pro-posed model fit well. The propro-posed model was tested us-ing AMOS. The fit indices of the modified proposed model show good model fit (Chisq/df=1.900 , NFI=0.854, CFI=0.925, GFI=0.810, TLI=0.917, RMSEA=0.055). The overall goodness-of-fit indices of the model provide statistical evidence of the generalisability of the model as applied to the organizations in Yemen.
Acknowledgements
The authors would like to thank Faculty of Technology Management and Business UTHM for help. In addition thank ministry of Higher Education and Scientific Research in Yemen for support.
References
[1] Al-Mamary, Y. H., Shamsuddin, A., Aziati, N. (2014). The meaning of management information systems and its role in telecommunication companies in Yemen. Ameri-can Journal of Software Engineering, 2 (2) 22–25. [2] Al-Mamary, Y.H., Shamsuddin, A., Nor Aziati, A.H., Al-Maamari, M. H. (2015). Issues Related to Employees at Telecommunication Companies in Yemen and the Role of Management Information Systems in Solving it, Inter-national Journal of Hybrid Information Technology, 8 (12). [3] Al-Mamary, Y. H., Shamsuddin, A., Hamid, N. A. A. (2015). Enhancing Technological Capability of Telecom-munications Sector in Yemen: A Technology Adoption Approach. Mediterranean Journal of Social Sciences, 6 (4S1), 108-112.
[4] Al-adaileh, R. M. (2009). An evaluation of information systems success: A user perspective–the case of jordan telecom group. European Journal of Scientific Research, 37 (2) 226–239.
[5] Al-Mamary, Y. H., Shamsuddin, A., Aziati, N. (2015) The Pilot Test Study of Relationship Between Manage-ment Information Systems Success Factors and organi-zational performance at Sabafon Company in Yemen,
Journal of u- and e- Service, Science and Technology, 8 (2) 337-346.
[6] Petter, S., DeLone, W., McLean, E. R. (2013). Infor-mation systems success: The quest for the independent variables. Journal of Management Information Systems, 29 (4) 7–62.
[7] Al-Mamary, Y. H., Shamsuddin, A., Aziati, N. (2014). Factors affecting successful adoption of management in-formation systems in organizations towards enhancing organizational performance. American Journal of Systems and Software, 2 (5) 121–126.
[8] Delone & Mclean, E. R. (1992). Information systems success: the quest for the dependent variable. Informa-tion Systems Research, 3 (1) 60–95.
[9] Delone., Mclean, W. H. (2003). The delone and mclean model of information systems success: a ten-year up-date. Journal of Management Information Systems, 19 (4) 9–30.
[10] Igbaria, M., Zinatelli, N., Cragg, P., Cavaye, A.L. (1997). Personal computing acceptance factors in small firms: a structural equation model. MIS quarterly, p. 279– 305.
[11] Igbaria, M., Iivari, J. (1995). The effects of self-effi-cacy on computer usage. Omega, 23 (6) 587- 605. [12] Davis, F. D. (1989). Perceived usefulness, perceived ease of use, and user acceptance of information technol-ogy. MIS Quarterly, p. 319–340.
[13] Davis, F.D., Bagozzi, R. P. Warshaw, P. R. (1989). User acceptance of computer technology: a comparison of two theoretical models. Management Science, 35 (8) 982–1003.
[14] Chen, S. C., Li, S. H., Li, C. Y. (2011). Recent re-lated research in technology acceptance model: A litera-ture review. Australian Journal of Business and Manage-ment Research, 1 (9) 124-127.
[15] Petter, S., DeLone, W., McLean, E. (2008). Measur-ing information systems success: models, dimensions, measures, and interrelationships. European Journal of Information Systems, 17(3) 236–263.
[16] Suhr, D.D. (2006). Exploratory or confirmatory factor analysis? SAS Institute Cary.
[19] Forza., Filippini, R. (1998). Tqm impact on quality conformance and customer satisfaction: a causal model.
International Journal of Production Economics, 55 (1) 1– 20.
[20] Greenspoon., Saklofske, D. H. (1998). Confirmatory factor analysis of the multidimensional students life sat-isfaction scale. Personality and Individual Differences, 25 (5) 965–971.
[21] Al-Mamary, Y. H., Shamsuddin, A. (2015). Testing of The Technology Acceptance Model in Context of Yemen ,
Mediterranean Journal of Social Sciences, 6 (4S1), 268-273.
[22] Al-Mamary., Yaser Hasan., Shamsuddin., Alina. (2015). The Impact of Top Management Support, Train-ing, and Perceived Usefulness on Technology Acceptance,
Mediterranean Journal of Social Sciences 6 (6S4), p 1-17.
[23] Norhayati, M., Aniza, A. (2014). Psychometric prop-erties of the malay version of impact of event scale-re-vised (ies-r). International Journal of Collaborative Re-search on Internal Medicine & Public Health (IJCRIMPH), 6 (2).
[24] Othman, N.B., Hussein, H.B., Salleh, S.B.M., Wahid, H.B.A. (2014). Resilience scale: Exploration of items validity and reliability first-order cfa model.
[25] Zait., Bertea, P. E. (2011). Methods for testing dis-criminant validity. Management & Marketing Journal, 9 (2).
[26] Kline, R.B. (2011). Principles and practice of struc-tural equation modeling. Guilford press.
[27] Byrne, B.M. (2001). Structural equation modeling with AMOS: Basic concepts, applications, and programming. [28] Gorla, N., Somers, T.M., Wong, B. (2010). Organi-zational impact of system quality, information quality, and service quality. The Journal of Strategic Information Sys-tems, 19 (3) 207–228.
[29] Ifinedo, P. (2011). Examining the influences of exter-nal expertise and in-house computer/ it knowledge on erp system success. Journal of Systems and Software, 84 (12) 2065–2078.
[30] Pai., Huang, K. I. (2011). Applying the technology acceptance model to the introduction of healthcare infor-mation systems. Technological Forecasting and Social Change, 78 (4) 650–660.
[31] Park, S., Zo, H., Ciganek, A. P. Lim, G. G. (2011). Examining success factors in the adoption of digital ob-ject identifier systems. Electronic commerce research and applications, 10 (6) 626–636.
[32] Chen., Hsiao, J. L. (2012). An investigation on physi-cians acceptance of hospital information systems: a case study. International Journal of Medical Informatics, 81 (12), 810–820.
[33] Shih., Huang, S. S. (2009). The actual usage of erp systems: an extended technology acceptance perspec-tive. Journal of Research and Practice in Information Tech-nology, 41 (3) 263–276.
[34] Lui., Hui, W. (2011). The effects of knowledge on security technology adoption: Results from a quasi-ex-periment. In: Information Science and Service Science (NISS), 2011 5thInternational Conference on New Trends
in, 2, IEEE, 328–333.
[35] Ramayah, T., Aafaqi, B., Ignatius, J. (2004). Role of self-efficacy in e-library usage among students of a pub-lic university in Malaysia. Malaysian Journal of Library and Information Science, 9, 39–58.
[36] Landrum, H.T., Prybutok, V. R., Strutton, D., Zhang, X. (2008). Examining the merits of usefulness versus use in an information service quality and information system success web based model. Information Resources Man-agement Journal (IRMJ), 21 (2) 1–17.
[37] Bradford., Florin, J. (2003). Examining the role of innovation diffusion factors on the implementation suc-cess of enterprise resource planning systems. Interna-tional Journal of Accounting Information Systems, 4 (3) 205–225.
[38] Dezdar., Ainin, S. (2011). The influence of organiza-tional factors on successful erp implementation. Manage-ment Decision, 49 (6) 911–926.
[39] Saba, T. (2012). Implications of e-learning systems and self-efficiency on students outcomes: a model ap-proach. Human-centric Computing and Information Sci-ences, 2 (1) 1–11.
[40] Bin, W., Chu-hong, Z., Qiong-yu, H., Zhen-peng, L. (2010). Empirical research on the factor of erp’s user customer satisfaction based on triadic reciprocal deter-minism. In: Management Science and Engineering (ICMSE), 2010 International Conference on, IEEE, 58– 66.
[41] Ali, B. M., Younes, B. (2013). The Impact of Informa-tion Systems on user Performance: An Exploratory Study. Journal of Knowledge Management, Economics and Information Technology, 3 (2).
[42] Shih, H. P. (2004). Extended technology acceptance model of Internet utilization behavior. Information & Man-agement, 41 (6) 719-729.
[43] Igbaria, M., Tan, M. (1997). The consequences of information technology acceptance on subsequent indi-vidual performance. Information & Management, 32 (3) 113-121.