PATTERN RECOGNITION FOR MANUFACTURING PROCESS VARIATION USING INTEGRATED STATISTICAL PROCESS CONTROL – ARTIFICIAL
NEURAL NETWORK
AHMAD AZRIZAL BIN MOHD ARIFFIN
A project report submitted in fulfillment of the requirement for the award of the Degree of Master of Mechanical Engineering
Faculty of Mechanical and Manufacturing Engineering Universiti Tun Hussein Onn Malaysia
v
ABSTRACT
ABSTRAK
vii
TABLE OF CONTENTS
CHAPTER TITLE PAGE
DECLARATION ii
DEDICATION iii
ACKNOWLEDGEMENT iv
ABSTRACT v
ABSTRAK vi
LIST OF FIGURES xi
LIST OF TABLES xii
LIST OF APPENDICES xiv
1 INTRODUCTION
1.1 Research Background 1
1.2 Problem Statement 2
1.3 Project Objectives 4
1.4 Project Scopes 4
2 LITERATURE REVIEW
2.2 Process Variation 6
2.3 Statistical Process Control (SPC) 9
2.4 Shewhart Control Charts 12
2.5 Control Limits 14
2.6 Average Run Length 15
2.7 Pattern Recognition in SPC 15
ix
3 METHODOLOGY
3.1 Introduction 19
3.2 Project Methodology 19
3.2.1 Research Overview 19
3.2.2 Data Generator 20
3.2.3 ANN Trainer 20
3.2.4 Control Chart 20
3.2.5 Expected results 20
3.3 An integrated MEWMA-ANN scheme 22
3.4 Modeling of Process Pattern 22
3.5 Step in Development of Integrated SPC in ANN-Based CCPR Schemes
25
3.6 Solution of Multivariate In Statistical Process Control 26
3.7 Recognizer Training and Testing 28
3.8 Causes of Variations In The Manufacturing Process of The Product
29
3.9 Examples of variations in the manufacturing process of components in the HDD
31
3.10 Summary 32
4 RESULTS AND DISCUSSIONS
4.1 Introduction 34
4.3 Simulation Process Analysis Using Artificial Neural Network (ANN)
38
4.3.1 Analysis of Data Generator 38
4.3.2 Training for Basic Data Analysis Based on Artificial Neural Network (ANN)
42
4.4 Data Manipulator 44
4.5 Performance Results And Discussion In Hard Disk Drive (HDD) Manufacturing Process.
45
4.6 Results Summary 58
5 CONCLUSIONS AND RECOMMENDATION
5.1 Introduction 60
5.2 Conclusions 60
5.3 Future Works Recommendation 61
REFERENCES 62
APPENDICES 66
xi
LIST OF FIGURES
Figure No. Title Page
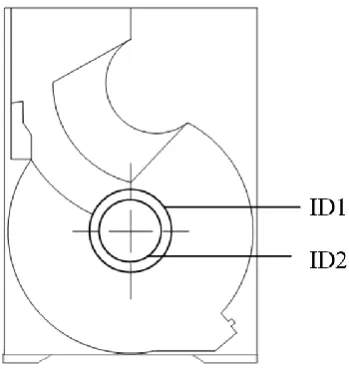
1.1 Critical features of quality that requires bivariate quality control (BQC)
3
2.1 Chance and assignable causes of variation 8
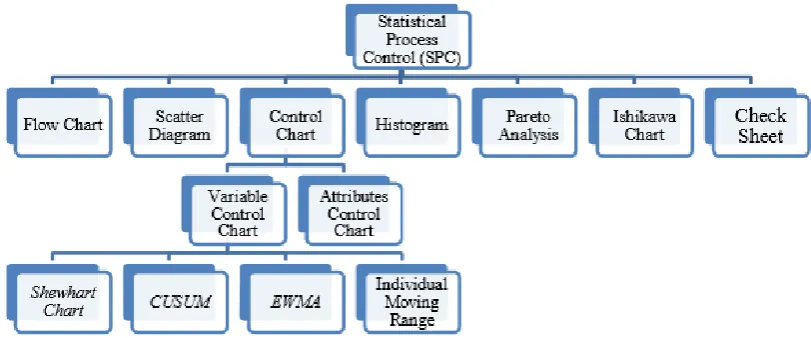
2.2 Basic statistical process control tools specification 9
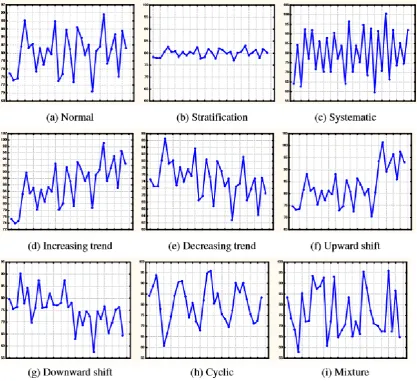
2.3 Nine control chart patterns 11
2.4 Shewhart Charts 14
2.5 Typical normal and abnormal patterns 17
3.1 Research flow chart 21
3.2 Conceptual diagram of an integrated MEWMA-ANN scheme
22
3.3 Development and Implementation Stages of ANN-Based CCPR scheme
25
3.4 Framework for the Integrated SPC-ANN 26
3.5 Independent and Joint Monitoring (Montgomery, 2005) 30
3.6 The process of making the HDD 32
4.1 Positioning and concentricity for counter bore 35 4.2 Process variations when loading errors and offsetting tool 36 4.3 Pneumatic clamping problem due to low pressure 37
LIST OF TABLES
Table No. Title Page
2.1 Types of charts 13
3.1 Conditions of multivariate process mean shifts 24 4.1 Sources of variation in the bivariate process 36 4.2 Sources of variation of less pressure in pneumatic fixtures 37 4.3 Analysis of Data Generator for Features-Based ANN and Raw
Data Based ANN
39
4.4 Analysis of Training For Data Base 43
4.5 Summary of data manipulator characteristic for 50 data sets. 45
4.6 Total sources of variation in HDD 45
4.7 Inspection result for ARL0, Normal Pattern (N (0, 0)) 46
4.8 Outputs of the scheme for ARL0, Normal Pattern (N (0, 0)) 48
4.9 Inspection results based on loading error (case 2) 49
4.10 Outputs of the scheme for loading error 51
4.11 Inspection results based on offsetting tool (case 3) 52
4.12 Outputs of the scheme for offsetting tool 54
4.13 Inspection results based on less pressure in pneumatic fixtures (case 4)
xiii
4.14 Outputs of the scheme for pneumatic clamping problem 57 4.15 Results summary and comparison of the best result for ARL1 58
4.16 Value of ARL1 based on previous study. 58
4.17 Diagnose performance (RA) of MEWMA-ANN scheme for mean shifts condition and total process
59
LIST OF APPENDICES
Appendix Title Page
A Gantt chart Master Project I 67
B Gantt chart Master Project II 68
C Data manipulator for in-control process (case 1) 69
D Data manipulator for offsetting tool (case 3) 72
E Inspection results based on loading error (case 2) for magnitud 1=1.5 & magnitud 2=0
75
F Inspection results based on offsetting tool (case 3) for magnitud 1=0 & magnitud 2=1.5
77
G Inspection results based on pneumatic problem (case 4) for magnitud 1=1.5 & magnitud 2=1
CHAPTER 1
INTRODUCTION
1.1 Research Background
The manufacturing environment in which quality engineering is practiced is changing rapidly, with many companies facing higher demands with the introduction of new systems and new products. System transitions are becoming a more significant part of overall operations. Furthermore, there is increased pressure for quality engineering as well as other manufacturing activities to support the economic objectives and profitability of the firm. Quality engineers need more tools to cope with these changes and to meet the intense international competition .Quality control (QC) is a procedure or set of procedures intended to ensure that a manufactured product or performed service adheres to a defined set of quality criteria or meets the requirements of the client or customer. Poor quality due to process variation is known as a major issue in manufacturing processes. Manufacturing process may involve two or more correlated variables and an appropriate procedure is required to monitor these variables simultaneously. In manufacturing industries, when quality feature of a product involves two correlated variables (bivariate), an appropriate SPC (Statistical Process Control) charting scheme is necessary to monitor and diagnose these variables jointly. Specifically, process monitoring refers to the identification of process condition either in a statistically in control or out of control, whereas process diagnosis refers to the identification of the source variable(s) for out of control condition.
construct the chart are independent and identically normally distributed, although this need not be the case (Woodall (1987). The process is declared in-control as long as the points on the chart stay within the control limits. If a point falls outside those limits, an out-of-control situation is declared, and a search for an assignable cause is initiated.
1.2 Problem Statement
In manufacturing industries, process variation is known to be a major source of poor quality. As such, process monitoring and diagnosis is critical towards continuous quality improvement. This becomes more challenging when involving two or more correlated variables. Process monitoring refers to the identification of process status either it is running within a statistically in-control or out-of-control condition, whereas process diagnosis refers to the identification of the source variables of out-of-control process. The traditional statistical process control (SPC) charting schemes were known to be effective in monitoring aspect. Nevertheless, they are lack of diagnosis. In recent years, the artificial neural network (ANN) based pattern recognition schemes are mainly utilize either a generalized (single) model ANN pattern recognizer and/or raw data based input representation, which resulted in limited performance.
3
Figure 1.1: Critical features of quality that requires bivariate quality control (BQC)
1.3 Project Objectives
The objectives of this project are:-
(i) To investigate the effectiveness of an Integrated SPC-ANN pattern recognition scheme for monitoring and diagnosis manufacturing process variation. Integrated SPC-ANN is used as a processing tool to assess the feasibility of processing data to monitor and diagnose process variation in mean shifts.
(ii) To evaluate the performance of the scheme in actual manufacturing process application.
1.4 Project Scopes
This research proposal project scope is listed as below:
(i) The bivariate process variables are dependent to each other based on linear cross correlation (ρ).
(ii) The predictable patterns of process variation are limited to sudden shifts (upward shift).
(iii) Magnitudes of variation (sudden shifts) are limited within ± 3 standard deviations based on control limits of Shewhart control chart.
CHAPTER 2
LITERATURE REVIEW
This chapter provided the reviews of the concept of SPC control chart monitoring and diagnosis. It were also review the investigation and development of the integrated bivariate SPC-ANN schemes combined the traditional SPC chart(s) with an ANN model. The traditional SPC chart(s) role for monitoring the existence of unnatural variation in bivariate process, whereas an ANN model roles for diagnosing the sources of variation. In that case, an ANN model is utilized only when necessary, that is, when an out-of-control signal is triggered. Inversely, the other schemes such as novelty detector ANN consist of fully ANN or fully ML-based model for monitoring and diagnosing simultaneously. In that case, an ANN model is continuously utilized, that is, for triggering out-of-control signal and then, for identifying the sources of variation. In conclusion, explanation on why the Integrated Statistical Process Control (SPC) - ANN pattern recognition is use to improve manufacturing process variation was given.
2.1 Introduction
In the production HDD, the production process is carried out continuously. Therefore, at regular time intervals, samples of data will be taken to investigate the variation and validate the pattern recognition on the production of HDD.
of the greatest technological developments of the twentieth century because it is based on sound underlying principles, is easy to use, has significant impact, and can be applied to any process. Its seven major tools are the histogram or stem-and-leaf plot, the check sheet, the Pareto chart, the cause-and-effect diagram, the defect concentration diagram, the scatter diagram, and the control chart.
This chapter has three objectives. The first is to present the basic statistical control process (SPC) problem solving tools, called the magnificent seven, and to illustrate how these tools form a cohesive, practical framework for quality improvement. These tools form an important basic approach to both reducing variability and monitoring the performance of a process, and are widely used in both the analyze and control steps of DMAIC. The second objective is to describe the statistical basis of the Shewhart control chart. The reader will see how decisions about sample size, sampling interval, and placement of control limits affect the performance of a control chart. Other key concepts include the idea of rational subgroups, interpretation of control chart signals and patterns, and the average run length as a measure of control chart performance. The third objective is to discuss and illustrate some practical issues in the implementation of SPC.
2.2 Process Variation
In order to reduce variation in manufacturing processes consisting of several discrete stages it is often worthwhile to study the variation that is added at different stages, and whether that variation is transmitted downstream to subsequent stages. In particular, there may be certain stages where considerable variation originates, and other stages that filter out variation introduced upstream. Process variation is known to be a major source of poor quality (Zainal Abidin & Masood, 2012). Traditionally, statistical process control (SPC) was used to monitor and identify process variation. Advances, variation reduction efforts as such process monitoring and diagnosis should be critically applied towards quality improvements (Masood & Hassan, 2009).
7
common sources of variation in manufacturing process. To manage and reduce variation, the variation must be traced back to its source. Variation occurs in all natural and man-made processes. If variation cannot be measured, it is only because the measurement systems are of insufficient precision and accuracy. Process variance reduces the capacity of the industries because processes become either under- or over-utilized. Process variance reduces the ability to detect potential problems and increases the difficulty of discovering the root cause of problems.
In any production process, regardless of how well designed or carefully maintained it is, a certain amount of inherent or natural variability will always exist. This natural variability or “background noise” is the cumulative effect of many small, essentially unavoidable causes. In the framework of statistical quality control, this natural variability is often called a “stable system of chance causes.” A process that is operating with only chance causes of variation present is said to be in statistical control. In other words, the chance causes are an inherent part of the process. Other kinds of variability may occasionally be present in the output of a process. This variability in key quality characteristics usually arises from three sources: improperly adjusted or controlled machines, operator errors, or defective raw material. Such variability is generally large when compared to the background noise, and it usually represents an unacceptable level of process performance. We refer to these sources of variability that are not part of the chance cause pattern as assignable causes of variation. A process that is operating in the presence of assignable causes is said to be an out-of-control process.
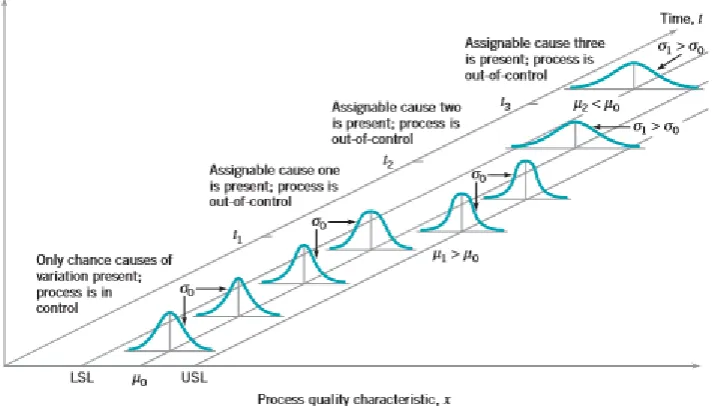
These chance and assignable causes of variation are illustrated in Fig. 2.1. Until time t1 the process shown in this figure is in control; that is, only chance
causes of variation are present. As a result, both the mean and standard deviation of the process are at their in-control values (say, µ0 and σ0). At time t1 an assignable
cause occurs. As shown in Fig. 2.1, the effect of this assignable cause is to shift the process mean to a new value µ1 > µ0. At time t2 another assignable cause occurs,
resulting in µ = µ0, but now the process standard deviation has shifted to a larger
value σ1 > σ0. At time t3 there is another assignable cause present, resulting in both
the process mean and standard deviation taking on out-of-control values. From time t1 forward, the presence of assignable causes has resulted in an out-of-control
periods of time. However, no process is truly stable forever, and, eventually, assignable causes will occur, seemingly at random, resulting in a shift to an out-of-control state where a larger proportion of the process output does not conform to requirements. For example, note from Fig. 2.1 that when the process is in control, most of the production will fall between the lower and upper specification limits (LSL and USL, respectively). When the process is out of control, a higher proportion of the process lies outside of these specifications.
Figure 2.1: Chance and assignable causes of variation (Montgomery,Douglas, C, 2009).
9
2.3 Statistical Process Control (SPC)
Statistical process control (SPC) is one of the most effective tools quality management (TQM), which is used to monitor and minimize process variations. Control charts are the most widely applied SPC tools used to reveal abnormal variations of monitored measurements. Common causes are considered to be due to the inherent nature of normal process. Assignable causes are defined as abnormal shock to the processes, which should be identified and eliminated as soon as possible. When an abnormal variation is signaled by control chart, quality practitioners or engineers search for the assignable causes and take some necessary correction and adjustments to bring the out-of-control process back to the normal state. In many quality control settings, the manufacturing process may have two or more correlated quality characteristics and an appropriate approach is needed to monitor all these characteristics simultaneously. The usual practice has been to maintain a separate chart for each characteristic. However, this could result in some fault out-of-control alarms when the characteristics are highly correlated.
[image:20.595.137.543.533.702.2]SPC is a technique used in a manufacturing environment to ensure quality parts are produced. Montgomery (2013) highlighted statistical process control is one of the most effective tools of total quality management whose main function is to monitor and minimize process variations. There are many ways to implement process control. Key monitoring and investigating tools included are illustrates in Fig. 2.2.
A control chart is the primary tool of SPC and is basically used to monitor the process characteristics, e.g., the process mean and process variability Montgomery, 2013). The most common types of variable control charts for variables include: (1) Average and Range (X bar and R) Charts (2) Average and Standard Deviation (X and S) Charts (3) Individual and Moving Range (X and MR) Charts. Among applied tools, Shewhart control chart are the most widely applied SPC tools used to reveal abnormal variations of monitored measurements (Yu & Xi, 2009). The uses of control charts are to plot measurements of part dimensions being produced. These charts are used to alert the operator to shifts in the mean of the measurement.
11
Figure 2.3: Nine control chart patterns (Montgomery,Douglas, C, 2009).
2.4 Shewhart Control Charts
Control charts, also known as Shewhart charts (after Walter A. Shewhart) or process-behavior charts, in statistical process control are tools used to determine if a manufacturing or business process is in a state of statistical control. If analysis of the control chart indicates that the process is currently under control (i.e., is stable, with variation only coming from sources common to the process), then no corrections or changes to process control parameters are needed or desired. In addition, data from the process can be used to predict the future performance of the process. If the chart indicates that the monitored process is not in control, analysis of the chart can help determine the sources of variation, as this will result in degraded process performance(Haridy, S., Wu, Z. (2009)). A process that is stable but operating outside of desired (specification) limits (e.g., scrap rates may be in statistical control but above desired limits) needs to be improved through a deliberate effort to understand the causes of current performance and fundamentally improve the process (Wen & Dwayne 1994).
The control chart is one of the seven basic tools of quality control (Haykin, 1999). Typically control charts are used for time-series data, though they can be used for data that have logical comparability (i.e. you want to compare samples that were taken all at the same time, or the performance of different individuals), however the type of chart used to do this requires consideration (Montgomery,Douglas, C, 2009).
A control chart is a graphical and analytic tool for monitoring process
variation. The natural variation in a process can be quantified using a set of control
limits. Control limits help distinguish common-cause variation from special-cause
variation. Typically, action is taken to eliminate special-cause variation and bring
the process back in control. It is also important to quantify the common-cause
variation in a process, as this determines process capability.
The Control Chart platform provides a variety of control charts, as well as
run charts. To support process improvement initiatives, most of the control chart
options display separate control charts for different phases of a project on the same
13
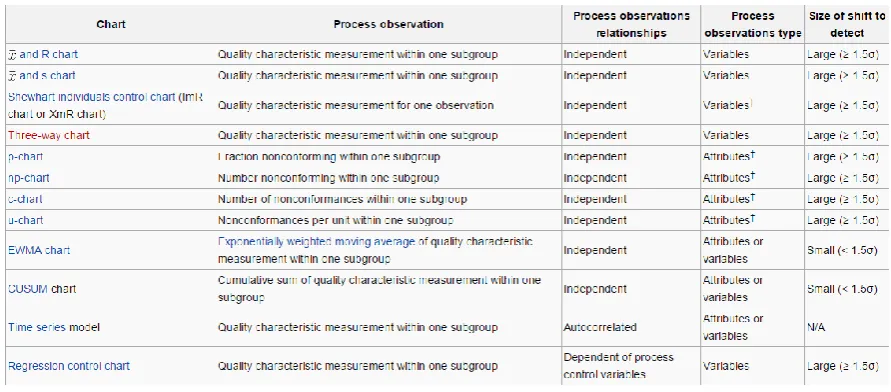
Table 2.1: Types of charts(Montgomery,Douglas, C 2009).
*Some practitioners also recommend the use of Individuals charts for attribute data,
particularly when the assumptions of either binomially distributed data (p- and np-charts) or Poisson-distributed data (u- and c-np-charts) are violated (Wen & Dwayne 1994). Two primary justifications are given for this practice. First, normality is not necessary for statistical control, so the Individuals chart may be used with non-normal data (Haykin, 1999). Second, attribute charts derive the measure of dispersion directly from the mean proportion (by assuming a probability distribution), while Individuals charts derive the measure of dispersion from the data, independent of the mean, making Individuals charts more robust than attributes charts to violations of the assumptions about the distribution of the underlying population (Wen & Dwayne 1994). It is sometimes noted that the substitution of the Individuals chart works best for large counts, when the binomial and Poisson distributions approximate a normal distribution. i.e. when the number of trials n > 1000 for p- and np-charts or λ > 500 for u- and c-charts.
Figure 2.4: Shewhart Charts(Montgomery,Douglas, C 2009).
A control chart contains a center line, an upper control limit and a lower control limit. A point that plots within the control limits indicates the process is in control. In this condition no action is necessary. A point that plots outside the control limits is evidence that the process is out of control. In this condition, investigation and corrective action are required to find and eliminate assignable cause(s) (Umit and Cigdem, 2001). Let w be a sample statistic that measure some quality characteristic of interest and suppose that the mean of w is µw and the standard deviation of w is σw. Then the center line, upper control limit and lower control limit as shows in equation (2.1).
UCL = µw + Lσw
Center Line = µw (2.1)
UCL = µw –Lσw
2.5 Control Limits
15 Therefore, the statistical Type I error α (Rejecting the null hypothesis H0 when it is
true) applied in Shewhart control chart means the process is concluded as out-of control when it is truly in-control. Same analog, the statistical Type II error β (failing to reject the null hypothesis when it is false) means the process is concluded as in-control when it is truly false.
2.6 Average Run Length
The performance of control charts can also be characterized by their average run length. Average run length is the average number of points that must be plotted before a point indicates an out-of-control condition (Montgomery, 1985). We can calculate the average run length for any Shewhart control chart according to:
(2.2) Where P or Type I error is the probability that an out-of-control event occurs. Hence, a control chart with 3 sigma control limits, the average run length will be
(2.3) This means that if the process remains in-control, in average, there will be one false alarm every 370 samples.
2.7 Pattern Recognition in SPC
Pattern recognition is the science of making inferences from perceptual data, using tools from statistics, probability, computational geometry, machine learning, signal processing, and algorithm design (Masood & Hassan, 2010). The techniques of pattern recognition have been successfully used in many areas such as applications in engineering, science, medicine, and business. In particular, advances made during the last half century, now allow computers to interact more effectively with humans and the natural world examples such as speech recognition, word recognition and finger print identification (Wen & Dwayne 1994).
The effectiveness of the use of SPC control charts depends largely on recognizing out-of control conditions in terms of patterns . Guh & Tannock (1999) stated, pattern recognition is an important issue in SPC, as unnatural patterns
P
ARL 1
370 027 . 0
1
1
exhibited by control charts can be associated with specific assignable causes adversely affecting the process. Traditional Shewhart control charts signal only a simple decision, such as within or outside the control limits, based on the most recent observation (Wen & Dwayne, 1994). Control chart pattern recognition (CCPR) has become an active area of research since late 1980s (Masood & Hassan, 2010). Today, control chart pattern recognition has become an active area of research. Zorriassatine, Tannock & O’Brian (2003) provided a useful review on the application for CCPR. However, it is still limited research and updated review on ANN-based CCPR schemes.
There were several pattern recognition approaches done by several researchers. Swift (1987), done a research on SPC control chart pattern recognition using a dichotomous decision tree approach. Swift & Mize (1995) and Cheng (1995), used of expert systems. Expert system also known as rule-based that contain information explicitly. If required, the rules can be modified and updated easily. While the performance of this system was promising, it was reported that the template-matching is currently computationally too expensive to implement in a real-time application scheme (Cheng, 1997).
2.8 Artificial Neural Network in Pattern Recognition
Traditionally, statistical process control (SPC) was used only for monitoring and identifying process variation. Advances in SPC charting have moved from merely statistical and economic control to diagnosis purposes through control chart pattern identification. The development in soft computing technology such as artificial intelligence (AI) has encouraged investigation on the application of expert systems, artificial neural network (ANN) and fuzzy sets theory for automated recognition of control chart patterns (CCPs). Application of ANN-based models, among others, has realized the computerized decision making in SPC towards replacing human interpretation. The modernization of the SPC schemes is ultimately aims to diagnose the source of variation with minimum human intervention (Masood & Hassan, 2009).
17
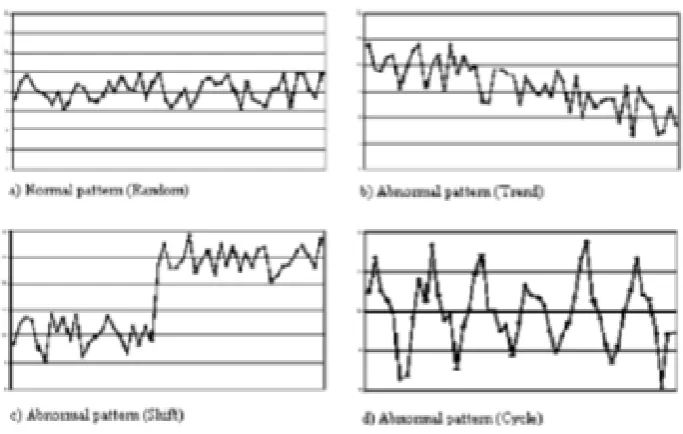
Figure 2.5: Typical normal and abnormal patterns (El-Midany et al, 2010)
El-Midany et al (2010) documented, two approaches in applying ANNs to control charts analysis, they are generally:
(i) Uses of ANN to detect deviation in mean and/or variance.
(ii) Uses of ANN to identify abnormal patterns using trained recognizer.
Since late 1980s, control chart pattern recognition (CCPR) has become an active area of research. A useful review on the application of ANN for CCPR was provided by (Zorriassatine & Tannock, 1998). Since then much progress has been made in which the performance of ANN-based CCPR schemes have been enhanced through feature-based and wavelet-denoise input representation techniques, modular and integrated recognizer designs, and multivariate process monitoring and diagnosis. However, there is a lack of updated critical review on such issues.
previously encountered. ANN offers useful properties and capabilities such as non-linearity, input and output mapping, adaptability and fault tolerance, among others. These attributes are needed for recognizing and classifying data which are often contaminated with noise, unknown distribution and incomplete as found in CCPs (Schalkoff, 1997; Haykin, 1999).
CHAPTER 3
METHODOLOGY
3.1 Introduction
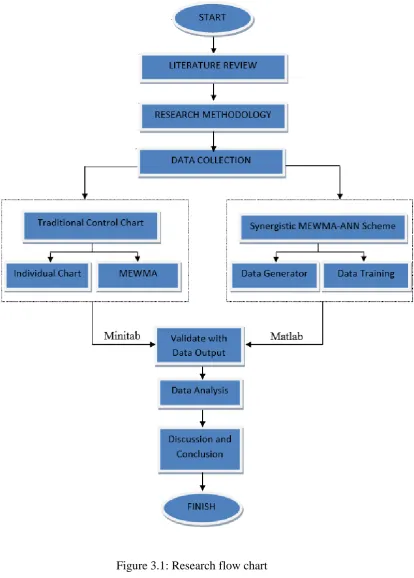
Methodology is very important to determine the direction, guidelines and methods in performing the project. This chapter explains the working procedures to complete the whole project. Methodology also indicates the procedural steps that need to be follow to ensure that the project will be completed on time. All procedures and methods have been listed down to give a guideline on project progress and to ensure the project completed as planned. All the activities were listed on the Gantt chart as shown in Figure A.1 (in Appendix A). Figure 3.1 illustrated the explanation on the methodologies in integrated-ANN scheme in monitoring and diagnosis of bivariate process variation in mean shifts.
In this research, two-stage monitoring scheme for improving the balanced monitoring and accurate diagnosis was investigated by Integrated SPC-ANN. Framework for the proposed scheme are summarized in Figure 3.2.
3.2 Project Methodology
Overview of project methodology for this research are showed as below:-
3.2.1 Research Overview
(i) Understand the concept and the application of SPC.
3.2.2 Data Generator
To generate the data for ANN Trainer by using a scheme based on the input representation of the simulation data for training and testing validation testing.
3.2.3 ANN Trainer
Setup and run ANN trainer to train:- (i) Features-Based ANN recognizer. (ii) Raw Data-Based ANN recognizer.
(iii) Raw data and improved set of statistical features were applied separately into training for improving pattern discrimination capability.
(iv) Run until achieve the targets that have been set so as to be the scheme in a well-trained and record the data from.
3.2.4 Control Chart
Bivariate : (i) MEWMA; (ii) Synergistic MEWMA-ANN scheme
3.2.5 Expected Results
(i) Select bivariate variables with low, moderate & high correlation. (ii) Interpret scatter plot diagram pattern.
(iii) Performance investigation of control charts in term of monitoring and diagnosis by using Integrated SPC – ANN.
21
[image:32.595.130.545.123.702.2]The research methodology flow chart of research that was carried out throughout a year is demonstrates in Fig. 3.1 below.
3.3 An integrated MEWMA-ANN scheme
[image:33.595.124.537.323.475.2]An integrated MEWMA-ANN scheme was develop based on two-stages monitoring and diagnosis approach as shown in Figure 3.2. Process monitoring refers to the identification of process status either in a statistically stable or unstable state, whereas process diagnosis refers to the identification of the source variables of an unstable process. In the first stage monitoring, the MEWMA control chart is used for triggering mean shifts based on ‘one point out-of-control’. Once the mean shift is triggered, the Synergistic-ANN recognizer is then used to perform second stage monitoring and diagnosis by recognizing data stream pattern contained points out-of-control as truly unstable or not.
Figure 3.2: Conceptual diagram of an Integrated MEWMA-ANN scheme (Masood, 2014)
3.4 Modeling of Process Pattern
23
Consider a bivariate correlated process. Let X1i = (X1-1,….,X1-24) and X2i = (X 2-1,….,X2-24) represent data streams for process variable process 1 and variable process
2 based on observation window of 24 samples. Observation windows for both variables start with samples ith = (1,…24). Then, it is followed with (ith + 1), (ith + 2),…., and so on.
The occurrence of assignable causes over X1i and/or X2i can be identified by
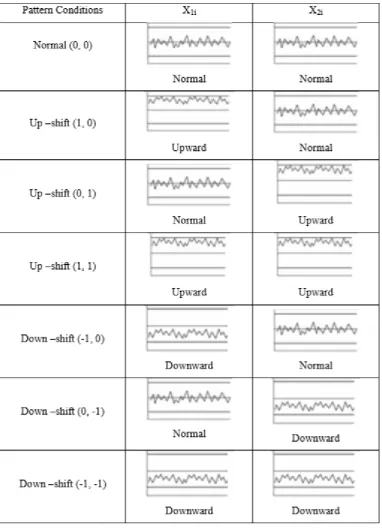
common causable pattern such as sudden shifts, trends, cyclic, systematic and mixture. It involves seven possible conditions for multivariate process mean shifts with positive cross correlation (ρ) as followed:-
Normal (0, 0); Both X1i and X2i are stable
Up –shift (1, 0); X1i in upward shift and X2i remain stable Up –shift (0, 1); X2i in upward shift and X1i remain stable Up –shift (1, 1); Both X1i and X2i in upward shift
Seven possible conditions of multivariate process mean shifts with positive cross correlation (ρ) were involved in this project as summarized in Table 3.1.
REFERENCES
Brunzell, H., & Eriksson, J. (2000). Feature reduction for classification of multi dimensional data. Pattern Recognition, 33(12), 1741–1748.
Chen, L.H. & Wang, T.Y. (2004). Artificial Neural Networks to Classify Mean Shifts from Multivariate X2 Chart Signals. Computers & Industrial Engineering. 47(2004), pp. 195-205.
Chen, Z., Lu, S., Lam, S. (2007). A Hybrid System for SPC Concurrent Pattern Recognition. Advanced Engineering Informatics. 21(2007), pp. 303-310.
Champ, C.W. and Woodall, W.H., “Exact result for Shewhart control chart with supplementary runs rules”, Technometrics, Vol. 29 No. 4, pp. 393-9, November 1987.
Cheng CS (1995) A multi-layer neural network model for detecting changes in the process mean. Comput IND Eng 28:51-61.
Cheng, C.S., 1997. A neural network approach for the analysis of control chart patterns. International Journal of Production Research 35, 667–697.
Cheng, H.P., Cheng, C.S. (2009). Control Chart Pattern Recognition Using Wavelet Analysis and Neural Networks. Journal of Quality, 16(25), 311-321.
Electric W, (1958). Statistical Quality Control handbook. Western Electric Company, I ndianapolis.
Haykin S (1999) Neural networks: a comprehensive foundation. Prentice Hall, New Jersey.
Haridy, S., Wu, Z. (2009). Univariate and Multivariate Control Charts for Monitoring Dynamic-Behavior Process: A Case Study. Journal of Industrial Engineering and Management, 2(3).pp. 464-498.
Hassan, A., Shariff Nabi Baksh, M., Shaharoun, A.M., Jamaluddin, H. (1998). Improved SPC Chart Pattern Recognition Using Statistical Features. International Journal of Production Research, 41(7).pp. 1587-1603.
Guh RS, Tannock JDT, O’Brien C (1999) Intellispc: a hybrid intelligence tool for on-line economical statistical process control. Expert Syst Appl 17:195-212.
Hwarng, H.B.(2008). Toward Identifying The Source of Mean Shifts in Multivariate SPC: A Neural Network Approach. International Journal of Production Research. 46(20), pp. 5531-5559.
Klosgen, W., & Zytkow, J. M. (2002). Handbook of data mining and knowledge discovery. London: Oxford University Press.
Kourti, T., & MacGregor, J. F. (1996). Multivariate SPC methods for process and product monitoring. Journal of Quality Technology, 28(4), 409–428.
Lucas, J. M., & Saccucci, M. S. (1990). Exponentially weighted moving average control schemes: Properties and enhancements. Technometrics, 32(1), 1–12.
Masood, I. & Hassan, A. (2009). Synergistic-ANN Recognizers for Monitoring and Diagnosis of Multivariate Process Shift Patterns. International Journal of Soft Computing and Pattern Recognition, 2 (9), pp. 336-355.
Masood, I. & Hassan, A. (2010). Improved Recognition of Multivariate Process Mean Shift Patterns Using Synergistic-ANN Recognizer. The 11th Asia Pacific Industrial Engineering and Management Systems Conference.7-10 December
64
Masood, I. & Hassan, A. (2010). Issues in Development of Artificial Neural Network-Based Control Chart Pattern Recognition Schemes. European Journal of Scientific Research, 39(3), pp. 336-355.
Masood, I. & Hassan, A. (2012). Pattern Recognition for Bivariate Process Mean Shifts Using Feature-Based Artificial Neural Network. The International Journal of Advanced Manufacturing Technology, 24(9&10).
Masood, I. & Hassan, A. (2013). A Framework for Multivariate Process Monitoring and Diagnosis. Applied Mechanics and Materials, 315(2013), pp. 374-379.
Masood, I. & Hassan, A. (2013). Multivariate Process Monitoring and Diagnosis: A Case Study. Applied Mechanics and Materials, 315(2013), pp. 606-611.
Masood, I. & Hassan, A. (2014). Journal of Bivariate quality control using two-stage intelligent monitoring scheme. 41 (2014) 7579-7595.
Montgomery, D.C (2005) Introduction to Statistical Quality Control. Wiley, New Jersey. Montgomery, D.C (2009). Introduction to Statistical Quality Control. 6th ed. USA. John
Wiley & Sons, Inc. New Jersey.
Montgomery, D.C. (2013). Statistical Quality Control – A Modern Introduction. 7th ed. USA. John Wiley & Sons, Inc. New Jersey.
Montgomery, D.C., Introduction to Statistical Quality Control, John Wiley & Sons, New York, NY, 1985.
Oguz, H., Saritas, I., Badyan, H.E, (2010). Prediction of Diesel Engine Performance Using Biodeiesel with Artifical Neural Network. 37, 6579–6586.
Lowry, C. A., & Montgomery, D. C. (1995). A review of multivariate control charts. IIE Transactions, 27(6), 800–810.
Page, E.S., “Continuous Inspection Schemes”, Biometrika, Vol. 41, 1954, pp. 100-14. Roberts, S.W., “Control Charts Tests Based on Geometric Moving Averages”,
Schalkoff, R.J., 1997. “Artificial neural networks”, McGraw-Hill, New York.
Swift, J. A., & Mize, J. H. (1995). Out-of-control pattern recognition and analysis for quality control charts using LISP-based systems. Computers and Industrial Engineering, 28(1), 81–91.
Swift, J.A. (1987). Development of A Knowledge Based Expert System for Control Chart Pattern Recognition and Analysis, unpublished doctoral dissertation, The Oklahoma State University.
Umit, F. & Cigdem, A. (2001), Multivariate Quality Control: A Historical Perspective pp. 54-65.
Wen, H.C. & Dwayne, A.R. (1994). A Methodology of Pattern Recognition Schemes for Two Variables in SPC.International Journal of Quality & Reliability Management. 12(3), pp. 86-107.
Yu, J.B. & Xi, L.F. (2009). Artificial Neural Networks to Classify Mean Shifts from Multivariate X2 Chart Signals. Expert System with Applications. 36(2009), pp. 909-9221.
Zainal Abidin, N.Z. & Masood, I. (2012). Design of an Artificial Neural Network Pattern Recognition Scheme Using Full Factorial Experiment. Bachelor Degree’s Thesis, University Tun Hussein Onn Malaysia.
Zorriassatine F, Tannock JDT (1998) A review of neural networks for statistical process control. J Intell Manuf 9:209-224