A Monthly Double-Blind Peer Reviewed Refereed Open Access International e-Journal - Included in the International Serial Directories.
GE-International Journal of Engineering Research (GE-IJER) ISSN: (2321-1717)
31 | P a g e
GE-International Journal of Engineering Research
Vol. 4, Issue 1, Jan 2016 IF- 4.007 ISSN: (2321-1717) © Associated Asia Research Foundation (AARF) Publication
Website: www.aarf.asiaEmail : [email protected] , [email protected]
ROLE OF PRE-PROCESSING IN A CONCEPTUAL FRAMEWORK
FOR TOXICITY PREDICTION
Kavitha C.R1, Dr. Mahalekshmi T2
1
Research Scholar, R & D, Bharathiar University, Coimbatore, India
2
Principal, Sree Narayana Institute of Technology, Kollam, India
ABSTRACT
Performance and efficiency of algorithms are given much focus in any research,
based on data mining. The quality of input data is of great importance for these algorithms to
perform well. The input data can contain noise and errors which make the algorithms
useless. The input data has to be explored and pre-processed. Data pre-processing lays the
groundwork for data mining. Before the discovery of useful information/knowledge, the
target data set must be properly prepared. Unfortunately, pre-processing is being ignored by
most researchers in data mining due to its perceived difficulty. This paper outlines the
proposed conceptual data mining framework for toxicity prediction. Also in this paper, a
comparative study of the performance of the classification algorithms namely Jrip and J48,
using the complete and incomplete dataset to demonstrate the importance of missing value
imputation techniques of data pre-processing.
KEYWORDS –Classification, Classifier, Data Pre-Processing, Missing values, Toxicity
Prediction,
INTRODUCTION
Toxicity is an activity of chemicals that can cause harm to both human being and
animal. [1] During the past several years, it has been found that some chemicals can cause
severe adverse impacts like the deaths from methyl isocyanate exposure in Bhopal, India, or
A Monthly Double-Blind Peer Reviewed Refereed Open Access International e-Journal - Included in the International Serial Directories.
GE-International Journal of Engineering Research (GE-IJER) ISSN: (2321-1717)
32 | P a g e is the study of the qualitative and quantitative effects of chemicals on living systems. [2]
Several techniques such as Quantitative Structure-Activity Relationships (QSAR), in vitro
testing, in silico testing, etc. are employed in predicting the activity of drugs. [1] TOXCAST,
a project initiative of Environmental Protection Agency (EPA) [3] is also indulged in
investigating quick and reliable methods for predicting toxicity of compounds. Some
commercially available toxicity prediction programs are TOPKAT (toxicity-prediction by
computer assisted technology), DEREK (deductive estimation of risk from existing
knowledge), CSGenoTox, MetaDrug and HazardExpert. [4] Since these programs are
developed using a non-congeneric set of chemicals, they are classified as the "global" models.
[5]
Today data mining also plays an important role in predicting the adverse effects of
chemicals that lack experimental data in the pharmaceutical industry. Recent data mining
techniques are able to identify features that are relevant for toxicity in a comprehensive and
unbiased manner and use them for the identification of complex Structure-Activity
relationships. [6]
The toxicity datasets are available from different toxicity based chemical databases
[7]. These datasets may suffer from noise, missing values, duplication etc. So these dataset
must be preprocessed in order to consider it for further investigation. The main aim of this
paper is to develop a conceptual data mining framework for toxicity prediction and to
illustrate the importance of handling missing values through an experiment. A comparison of
how the missing values in the input dataset can affect the performance of the classifier is also
given in detail in this paper. The remaining paper is organized into 10 sections. Sect ion 2
explains the general process of data mining. The next section presents the conceptual
framework for toxicity prediction. The section 4 introduces the data pre-processing and the
different techniques used for handling missing values. The related work in handling missing
values are described in Section 5. Toxicity dataset has been discussed in section 6 which is
followed by experiment in Section 7 and the discussion is given in section 8. The conclusion
A Monthly Double-Blind Peer Reviewed Refereed Open Access International e-Journal - Included in the International Serial Directories.
GE-International Journal of Engineering Research (GE-IJER) ISSN: (2321-1717)
33 | P a g e
GENERAL PROCESS OF DATA MINING
The Data Mining [8] is the computer-aided extraction of useful information from datasets.
The aim of data mining is to automatically or semi-automatically discover hidden knowledge,
unexpected patterns and new rules from data.
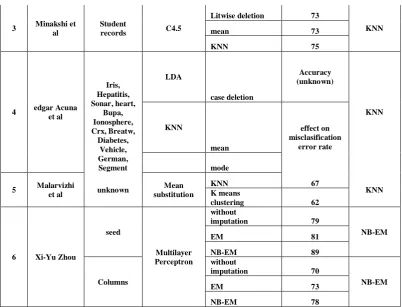
The data mining process involves different steps as shown in the figure 1. First step is to
define the goal after identifying the problem. The relevant data is collected based on this goal
from different sources. Then these data must be transformed into the standard form that is
acceptable to the techniques of data mining. These transformed data is analyzed by using
various data mining techniques and models are built iteratively to find the best solution to the
[image:3.595.110.484.269.431.2]defined problem. Finally, found solution is applied into practice and its effect is validated.
Figure 1 General Process of Data Mining
PROPOSED CONCEPTUAL FRAMEWORK
Data mining methods are used for extracting relationships between chemical structures (or
A Monthly Double-Blind Peer Reviewed Refereed Open Access International e-Journal - Included in the International Serial Directories.
GE-International Journal of Engineering Research (GE-IJER) ISSN: (2321-1717)
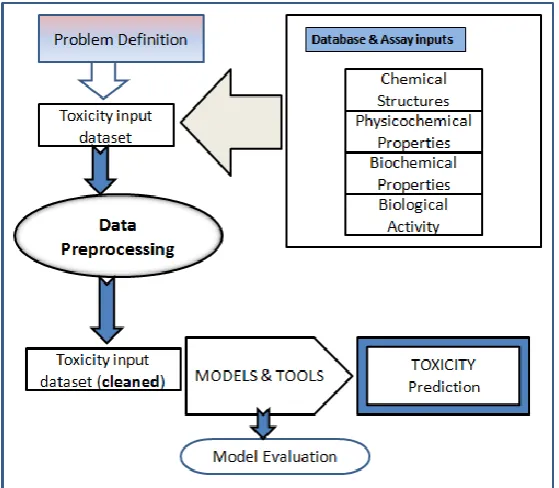
[image:4.595.158.438.39.283.2]34 | P a g e Figure 2 Conceptual Framework for Toxicity Prediction
Figure 2 depicts a generic data mining framework for toxicity prediction. The
conceptual framework includes databases, assays, models and tools that help to predict the
toxicity. Toxicity can be predicted on the basis of chemical structure, physicochemical
properties, biochemical properties, or biological activity. The toxicity input data is obtained
from the various cheminformatics data sources. Preprocessing of a dataset with a
well-defined toxicity endpoint is performed. Features that is relevant for toxicity prediction is
identified. Models are developed that detects the relationships between these features and
toxic activities. The predictive performance of the model is evaluated and interpreted.
The first step in the data mining process is problem definition. So the first step in this
framework is to define the problem i.e. to predict the toxicity of Aliphatic carboxylic acids.
To predict the toxicity, information about the targets and mechanisms of action related to
toxicity must be collected. After defining the problem, the next phase is data preparation.
Toxicity depends on some chemical properties and biological properties, which are collected
and used for the evaluation of toxicity. The collected data is then analyzed i.e. pre-processed
to make it suitable for further steps to be done. Classification models are developed and
applied to the pre-processed dataset in order to predict the toxicity target classes. Thus, the
decision making in the proposed framework involves four main steps like collection of
toxicity input dataset, setting toxicity target classes (high toxicity, Low toxicity),
A Monthly Double-Blind Peer Reviewed Refereed Open Access International e-Journal - Included in the International Serial Directories.
GE-International Journal of Engineering Research (GE-IJER) ISSN: (2321-1717)
35 | P a g e appropriate classes. Last step is the model validation which involves the evaluation of the
performance and accuracy of the models applied to the pre-processed toxicity dataset.
Quality decisions are based on the quality of the input dataset. The data containing
duplicate or missing data may cause incorrect or even misleading decisions. Data
pre-processing is an important step in the data mining process which can give many economic
benefits such as the pre-processed data can be used for taking business decisions, knowledge
discovered from this dataset can be used for many purposes and can earn huge payoffs by the
early detection of data anomalies and rectify them. This paper presents and illustrates the
importance of data pre-processing by conducting several experiments.
DATA PRE-PROCESSING
After the data is extracted from different sources, it is unrealistic to expect the data to
be perfect. Thorough cleansing of the data is required since good models usually need good
data. Data pre-processing is an important step to improve the quality of data mining methods.
The different process exist in the pre-processing stage are dimensionality reduction, feature
subset selection, removal of noise from the data and the missing values imputation. Missing
data can also be a particularly harmful problem. Especially when the dataset is small or the
number of missing fields is large, not all records with a missing field can be deleted from the
[image:5.595.164.468.481.643.2]dataset.
Figure 3 General Data pre-processing framework [8]
Data Preparation is critical for data mining, as real world data that is collected from
A Monthly Double-Blind Peer Reviewed Refereed Open Access International e-Journal - Included in the International Serial Directories.
GE-International Journal of Engineering Research (GE-IJER) ISSN: (2321-1717)
36 | P a g e amount of processing time. Figure 3 shows the general data pre-processing framework. Data
pre-processing includes data preparation compounded by data cleaning, data integration, data
transformation and data reduction. Data cleaning includes operations that correct bad data,
filter some incorrect data and reduce the unnecessary detail of data. [10] Data transformation
includes operations such as smoothing, aggregation, normalization, discretization and
generalization that convert the data. Data reduction refers to the set of techniques such as
feature selection, instance selection etc. are used to obtain a reduced representation of the
original data. The result obtained after the data pre-processing is a final dataset which is
[image:6.595.138.451.265.513.2]considered correct and useful for further data mining algorithms.
Figure 4 Forms of Data Preparation [10]
Data from the real world is never perfect. The problems for the improper and
incomplete data are described here:
(i) Missing attributes and missing attribute values
Each record in dataset may consist of several numeric and non-numeric attributes. Sometimes
within each record, a number of attributes may not have values.
(ii) Improper types (numeric/symbolic data)
For an efficient and meaningful data analysis, the parameter values in each field have to be of
the same type (numeric or non-numeric). Sometimes the attribute types may not be
A Monthly Double-Blind Peer Reviewed Refereed Open Access International e-Journal - Included in the International Serial Directories.
GE-International Journal of Engineering Research (GE-IJER) ISSN: (2321-1717)
37 | P a g e (iii) Out-of-range data
Out-of-range data refers to the impossible data combination. E.g. (Income=100), (Gender:
Male; Pregnant: Yes)
Most commonly used approaches are to calculate a substitute value for missing fields
such as the median or mean of a variable, clustering approaches, predict from model, learning
methods etc. In this research work, we have used Naïve Bayes model to predict the missing
values in the toxicity dataset because it is a popular classification technique based on
computing probabilities [11]. It is known for its good performance, its simple form, fast to
train, fast to classify, not sensitive to irrelevant features and very high efficiency of
calculation.
Naïve Bayes model is a prediction model which replaces missing values with
predicted values. [12] This model can be used for supervised data sets or unsupervised data
sets. In a supervised data set one of the attributes is designated as class attribute (target
attribute or dependent variable). An unsupervised data set has no class attribute. This model
requires nominal (categorical) attributes. Numeric attributes are automatically discretized into
a specified number of intervals.
In a supervised data set, missing values are computed differently in training data and
in test/execution data. In training data, missing values in an instance (a case) are predicted
from the observed values in that instance. Observed value of every attribute, including the
class attribute, is used to predict missing values in the remaining attributes. In testing data
where the values of the class attribute are assumed to be unknown, the observed values of the
class attribute are not used to predict missing values. In an unsupervised data set missing
values in training data are computed the same way as in testing data. All attributes can be
used to predict missing values.
RELATED WORK
Anjana Sharma et al. used three techniques such as lit wise deletion, K-NN
imputation and mean/mode imputation for handling missing values. [13]. R. Malaryizhi et al.
used K-NN classifier and K-means clustering in missing value imputation. [14]. Thomas et
al. proposed that an existing fuzzy rule induction algorithm can consolidate missing values in
the training method in a very common way without any need for artificial replacement of the
A Monthly Double-Blind Peer Reviewed Refereed Open Access International e-Journal - Included in the International Serial Directories.
GE-International Journal of Engineering Research (GE-IJER) ISSN: (2321-1717)
38 | P a g e missing value by making rules establish on background knowledge but still lose some usable
rules [16]. Mei Ling Shyu et al. designed a framework named F-DCS for replacing missing
value which obtains the basic concept of conditional probability approach. This framework
can manage both nominal and numeric values with a high degree of certainty when it is
distinguished with other techniques such as using minimum, average and maximum value
[17]. Olga et al. implemented three methods named a Singular Value Decomposition (SVD)
based method, weighted K-nearest neighbours (K-NN) and row average. K-NN and SVD
based methods provide quick and proper ways of measure missing values for microarray data,
though K-NN is better than SVD [18]. Alireza Farhangfar et al. used mean, hot deck, c4.5,
CLIP4 and Naive Bayes for replacing missing value [19]. Minakshi et al. used e lit wise
deletion, mean imputation, KNN imputation for imputing missing values [20]. Edgar et al.
implemented four methods such as the case deletion method, mean imputation, median
imputation and KNN imputation procedure for replacing missing values [21]. Xi-Yu et al.
implemented EM algorithm and Naive Bayesian to deal with missing values that improves
the accuracy of classification [22].
DATA SET
The data set used for the experiment is the toxicity data of aliphatic carboxylic acids
which was downloaded from “http://vincentarelbundock .github.io/Rdatasets/datasets.html”
[23]. The toxicity dataset which was downloaded did not contain any noise or missing value.
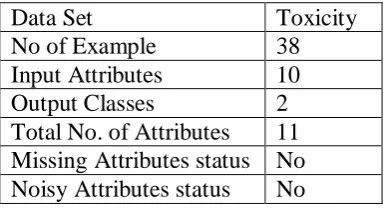
The characteristics of the data set are summarized in the Table 1. The aim of the data set was
to predict the toxicity of carboxylic acids on the basis of several molecular descriptors like
toxicity, logKow, pKa, ELUMO, Ecarb, Emet, RM, IR, Ts and P. The problem is to predict
whether the given aliphatic acid is toxic or not. This is a two-class problem with class
variable positive and negative. The data set contains 38 observations and 11 variables with no
missing values reported. There are eleven variables, including the class variable, in this data
set; all other attributes are numeric- valued. The attributes are given below:
1. Toxicity - defined as log(IGC50^(-1)); typically the “response”.
2. logKow - the partition coefficient
3. pKa- the dissociation constant
4. ELUMO- Energy of the lowest unoccupied molecular orbital
5. Ecarb - Electrotopological state of the carboxylic group
6. Emet- Electrotopological state of the methyl group
A Monthly Double-Blind Peer Reviewed Refereed Open Access International e-Journal - Included in the International Serial Directories.
GE-International Journal of Engineering Research (GE-IJER) ISSN: (2321-1717)
39 | P a g e 8. IR - Refraction index
9. Ts - Surface tension
10. P – Polarizability
[image:9.595.202.395.159.269.2]11. C – Class variable (positive or Negative)
Table 1 Characteristics of Toxicity data sets
Data Set Toxicity
No of Example 38
Input Attributes 10
Output Classes 2
Total No. of Attributes 11 Missing Attributes status No Noisy Attributes status No
EXPERIMENT
The main steps that were carried out in this experiment are given below:
1. The complete dataset (CD) is loaded into WEKA [24], a data mining tool and
classifiers such as J48 [25] and Jrip [26] were applied to this dataset. Then, the
performance of the classifiers are analysed based on the criteria such as correctly and
incorrectly classified instances, kappa statistics, Mean absolute error, root mean
squared error, relative absolute error and root relative squared error.
2. The dataset is made incomplete by deleting some of the values of the attributes of the
toxicity dataset. Now this dataset has some missing values and can be considered as
an incomplete dataset(ID)
3. The incomplete dataset (ID) is loaded into WEKA and the above said classifiers are
again applied. The performances of the classifiers are again evaluated.
4. The missing values are replaced with values predicted by Naïve Bayes model which is
a prediction model. This makes the incomplete dataset filled with values. This dataset
after handling missing values is referred to as the pre-processed dataset (PD).
5. The pre-processed dataset is loaded into WEKA and the same classifiers are applied
to the dataset. Again the performance of these classifiers is evaluated.
Table 2 shows the performance of the classifiers with the complete dataset (CD),
A Monthly Double-Blind Peer Reviewed Refereed Open Access International e-Journal - Included in the International Serial Directories.
GE-International Journal of Engineering Research (GE-IJER) ISSN: (2321-1717)
40 | P a g e Table2. Performance evaluation of classifiers before and after pre- processing
The Confusion Matrix can also be used for analyzing how well the classifier can
recognize tuples of different classes.
Figure 6 Confusion matrix [27]
True Positive (TP) is the positive tuples that were correctly labeled by the classifier
[28]. True Negative (TN) is the negative tuples that were correctly labeled by the classifier
[28]. False Positive (FP) is the negative tuples that were incorrectly labeled as positive [28].
False Negative (z) is the positive tuples that were mislabeled as negative [28]. Accuracy is
the probability that the test yields correct results. Accuracy is calculated as = (TP+TN)/(P+N)
A Monthly Double-Blind Peer Reviewed Refereed Open Access International e-Journal - Included in the International Serial Directories.
GE-International Journal of Engineering Research (GE-IJER) ISSN: (2321-1717)
41 | P a g e DISCUSSION
Classification on the complete dataset (CD), classification on the incomplete dataset
(ID) and classification on pre-processed dataset (PD) were conducted. A comparison was
made on the results of the experiment. Based on the confusion matrix comparison, it was
found that the accuracy of the prediction with the dataset containing missing values has
decreased from 98% to 85%. But after pre-processing is performed, accuracy has increased to
94%.
The Kappa statistics value for the incomplete dataset is low when compared with the
pre-processed dataset and the complete dataset. If the Kappa statistic value is = or > 0.7, then
it is considered as a good statistical correlation. The correlation is found to be better if the
Kappa statistic value is high. Therefore the complete dataset and the pre-processed dataset
have a better correlation.
When the results of the experiment were analyzed based on the errors, it is found that
the rate of error has increased for the incomplete dataset (ID). Relative absolute error value is
also better after pre-processing the dataset.
When analysing the other parameter also, it is observed that the pre-processed dataset
showed better results than dataset with the missing values.
It is concluded that the presence of missing value in the dataset surely affects the
performance of the classifier. Therefore it is important to handle the missing values before
applying the data mining techniques.
A Monthly Double-Blind Peer Reviewed Refereed Open Access International e-Journal - Included in the International Serial Directories.
GE-International Journal of Engineering Research (GE-IJER) ISSN: (2321-1717)
42 | P a g e From the table 2 and table 3, the performance of the classifier J48 is better than the
classifier Jrip. From the graph as shown in the figure 7, it is true that pre-processing surely
improves the performance of the classifiers.
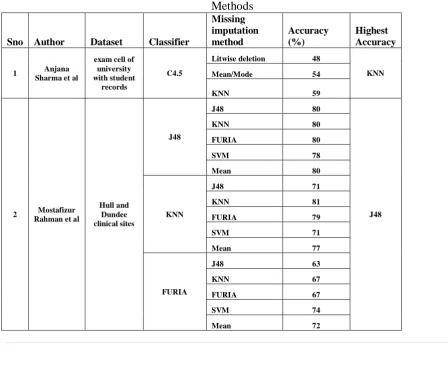
Finally a comparison between this work and other research works were also
conducted. Anjana Sharma et al. in their work used three imputation techniques like litwise
deletion, Mean/Mode imputation and KNN and they used C4.5 classifier. KNN showed
highest accuracy (59%) than Lit wise deletion (48%) and Mean/Mode imputation (54%).
Malarvizhi et al. in their work had used KNN, K means clutering and Mean substitution
imputation methods and found that KNN howed 67% accuracy than Kmeans clutering(62%)
and Means substitution(60%). Alireza Farhangfar et al. in their work had used mean,hot deck,
c4.5, CLIP4 and Naive bayes imputation and performed an evaluation and found that C4.5
has the highest accuracy followed by the Naive Bayes. Through this comparative study, it is
found that Naive Bayes model is one of the best imputation technique for handling missing
[image:12.595.65.514.396.764.2]values.
Table 4 Comparison based on related works of Missing Imputation Methods
Sno Author Dataset Classifier
Missing imputation method Accuracy (%) Highest Accuracy
1 Anjana Sharma et al
exam cell of university with student
records
C4.5
Litwise deletion 48
KNN Mean/Mode 54
KNN 59
2 Mostafizur Rahman et al
Hull and Dundee clinical sites
J48
J48 80
J48 KNN 80
FURIA 80 SVM 78 Mean 80
KNN
J48 71 KNN 81 FURIA 79 SVM 71 Mean 77
FURIA
A Monthly Double-Blind Peer Reviewed Refereed Open Access International e-Journal - Included in the International Serial Directories.
GE-International Journal of Engineering Research (GE-IJER) ISSN: (2321-1717)
43 | P a g e
3 Minakshi et al
Student
records C4.5
Litwise deletion 73
KNN mean 73
KNN 75
4 edgar Acuna et al Iris, Hepatitis, Sonar, heart, Bupa, Ionosphere, Crx, Breatw, Diabetes, Vehicle, German, Segment LDA case deletion Accuracy (unknown) KNN KNN mean effect on misclasification error rate mode
5 Malarvizhi
et al unknown
Mean substitution
KNN 67
KNN K means
clustering 62
6 Xi-Yu Zhou
seed
Multilayer Perceptron
without
imputation 79
NB-EM
EM 81
NB-EM 89
Columns
without
imputation 70
NB-EM
EM 73
[image:13.595.66.469.31.338.2]NB-EM 78
Table 5 Results of the experiment using preprocessed dataset
CONCLUSION
In this work, we have proposed a conceptual data mining framework which would be
helpful for toxicity prediction. The prediction of toxicity of chemical compounds is a major
challenge in the pharmaceutical industry. We understand that data mining techniques proves
to be good for predicting the toxicity of chemicals from several researches. But the presence
of noise and missing values in the dataset will affect the accuracy of prediction, which is
proved by the experiment done in this research work. By this study we can understand that
pre-processing helps to remove the noise and missing values. This would help to improve the
accuracy of the prediction and will improve the performance of the classifier. It is observed
A Monthly Double-Blind Peer Reviewed Refereed Open Access International e-Journal - Included in the International Serial Directories.
GE-International Journal of Engineering Research (GE-IJER) ISSN: (2321-1717)
44 | P a g e The future scope of the research will be in developing a hybrid preprocessing
algorithm and feature selection which would further improves the prediction accuracy.
REFERENCES
1 Meenakshi Mishra, Hongliang Fei and Jun Huan, „Computational prediction of
toxicity’, Int. J. Data Mining and Bioinformatics, Vol. 8, No. 3, 2013
2 „Toxicology‟, LAB Notes Toxicology, © 2000 MSMR, Inc. Available at http://
www.msmr.org /LAB_Notes_Toxicology.pdf accessed on 2/10/15
3 „TOXCAST‟, Available at
http://www2.epa.gov/chemical-research/toxicity-forecasting referred on 4/10/15
4 Ekins, S.: Computational Toxicology: Risk Assessment for Pharmaceutical and
Environmental Chemicals (Wiley Series on Technologies for the Pharmaceutical
Industry). Wiley-Interscience (2007)
5 White, A., Mueller, R., Gallavan, R., Aaron, S., Wilson, A.: A multiple in silico
program approach for the prediction of mutagenicity from chemical structure.
Mutation Research/Genetic Toxicology and Environmental Mutagenesis 539 (2003)
77{89(13)
6 Data Mining for Toxicity Prediction, Chapter 5, Artificial Intelligence and Data
Mining for Toxicity Prediction, Available at
https://openaccess.leidenuniv.nl/bitstream/handle/1887/ 12954/ Chapter% 205.pdf?
sequence=8 accessed on 6/10/2004
7 Kavitha C.R , Dr. Mahalakshmi T, „Chemical Databases: A Brief Walk’, International
Journal of Emerging Technology and Advanced Engineering, , Volume 3, Issue 8,
August 2013, http://www.ijetae.com/files/Volume3Issue8/IJETAE_0813_68.pdf
8 Jiawei Han, Micheline Kamber, Jian Pei”, Data Mining: Concepts and Techniques”,
third edition, Morgan Kauffman Publishers.
9 Data preprocessing techniques for data mining, Available at
http://iasri.res.in/ebook/win_school_aa/notes/Data_Preprocessing.pdf accessed on
7/11/2015
10 Salvador Garcia, Julian Luengo, Francisco Lerrera, „Data Preprocessing in data
A Monthly Double-Blind Peer Reviewed Refereed Open Access International e-Journal - Included in the International Serial Directories.
GE-International Journal of Engineering Research (GE-IJER) ISSN: (2321-1717)
45 | P a g e 11 M. Mostafizur Rahman and Darryl N. Davis, „Machine Learning Based Missing
Value Imputation Method for Clinical Dataset‟, IAENG transactions on engineering
technologies, springer Netherlands, 245-247
12 K. Ming Leung, „Naive Bayesian Classifier’, Available at
http://cis.poly.edu/~mleung/FRE7851/f07/naiveBayesianClassifier.pdf accessed on
5/10/15
13 Anjana Sharma, Naina Mehta, Iti Sharma, ” Reasoning with Missing Values in Multi
Attribute Datasets” ,International Journal of Advanced Research in Computer Science
and Software Engineering, Volume 3, Issue 5, May 2013 .
14 R. Malarvizhi, A. Thanamani,” K-NN Classifier Performs Better Than K-Means
Clustering in Missing Value Imputation”, IOSR Journal of Computer Engineering
(IOSRJCE), vol. 6, pp. 12-15, Nov. - Dec. 2012.
15 Thomas R. Gabriel and Michael R. Berthold, “Missing Values in Fuzzy Rule
Induction”, Systems, Man and Cybernetics, 2005 IEEE International Conference on
(Volume: 2).
16 S. McClean, B. Scotney and M. Shapcott, “Using Background Knowledge with
Attribute-Oriented Data Mining” Knowledge Discovery and Data mining (Digest no,
1998/310), IEE colloquiumon, 1998, pp. 1/1-1/4.
17 M. Shyu, I. P. Appuhamilage, S. Chen and L. Chang, “Handling Missing Values via
Decomposition of the Conditioned Set”, IEEE Systems, Man, and cybernetics society,
pp. 199-204, 2005.
18 Olga Troyanskaya, Michael Cantor, Gavin Sherlock, Pat Brown, Trevor Hastie,
Robert Tibshirani, David Botstein and Russ B. Altman, “Missing value estimation
methods for DNA microarrays”, Bioinformatics (2001) 17 (6): 520-525.
19 Alireza Farhangfar , Lukasz Kurgan , Witold Pedrycz, Experimental analysis of
methods for imputation of missing values in databases
20 Minakshi, Dr. Rajan Vohra, Gimpy, “Missing Value Imputation in Multi Attribute
Data Set”, (IJCSIT) International Journal of Computer Science and Information
Technologies, Vol. 5 (4) , 2014, 5315-532, ISSN:0975-9646
21 Edgar Acuna and Caroline Rodriguez, “The treatment of missing values and its effect
in the classifier accuracy”, Classification, Clustering, and Data Mining Applications,
Part of the series Studies in Classification, Data Analysis, and Knowledge
Organisation pp 639-647, Available at “ ttp://sci2s.ugr.es/keel
A Monthly Double-Blind Peer Reviewed Refereed Open Access International e-Journal - Included in the International Serial Directories.
GE-International Journal of Engineering Research (GE-IJER) ISSN: (2321-1717)
46 | P a g e 22 Xi-Yu Zhou, Joon S. Lim,‟ Replace Missing Values with EM algorithm based on
GMM and Naïve Bayesian‟, International Journal of Software Engineering and Its
Applications Vol.8, No.5 (2014), pp.177-188
http://dx.doi.org/10.14257/ijseia.2014.8.5.14
23 Dataset, „Aliphatic Carboxylic acids data set‟, Available at http://vincentarelb
undock .github.io/Rdatasets/datasets.html accessed on
24 „WEKA‟, Available www.weka.net.nz/.
25 Aman Kumar Sharma, Suruchi Sahni, “A Comparative Study of Classification
Algorithms for Spam Email Data Analysis”, IJCSE, Vol. 3, No. 5, 2011, pp.
1890-1895
26 JRip, Available at https://en.wikibooks.org/wiki/Data_Mining _Algorithms _In_ R
/Classification/JRip accessed on 11/10/15
27 Confusion matrix, Available at http://www.gepsoft.com/gepsoft /APS 3KB
/Chapter09/Section2/SS03.htm accessed on 10/10/15
28 Ali serhan Koyuncugil, Nermin Ozgulbas, „Surveillance Technologies and Early
Warning Systems: Data Mining Applications for risk detection‟, Information Science
![Figure 3 General Data pre-processing framework [8]](https://thumb-us.123doks.com/thumbv2/123dok_us/48811.1008294/5.595.164.468.481.643/figure-general-data-pre-processing-framework.webp)
![Figure 4 Forms of Data Preparation [10] Data from the real world is never perfect. The problems for the improper and](https://thumb-us.123doks.com/thumbv2/123dok_us/48811.1008294/6.595.138.451.265.513/figure-forms-data-preparation-data-perfect-problems-improper.webp)