Copyright 2007 Psychonomic Society, Inc. 802 Generating tactile patterns over a rather large geometri-cal surface is a challenge in terms of mechanigeometri-cal design, electrical power consumption and cost. High-resolution 2-D tactile shapes can be reproduced using embossing paper (e.g., Lederman, Browse, & Klatzky, 1988) and 3-D objects can be constructed using clay or other material such as Lego bricks (e.g., Newell, Ernst, Tjan, & Bülthoff, 2001). Although these types of stimuli are adequate for haptic experimentation, it is nevertheless difficult to con-trol the shape dimensions precisely or to maintain accu-rate timing using such stimuli. Furthermore, the develop-ment of more real-world paradigms, such as multisensory perception (e.g., presenting stimuli from more than one sensory modality), is compromised. Given the increase in the number of investigations on haptic and multisensory perception there is a real need for an experimental appara-tus that is capable of delivering haptic stimuli under con-trolled spatial and temporal conditions. Moreover, such a device should be able to present visual as well as haptic stimuli under the same conditions.
There are, to date, several devices available on the mar-ket which are capable of presenting tactile displays. How-ever, most of these devices have limitations. For example, many of the earlier computer controlled tactile simulators were stationary and only capable of delivering texture in-formation of very small objects. Perhaps one of the better known of these virtual tactile displays was the Optacon, developed by Linvill and Bliss (1966). The Optacon in-volves a handheld optical scanner that translates lumi-nance contrasts into a 6 3 24 matrix of vibratory pins. The Optacon is not a haptic system in the sense that it does not allow for active scanning of the stimulus. The matrix of tactile pins is immobile and the user must move the scanner (i.e., not the matrix of pins) across the surface with one hand while feeling what is on the virtual surface with the other hand. It is known that active touch provides better discrimination of objects (Klatzky & Lederman, 1993; Lederman & Klatzky, 1993; Lederman, Klatzky, & Reed, 1993) and textures (Lederman, 1981) than pas-sive touch. Consequently, the use of this type of apparatus
The virtual haptic display: A device for exploring
2-D virtual shapes in the tactile modality
Jason s. Chan Trinity College, Dublin, Ireland
ThorsTen MauCherand Johannes sCheMMel University of Heidelberg, Heidelberg, Germany
dana Kilroyand Fiona n. newell Trinity College, Dublin, Ireland
and Karlheinz Meier
University of Heidelberg, Heidelberg, Germany
In order to understand better the processes involved in the perception of shape through touch, some element of control is required over the nature of the shape presented to the hand and the presentation timing. To that end, we have developed a cost-effective, computer-controlled apparatus for presenting haptic stimuli using active touch, known as a virtual haptic display (VHD). The operational principle behind this device is that it translates black and white visual images into topographic, 2-D taxel (tactile pixel) arrays, along the same principle using in Braille letters. These taxels are either elevated or depressed at any one time representing white and black pixel colors of the visual image, respectively. To feel the taxels, the participant places their fingers onto a carriage which can be moved over the surface of the device to reveal a virtual shape. We conducted two experiments and the results show that untrained participants are able to recognize different, simple and complex, shapes using this apparatus. The VHD apparatus is therefore ideal at presenting 2-D shapes through touch alone. Moreover, this device and its supporting software can also be used for presenting computer-controlled stimuli in cross-modal experiments.
This tongue system also does not rely on active haptic scanning, known to facilitate object recognition (Gibson, 1962). Furthermore, the TDU has limited wearability since it is rather invasive and some participants find it un-comfortable to use.
Nowadays, a more ubiquitous virtual tactile display used in tactile perception research is a device known as a PHANToM. PHANToMdevices are capable of delivering virtual 2-D and 3-D objects in a highly controlled manner and have been used successfully to study human percep-tion (see, e.g., Ernst & Banks, 2002). These instruments use force-feedback to give the impression of an object in space. Haptic exploration with a PHANToMis limited to a single finger only and direct skin contact with the virtual object is not possible with this device.
While there are a number of tactile virtual devices avail-able, these devices are limited either in the way in which stimuli are presented (e.g., single finger exploration as in the PHANToM), the type and size of the stimuli that can be presented, the portability of the device and the general cost. To address some of these limitations, we have devel-oped an apparatus, which we call the virtual haptic dis-play (VHD) that is both portable and capable of delivering simple shapes and scenes using active touch. Here, the user places their fingers onto a relatively small active area of 48 tactile elements (taxels) which are mounted onto a carriage. This carriage can then be moved by the user across a large surface area of the device (165 3 154 mm) in order to reveal the virtual 2-D shape.
The primary advantages of our VHD compared to other virtual tactile displays are that the VHD allows for more ecologically valid exploration of a tactile shape or scene. In other words, several fingers can be used to explore a shape at any one time and hand movement is necessary to reveal shape information (see Technical Description). One other small but perhaps significant advantage of the VHD is that only the small active area requires mechanical ele-ments, electrical power and computer control, thus mini-mizing power consumption and increasing portability.
The VHD is also capable of presenting visual stimuli simultaneously with the haptic stimuli. Furthermore, the visual and haptic stimuli can be congruent or incongruent in spatial characteristics depending on the requirements of the experimental design. For visual presentation of the stimuli, the VHD is versatile in that either an entire visual object can be presented or the object can be masked and viewed through a moveable aperture of varying size (see Technical Description). This feature may be important for the implementation of multisensory experiments in that it can allow experimenters to, for example, measure the con-tribution of each modality to the perception of an object.
Another feature of the VHD is its ability to record pre-cisely the haptic scan paths made by the participant in each trial. Such scan path records are analogous to sacca-dic scans recorded by an eye tracker. Like eye movements, haptic scan path information can give an important insight into the perceptual and cognitive processes involved in shape perception (Yarbus, 1967). Furthermore, this ca-pability can allow computer scientists to refine models of human multisensory object recognition that may sub-is not ideal for texture dsub-iscrimination or shape tasks that
require active touch.
Following along the lines of Linvill and Bliss, an appa-ratus developed by Ikei, Wakamatsu, and Fukuda (1997) called the vibratory tactile system, is able to simulate tex-tures by translating visual textex-tures into a 5 3 10 matrix of piano wires, driven by a series of vibrating piezoelec-tric actuators. While this apparatus is capable of simulat-ing very complex textures, it has a very small perceptual “window” of a single fingertip. Moreover, the user must move the entire apparatus to feel larger textures. Given that this apparatus is rather large and heavy, an increase in friction is caused by an increase in object size which, in turn, can affect scanning characteristics.
Later devices allowed for the presentation of more com-plex stimuli such as Asian characters or letters (e.g., Saida, Shimizu, & Wake, 1982; Yanagida, Kikita, Lindeman, Kume, & Tetsutani, 2004). Both the Saida et al. and the Yanagida et al. devices have a large surface area (covering the abdomen or back, respectively) and allow for static presentation with relatively low resolution (Saida et al.’s devices comprises a 10 3 10 matrix array of actuators and Yanagida et al.’s device comprises a 3 3 3 matrix). In spite of the fact that active touch is not possible with these de-vices, the authors reported relatively high accuracy rates when active touch was simulated. For example, letter rec-ognition accuracy rates increased to about 95% correct when the letter was presented as if it was being written on the participant but rates dropped to between 20% and 40% when the entire letter was presented as a whole.
Perhaps the best-known tactile virtual display is the tactile visual substitution system (TVSS) developed by Bach-y-Rita, Collins, Saunders, White, and Scadden (1969). This TVSS can be placed on the abdomen, back, thigh or even the finger and is connected to a portable camera which can also be operated by the user. By mov-ing the camera, participants were able to perceive a 2-D representation of the visual shapes using the TVSS. This is done by translating digitized images (from the camera) to the matrix of tactile pins that is strapped to the partici-pant’s body area. Bach-y-Rita et al. (1969) reported that trained blind participants were able to accurately recog-nize objects and even complex objects such as faces.
More recently, Bach-y-Rita and his colleagues have fur-ther developed the TVSS to create the tongue display unit, or TDU (y-Rita, Kaczmarek, & Meier, 1998; Bach-y-Rita, Kaczmarek, Tyler, & Garcia-Lara, 1998). The TDU is composed of 144 gold-plated copper electrodes, arranged in a 12 3 12 taxel matrix. The tongue does not have the protective layer of skin and is thus better able to perceive stimulation than the skin. Bach-y-Rita et al. have demonstrated that participants using this apparatus are capable of accurately perceiving shapes. A practical use for the TDU is for the training of patients with vestibu-lar damage who have difficulty balancing their bodies in the absence of visual feedback (see Bach-y-Rita, Danilov, Tyler, & Grimm, 2005, for an example).
Mechanical Description
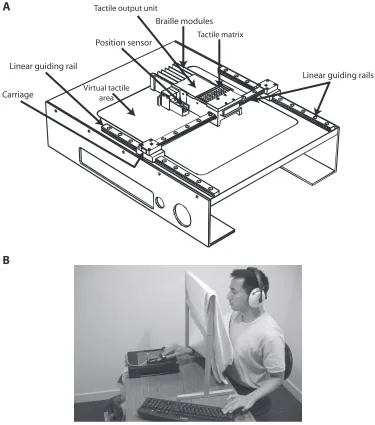
The technical drawing (Figure 1A) depicts the mechani-cal components of the VHD. An aluminium base holds two parallel linear guiding rails with a carriage moving on ball bearings (Type KUME 09 manufactured by INA Wälz-lager, Herzogenaurach, Germany). A third identical rail is mounted perpendicular on the two parallel ones so that the carriage on this single horizontal rail can be moved with very little friction in the x- and y-directions independently. The carriage holds the tactile output unit which consists of six standard piezoelectric Braille display elements. Each Braille element (METEC GmbH, Stuttgart, Germany) has eight independently movable plastic actuators arranged in sequently be used in the development of artificial
intel-ligence machines (e.g., Davison & Frégnac, 2006)
TeChniCAl DeSCripTion of VhD
The VHD was developed as a single prototype with a cost of approximately €2,000 for materials. The authors have no financial interests. In the following section we describe the technical design and the dedicated software required to operate the VHD. The software allows for a fully automated generation of complex paradigms includ-ing a combination of tactile and visual displays presented under precise temporal and spatial control.
Linear guiding rails
Tactile matrix
Braille modules
Tactile output unit
Position sensor
Virtual tactile area
Linear guiding rail
Carriage
A
B
figure 1. (A) Mechanical components of the VhD. The physical dimensions of the VhD are height 5
[image:3.576.88.463.248.673.2]threshold are coded as black and the corresponding taxels are depressed. The second mode of displaying gray scale images is by probability encoding. When using the prob-ability encoding mode, 255 gray levels (g) of an image are interpreted as probabilities proportional to 1/g. The update rate of the corresponding taxel is then proportional to this probability.
One important aspect of computer controlled stimuli is automated time sequence control. In other words, there is precise control over stimuli presentation within each trial. This can be done by the generation of paradigm files. Such an instruction-based paradigm file can also control the presentation of visual images on a computer screen. This added versatility allows for a visual stimulus to be pre-sented alone or in combination with a haptic stimulus. In this case, visual stimuli must be created using an external image graphics program. Moreover, visual stimuli do not have to be the same as the haptic stimuli. This may be an important asset when running multisensory experiments.
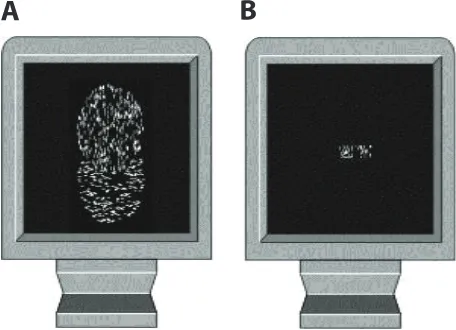
The software allows for two different types of visual presentation. The first shows the entire image, regardless of pixel resolution. In other words, the resolution of the vi-sual stimuli is not fixed to the resolution of the VHD. The second type is by presenting a visual “window.” The as-pect ratio of the visual window is resized to fit the asas-pect ratio of the VHD, and only a small portion of the image is shown at any given time (see Figure 2). The portion of the image that is visible can be moved in spatial correspon-dence with the carriage of the VHD. As in the first type of visual presentation, the visual resolution need not be the same as the resolution of the VHD.
TACTile ShApe reCogniTion experiMenTS
To test the efficiency of the VHD in delivering perceiv-able shapes, we conducted two experiments; one on the recognition of simple, 2-D shapes as a function of practice a 2 3 4 matrix, allowing for a total matrix size of 12 3 4
taxels to be felt at any given moment. The tactile output unit can slide across an area of 165 3 154 mm providing access to approximately 2,400 virtual taxels. Thus, the ac-tive surface of the tactile output unit (i.e., the area felt by the user) corresponds to only 2% of the fully accessible area at any given time.
An individual actuator pin is mounted on a pair of piezoelectric levers providing vertical movements of up to 0.7 mm. The spacing between actuators is 3.21 and 2.45 mm in the x- and y-directions, respectively. The tac-tile output unit consists of 48 actuators in total, distributed over an area of 43 3 16 mm, which can be comfortably covered by three fingertips.
The spatial position of each taxel is recorded by an opti-cal sensor (similar to a computer mouse; Mouse Systems, Fremont, CA) located at the base of the carriage. A white reference point located at the upper right corner of the tactile area is detected by a reflective photo sensor and is used to define the “origin” of the coordinate system. This reference point is important while initializing the VHD since it tracks the exact location of the carriage in relation to the entire tactile area.
The VHD receives the pattern which corresponds to the position of the tactile matrix in respect to the image being displayed. The patterns are sent via a standard 24-bit digital I/O PCMCIA card (DIO-24 manufactured by National Instruments) from the computer to the VHD. The computer receives the position data as well as the state of the calibrating sensor via the serial port. The position data are of twofold importance for the VHD. They provide information to the computer to calculate the correct pat-tern to be displayed on the tactile matrix and this position data can also be used to examine the user’s scan path of exploration. The Braille elements need 200 Volts for the operation of the piezoelectric crystals which is generated locally in the VHD with a DC/DC converter from the 5V available on the IO-Card.
Description of the VhD Dedicated Software
The VHD is programmed in C11 with a Qt API add-in for the graphical user interface (Trolltech, Palo Alto, CA). This software environment provides a portable code in a standardized programming environment.
This dedicated software allows for images to be sent to the VHD in two different user-interface modes. In the drawing mode, points and lines can be drawn using a mouse on a visual display and are then presented in-stantly as virtual stimuli on the VHD. In the image mode, black and white image files of standard image formats (e.g., *.png, *.jpg, and *.gif) can be read into the VHD and displayed. For images with a larger size than the full tactile area of the VHD, the user can select a subsection of the image to be presented.
To display texture information, the texture density is derived from the grayscale images. There are two modes of encoding such gray scale images. In the binary mode, all pixels in an image above a fixed threshold in terms of gray levels are set to white so that the corresponding taxels are elevated. In contrast, pixels below the gray level
[image:4.576.306.534.523.688.2]A
B
tal block. Feedback was not provided to the participants during the experimental blocks.
results and Discussion
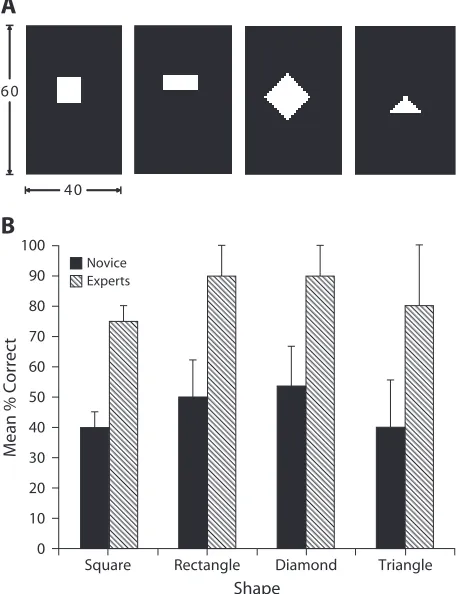
Figure 3B illustrates participants’ accuracy perfor-mance on identifying each shape. Accuracy perforperfor-mance for both participant groups is above chance level for each of the shapes (i.e., 25%). A mixed design ANOVA was conducted on the data with participant group as a between-groups factor (novices and experts) and shape as a within-subjects factor (square, rectangle, diamond, and triangle). There was a significant difference between experts and novices [F(1,8) 5 93.73, p , .0001]. Overall, the experts (M 5 83.75% correct) were significantly bet-ter than novices (M 5 45.83% correct) in recognizing the shapes. There was no significant difference in recognition accuracy across the shapes [F(1,8) , 1, n.s.].
In order to examine how much practice was required before accuracy performance was significantly improved, we compared performance to the novice group across trials as a function of the order of the trials. The forty trials were blocked into four according to the order of presentation, with Block 1 containing responses to the first 10 trials and with the VHD and the second on the recognition of more
complex tactile shapes (i.e., letters).
experiMenT 1
In this experiment, we were interested in determining whether or not simple shapes could be perceived by the user and whether or not extensive training was required with the VHD for efficient perception. The participant’s task was to explore the virtual shape and report its identity as fast and as accurately as possible.
Method
participants
Ten postgraduate students from the Institute of Neuroscience at Trinity College (5 males and 5 females, between the ages of 19 and 29 years) agreed to participate in this task. Nine of the participants were right hand dominant. Six participants had no prior experience with the VHD and the remaining four had extensive practice with the VHD in other unrelated studies. None had previous practice with the stimuli used in the experiment. All participants reported to have no tactile impairments.
Materials and Apparatus
To test the limits of the apparatus we reduced the total number of taxels available to touch on the carriage. A range of taxels on the VHD carriage were covered with a small piece of cardboard, and a small hole revealing a 3 3 3 matrix of taxels (7 3 6 mm) remained. The participant placed the index finger of their preferred hand over this matrix of taxels. This was also done to allow us to col-lect more accurate scan path data. It is unlikely that this reduced per-ceptual “window” significantly reduces shape recognition (Loomis, Klatzky, & Lederman, 1991). The VHD was placed directly in front of the participant and behind a curtain. Participants were required to place their arm underneath the curtain to reach to the VHD (see Figure 1B). This ensured that visual information relating to limb position was not used as a cue to identify the objects. Participants also wore sound-attenuating, circum-aural headphones (Silencio, NV) to minimize any possible auditory cues from movement of the VHD carriage and taxels.
The stimuli were composed of geometric 2-D shapes (square, vertical rectangle, isosceles triangle, and diamond). The areas of each shape were as follows: square (100 taxels, or 300 mm2); rect-angle (84 taxels, or 252 mm2); diamond (100 taxels, or 300 mm2), and triangle (84 taxels, or 126 mm2). The shapes were placed in the center of the tactile area (see Figure 3A). Each shape was presented 10 times during the course of the experiment. The VHD was con-nected to a Pentium 4 desktop computer which controlled stimulus presentation and recorded response times and scan paths. Trials were presented in a random order for each participant.
procedure
Before the experiment began, participants were given the names of the four shapes they would feel and were asked to use these names when identifying the shapes. At the start of each trial, participants moved the carriage to the starting position, which was the far right corner of the virtual tactile area. When the trial began, participants were instructed to move the carriage in any direction to locate and explore the shape (i.e., scanning strategy was not restricted). Each shape was positioned in the center of the VHD. A trial lasted ap-proximately 1 min or until a verbal response was made. At the end of the trial, the participant moved the carriage back to the starting posi-tion which triggered the offset of the stimulus. Participants’ verbal responses and errors were recorded by the experimenter.
All participants performed 20 practice trials before the experi-mental blocks began. There was a total of 40 trials in the
experimen-60
40
0 10 20 30 40 50 60 70 80 90 100
Square Rectangle Diamond Triangle
Shape
Mean % Correct
Novice Experts
A
B
[image:5.576.282.511.360.657.2]trial, the participant moved the carriage back to the starting posi-tion which triggered the offset of the stimulus. Participants’ verbal responses and errors were recorded by the experimenter. There were 16 trials in the experimental block (i.e., two repeats of each of the target letters).
results and Discussion
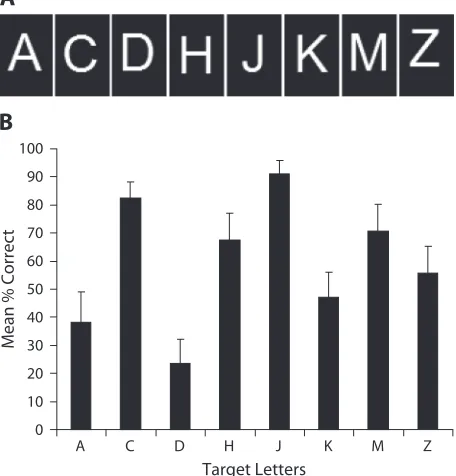
Figure 4B illustrates participants’ mean recognition performance in percentage correct for each of the target letters. A one-sample t test was conducted examining per-formance between each letter and chance level (i.e., 1/26, or 3.85%). Accuracy performance for each letter was sig-nificantly higher than chance (A, t 5 3.49, p , .05; C, t 5 13.79, p , .0001; D, t 5 2.70, p , .05; H, t 5 7.10, p , .0001; J, t 5 19.13, p , .0001; K, t 5 5.19, p , .0001; M,
t 5 7.32, p , .0001; Z, t 5 5.90, p , .0001).
An item-analysis ANOVA across performance to the target letters revealed a significant difference in letter rec-ognition [F(1,16) 5 145.10, p , .0001]. Participants were most accurate with the letters C and J relative to the letters K, A, and D ( p , .05). Although performance was greater than chance level, participants had the most difficulty ac-curately recognizing the letter D and were more likely to respond O or P instead of the correct letter D. We surmised that given the similarity between these letters that D was often confused on the basis of the number of features in common with the incorrectly reported letters.
Block 2 to the next 10, and so on. We conducted a one-way ANOVA with block order as the factor. We found no effect of block order [F(3,20) , 1, n.s.] indicating no increase in response accuracy across the blocked, 40 trials. It is clear, therefore, that practice of more than 40 trials is required before a response improvement is found in nonexperts but that, on the other hand, general practice with the device is sufficient to allow for relatively good performance across tasks (such as in our expert group).
experiMenT 2
In the following experiment, we investigated whether complex shapes, which were familiar but not normally perceived through touch, could be recognized by a group of naive participants. To that end, we tested letter recogni-tion through the VHD on participants who were not used to the device. Here the participant’s task was to explore the virtual letter and report its identity as fast and as ac-curately as possible.
Method
participants
Seventeen undergraduate and graduate students from Trinity Col-lege Dublin (10 males and 7 females, between the ages of 20 and 52 years) took part in this experiment. None took part in the previ-ous experiment or had previprevi-ous experience with the VHD. All par-ticipants were right-hand dominant and reported to have no tactile impairments.
Materials and Apparatus
The same apparatus used in Experiment 1 was also used here. The stimuli in the experimental block were composed of eight letters which were chosen from the full alphabet to represent a good variation in shapes and features (A, C, D, H, J, K, M, and Z). These letters occupied a maximum area of 30 taxel2 (i.e., about 100 mm2) on the surface of the VHD. The letters were presented in sans-serif font and were positioned in the center of the tactile area (see Fig-ure 4A). Each shape was presented twice during the course of the experiment, in random order.
procedure
Before the experiment began, participants were familiarized with the VHD and were given a maximum of 10 practice trials of tactile letter recognition using letter stimuli which were not used in the test (but occupying the same average space on the VHD as the experi-mental stimuli): L, E, P, M, and F. Before each practice trial, par-ticipants were given the name of five possible target letters and the participant was required to identify the correct target. Each practice letter was repeated twice in the practice block.
In the experimental block, participants were informed that they would be presented with target letters which may not necessarily include the practice letters and they should identify each as fast and as accurately as possible. They were also informed that letters could be repeated during the test block. They were not informed that the target stimuli were a restricted set of letters from the alphabet and, unlike in the practice block, were not informed of the possible tar-gets before each trial.
As in the previous experiment, at the beginning of each trial, participants moved the carriage to the starting position, which was the far right corner of the virtual tactile area. When the trial began, participants were instructed to move the carriage in any direction to locate and explore the letter (i.e., scanning strategy was not re-stricted). There was no time limit on exploration. At the end of the
0 10 20 30 40 50 60 70 80 90 100
A C D H J K M Z
Target Letters
Mean % Correct
B
A
[image:6.576.307.535.405.643.2]the haptic modality. The VHD described here uses taxels on a small movable carriage to represent virtual shapes. This VHD is a versatile and compact apparatus which can present virtual haptic stimuli with a reasonable resolu-tion. Although there are virtual haptic systems already available, those systems tend to be unwieldy, restrictive in terms of active exploration, invasive, or rather costly.
We tested the usability of this apparatus on a number of participants who were either required to perform a simple 2-D shape recognition task or a more complex letter rec-ognition task. Although the spatial resolution of the VHD is not as high as other available devices (e.g., the appa-ratus developed by Ikei et al., 1997) the taxel resolution does seem to be more than adequate for the presentation of geometric shapes, letters and simple textures. With little training our participants were able to correctly identify simple shapes in Experiment 1 and identify letters in Ex-periment 2. Moreover, the VHD can capture exploration procedures or scan paths which can help the investiga-tor better elucidate the processes involved in tactile shape perception. Participants with more practice using the VHD (i.e., experts in Experiment 1) were able to recog-nize the 2-D shapes with significantly greater accuracy. It is important to note that the group of expert participants have never performed an object recognition task using the VHD, but other unrelated psychophysical experiments. In other words, it is unlikely that their relatively better performance is due to their experience with other tactile object recognition studies using the VHD.
It is difficult to compare accuracy performance using the VHD with other devices since previous studies examining recognition of complex stimuli did not employ an active scanning method (see, e.g., Saida et al., 1982; Yanagida et al., 2004). However, when complex characters such as Japanese letters were presented sequentially (i.e., as if being written on the participant) accuracy performance was re-ported to be between 87% and 95% (in the Yanagida et al. and Saida et al. studies, respectively). Interestingly, perfor-mance among our expert participants is comparable to the performance in these studies but not to performance in our novice group. Thus, practice with the device has a clear ef-fect on performance and in order to compare performance across devices, practice time needs to be controlled.
The VHD is a versatile apparatus in that it can also be used to translate visual text into taxels which can be a useful feature for the visually impaired since the taxels are placed in the standard Braille format. Thus, the VHD cannot only present shapes and standard letters but Braille letters as well. Previous studies investigating the scanning patterns of Braille readers have involved video record-ing the hand movements followed by subsequent visual examination of each video frame (Millar, 1984, 1997). Such studies have concluded that persons who are blind scan Braille letters with their hands in much the same way as the eyes of sighted persons scan visual text. However, these results are somewhat subjective since these data rely on the interpretation of the experimenter on the nature of the scan path. The VHD can provide a more objective and precise scanning record to further examine Braille reading in the visually impaired.
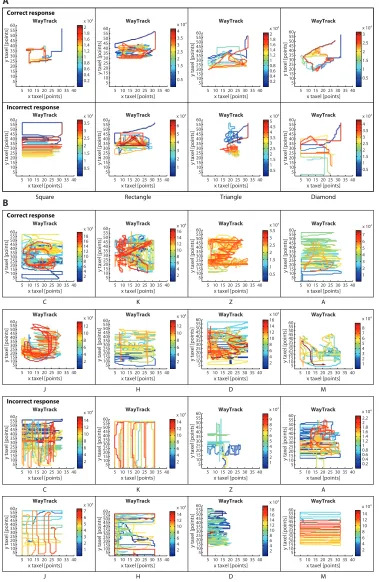
TACTile SCAn pAThS
The VHD allows the experimenter to record the scan or exploration paths taken by the participant for each stimu-lus presentation. Figure 5 ilstimu-lustrates an example of a scan path taken from one participant in each experiment before a 2-D shape was recognized (A) or a target letter was iden-tified (B). As can be seen from these example scan paths in (A), in the correctly identified shape trials this participant traced the contour of each shape as the shapes are easily resolvable from the scan paths. Furthermore, a similar contour-tracing strategy was also adopted by another par-ticipant in the letter recognition task (B) and in this exam-ple at least some of the target letters can be resolved from the scan paths, particularly the letters C, K, Z, A, and J. In fact, across all of the correct trials in Experiment 1, ap-proximately 61.90% were trials in which the participant had adopted a contour tracing scan as opposed to 14.29% trials where a left/right or up/down sweeping exploration and 23.81% trials where a random scan was adopted. In the letter recognition task (Experiment 2), we found that in 83.83% of correct trials participants adopted a letter con-tour tracing scan whereas in 14.53% the scans were from left to right (or up–down) and in the remaining 1.64% the stimuli were randomly explored. Thus, for both letters and simple 2-D stimuli contour tracing seemed to be the most effective strategy for correctly identifying the target, par-ticularly so for the more complex letter stimuli.
Previous studies have suggested that exploration proce-dures in touch are contingent on the task (Klatzky & Led-erman, 1993; Lederman & Klatzky, 1993; Lederman et al., 1993). In tactile shape identification, for example, contour following appears to be the most efficient exploration pro-cedure (Klatzky & Lederman, 1993; Lederman & Klatzky, 1993; Lederman et al., 1993). In some of the incorrect trials (see bottom rows of Figure 5, panels A and B), the partici-pant’s scan path does not match the contour of the shape but instead follows a stereotyped, left-to-right exploration strat-egy (e.g., square and diamond exploration in panel A or most incorrect trials in panel B) or a random scanning (e.g., tri-angle in panel A). We found that a contour tracing scan path was mainly absent in the trials with an incorrect response (on average only 8.5% of incorrect trials consisted of con-tour tracing compared to about 84% of correct trials). This may suggest that contour tracing in the correct trials acts as a confirmation of the identity of the letter but that recognition may have occurred prior to the full tracing of the contour of the letter. The scan paths to the correct trials for both shapes and letters may suggest some sort of top-down processing whereby participants were trying to match what was being felt to a preconceived mental image (Sathian & Zangaladze, 2002; Zhang, Weisser, Stilla, Prather, & Sathian, 2004). In any case, these scan paths can reveal why the correct shape was not identified as well as indicate which features are the most informative for identifying each shape.
generAl DiSCuSSion
Correct response Incorrect response Diamond Triangle Rectangle Square
60 x 10
4 2 1.8 1.6 1.4 1.2 1 0.8 0.6 0.4 0.2 55 50 45 40 35 30 25 20 15 10 5
y taxel [points]
5 10 15 20 25 30 35 40
x taxel [points]
WayTrack
60 x 104 3.5 3 2.5 2 1.5 1 0.5 55 50 45 40 35 30 25 20 15 10 5
y taxel [points
]
5 10 15 20 25 30 35 40
x taxel [points]
WayTrack
60 x 104 4 3 2.5 2 1.5 1 0.5 55 50 45 40 35 30 25 20 15 10 5
y taxel [points
]
5 10 15 20 25 30 35 40
x taxel [points]
3.5
WayTrack
60 x 10
4 6 5 4 3 2 1 55 50 45 40 35 30 25 20 15 10 5
y taxel [points
]
5 10 15 20 25 30 35 40
x taxel [points]
WayTrack
60 x 10
4 3 2.5 2 1.5 1 0.5 55 50 45 40 35 30 25 20 15 10 5
y taxel [points
]
5 10 15 20 25 30 35 40
x taxel [points]
WayTrack
60 x 10
4 2 1.8 1.6 1.4 1.2 1 0.8 0.6 0.4 0.2 55 50 45 40 35 30 25 20 15 10 5
y taxel [points
]
5 10 15 20 25 30 35 40
x taxel [points]
WayTrack
60 x 10
4 4 3.5 3 2.5 2 1.5 1 0.5 55 50 45 40 35 30 25 20 15 10 5
y taxel [points
]
5 10 15 20 25 30 35 40
x taxel [points]
WayTrack
60 x 104
3.5 3 2.5 2 1.5 1 0.5 55 50 45 40 35 30 25 20 15 10 5
y taxel [points
]
5 10 15 20 25 30 35 40
x taxel [points]
4 4.5 5 WayTrack Correct response A Z K C A Z K C
60 x 104 18 14 16 12 10 8 6 4 2 55 50 45 40 35 30 25 20 15 10 5
y taxel [points
]
5 10 15 20 25 30 35 40
x taxel [points]
WayTrack WayTrack 60 55 50 45 40 35 30 25 20 15 10 5
y taxel [points
]
5 10 15 20 25 30 35 40
x taxel [points]
WayTrack Incorrect response M D H J M D H J
60 x 10
4 14 12 10 8 6 4 2 55 50 45 40 35 30 25 20 15 10 5
y taxel [points]
5 10 15 20 25 30 35 40
x taxel [points]
WayTrack
60 x 10
4 14 12 10 8 6 4 2 55 50 45 40 35 30 25 20 15 10 5
y taxel [points]
5 10 15 20 25 30 35 40
x taxel [points]
WayTrack
60 x 10
4 2.2 1.2 1 0.8 0.6 0.4 0.2 55 50 45 40 35 30 25 20 15 10 5
y taxel [points]
5 10 15 20 25 30 35 40
x taxel [points]
1.4 1.6 1.8 2
WayTrack
60 x 10
4 7 6 5 4 3 2 1 55 50 45 40 35 30 25 20 15 10 5
y taxel [points]
5 10 15 20 25 30 35 40
x taxel [points]
8 9
WayTrack
60 x 107 4 6 5 4 3 2 1 55 50 45 40 35 30 25 20 15 10 5
y taxel [points]
5 10 15 20 25 30 35 40
x taxel [points]
WayTrack
60 x 10
4 14 12 10 8 6 4 2 55 50 45 40 35 30 25 20 15 10 5
y taxel [points]
5 10 15 20 25 30 35 40
x taxel [points]
WayTrack
60 x 104 14 12 10 8 6 4 2 55 50 45 40 35 30 25 20 15 10 5
y taxel [points]
5 10 15 20 25 30 35 40
x taxel [points]
18 16
WayTrack
60 x 10
4 14 12 10 8 6 4 2 55 50 45 40 35 30 25 20 15 10 5
y taxel [points]
5 10 15 20 25 30 35 40
x taxel [points]
WayTrack
A
B
60 x 104 16 14 12 10 8 6 4 2 55 50 45 40 35 30 25 20 15 10 5
y taxel [points
]
5 10 15 20 25 30 35 40
x taxel [points]
WayTrack
60 x 10
4 3.5 3 2.5 2 1.5 1 0.5 55 50 45 40 35 30 25 20 15 10 5
y taxel [points
]
5 10 15 20 25 30 35 40
x taxel [points]
WayTrack
60 x 10
4 6 5 4 3 2 1 55 50 45 40 35 30 25 20 15 10 5
y taxel [points
]
5 10 15 20 25 30 35 40
x taxel [points]
7
60 x 104 12 10 8 6 4 2 55 50 45 40 35 30 25 20 15 10 5
y taxel [points
]
5 10 15 20 25 30 35 40
x taxel [points]
WayTrack x 104
12 10 8 6 4 2 60 55 50 45 40 35 30 25 20 15 10 5
y taxel [points
]
5 10 15 20 25 30 35 40
x taxel [points]
WayTrack x 104
12 10 8 6 4 2 14 16 60 55 50 45 40 35 30 25 20 15 10 5
y taxel [points
]
5 10 15 20 25 30 35 40
x taxel [points]
WayTrack
x 104
[image:8.576.112.491.87.669.2]6 5 4 3 2 1 7 8
Chan, J. S., & Newell, F. N. (2007). Measuring the distortion of haptic
space using a virtual haptic device. Manuscript in preparation.
Davison, A., & Frégnac, Y. (2006). Learning cross-modal spatial trans-formations through spike timing-dependent plasticity. Journal of
Neu-roscience, 26, 5604-5615.
Ernst, M. O., & Banks, M. S. (2002). Humans integrate visual and hap-tic information in a statishap-tical optimal fashion. Nature, 415, 429-433. Gibson, J. J. (1962). Observations on active touch. Psychological
Re-view, 69, 477-491.
Ikei, Y., Wakamatsu, K., & Fukuda, S. (1997). Vibratory tactile dis-play of image-based textures. Computer Graphics & Applications,
IEEE, 17, 53-61.
Klatzky, R. J., & Lederman, S. J. (1993). Toward a computational model of constraint-driven exploration and haptic object identifica-tion. Perception, 22, 597-621.
Lederman, S. J. (1981). The perception of surface roughness by active and passive touch. Bulletin of the Psychonomic Society, 18, 253-255. Lederman, S. J., Browse, R. A., & Klatzky, R. J. (1988). Haptic
processing of spatially distributed information. Perception &
Psy-chophysics, 44, 222-232.
Lederman, S. J., & Klatzky, R. J. (1993). Extracting object properties through haptic exploration. Acta Psychologica, 84, 29-40.
Lederman, S. J., Klatzky, R. J., & Reed, C. L. (1993). Constraints on haptic integration of spatially shared object dimensions. Perception, 22, 723-743.
Linvill, J., & Bliss, J. (1966). A direct translation reading aid for the blind. Proceedings of the IEEE, 54, 40-51.
Loomis, J. M., Klatzky, R. L., & Lederman, S. J. (1991). Similarity of tactual and visual picture recognition with limited field of view.
Perception, 20, 167-177.
Millar, S. (1984). Strategy choices by young Braille readers.
Percep-tion, 13, 567-579.
Millar, S. (1997). Reading by touch. London: Routledge.
Newell, F. N., Ernst, M. O., Tjan, B. S., & Bülthoff, H. H. (2001). Viewpoint dependence in visual and haptic object recognition.
Psy-chological Science, 12, 37-42.
Saida, S., Shimizu, Y., & Wake, T. (1982). Computer-controlled TVSS and some characteristics of vibrotactile letter recognition. Perceptual
& Motor Skills, 55, 651-653.
Sathian, K., & Zangaladze, A. (2002). Feeling with the mind’s eye: contribution of visual cortex to tactile perception. Behavioural Brain
Research, 135, 127-132.
Yanagida, Y., Kakita, M., Lindeman, R. W., Kume, Y., & Tetsu-tani, N. (2004, March). Vibrotactile letter reading using a
resolution tactor array. Paper presented at the 12th International
Sym-posium on Haptic Interfaces for Virtual Environment and Teleoperator Systems, Chicago.
Zhang, M., Weisser, V. D., Stilla, R., Prather, S. C., & Sathian, K. (2004). Multisensory cortical processing of object shape and its rela-tion to mental imagery. Cognitive, Affective, & Behavioral
Neurosci-ence, 4, 251-259.
noTe
1. It could be argued that for visual perception the retina is also small and, hence, the size of the sense organ may not be an issue. However, unlike vision, touch perception relies on proximal or direct stimulation of the object onto the receptors therefore the size of the object that can be perceived is directly related to the size of the sense organ.
(Manuscript received November 28, 2005; revision accepted for publication December 27, 2006.)
The VHD’s accompanying software also allows for the presentation of visual and tactile stimuli either simulta-neously or in sequence under controlled temporal condi-tions. This aspect of the VHD is important for research into cross-modal shape identification. We are currently, and successfully, using the VHD to study multisensory shape and spatial perception (Chan & Newell, 2007). The VHD is also capable of presenting a visual stimulus in its entirety or can be masked allowing the stimulus to be perceived through a virtual aperture, where only the area that is spatially correlated with the position of the VHD carriage is presented. It is important to remember that this visual stimulus need not be the same as the haptic stimulus, or of the same dimensions since images can be easily scaled. This may be a particularly useful feature when running multisensory experiments where intersen-sory conflict may be an important independent variable. The software will automatically rescale the visual window in proportion to the visual stimulus. It is also important to note that since the VHD is an integrated computer ap-paratus the timing between haptic, visual or even auditory stimuli can be easily coordinated.
In summary, we describe a versatile apparatus for pre-senting haptic stimuli that can be coordinated with the presentation of visual stimuli. We feel that the VHD pro-vides a good compromise between cost, physical size, and spatial resolution. Furthermore, to the best of our knowl-edge, this is also the only apparatus available that can be used directly in visuo-haptic multisensory recognition experiments using relatively complex shapes.
AuThor noTe
This research was funded by the European Union’s Information System Technologies Programme Grant IST-2001-34712 and the Irish Research Council for the Humanities and Social Sciences. For a detailed schematic of this apparatus, please e-mail K. Meier at [email protected] .de. Correspondence concerning this article should be addressed to J. S. Chan, School of Psychology and Institute of Neuroscience, Trinity Col-lege, Dublin 2, Ireland (e-mail: [email protected]).
referenCeS
Bach-y-Rita, P., Collins, C. C., Saunders, F. A., White, B., & Scad-den, L. (1969). Vision substitution by tactile image projection.
Na-ture, 221, 963-964.
Bach-y-Rita, P., Danilov, Y., Tyler, M., & Grimm, R. J. (2005). Late human brain plasticity: Vestibular substitution with a tongue Brain-Port human–machine interface. Plasticidad y Restauración
Neu-rológica, 4, 31-34.
Bach-y-Rita, P., Kaczmarek, K., & Meier, K. (1998, October). The
tongue as a man–machine interface: A wireless communication sys-tem. Paper presented at the 1998 International Symposium on
Infor-mation Theory and Its Applications, Mexico City, Mexico.