N A N O E X P R E S S
Open Access
Spectroscopy of the Surface Polaritons in
the Cd
X
Zn
(1
−
X)
P
2
Solid Solutions
K. V. Shportko
1*, T. R. Barlas
1, J. Baran
2, V. M. Trukhan
3, T. V. Shoukavaya
3and E. F. Venger
1Abstract
Here we report on the analysis of the effect of the doping of CdP2single crystals by ZnP2nanoclusters on the dispersion of the surface polaritons (SP). The ATR spectroscopic technique has been applied to excite the SP in the CdXZn(1−X)P2system. Analysis of the obtained spectra has shown that the doping of CdP2single crystals by ZnP2 nanoclusters result in the position and the width of the dispersion branches of the SP. This effect is more pronounced in the low frequency dispersion branches. These SP branches are originated from phonons which correspond to the motion of the cation sublattice.
Keywords:Nanocluster, Solid solution, Vibrational properties, Surface polaritons, ATR
PACS:70.78.40.F, 70.63.20.K
Background
The recent interest to exploring the properties of zinc and cadmium diphosphides ZnP2and CdP2is caused by the possibility of employing them in various devices, such as, temperature detectors, deflectometers of laser beams, photoconducting cells, magnetic sensors, ex-tenders, and stabilizers of laser radiation, photovoltaic applications [1, 2]. Vibrational properties of ZnP2 and CdP2have been previously reported in [3–6] in the wide temperature range. The effect of the doping of CdP2 by ZnP2 nanoclusters on the vibrational properties of the resulting solid solutions of CdXZn(1−X)P2 have recently been presented in [7]. According to the technology of the obtaining CdXZn(1−X)P2solid solutions, most of the ZnP2nanoclusters are located in the near surface area. It has been shown [8], that surface polaritons are very sensi-tive to the presence of the surface defects and impurities. The dispersion and the damping of surface polaritons, that are localized in a thin surface layer with the thickness of the order of the reciprocal value of the damping constant, are very sensitive to the characteristics of the surface including the structure of the crystal and its relief [9]. It was shown that the optical spectroscopy is a powerful
experimental technique to study the properties of complex structures [10, 11], and the most efficient way to obtain the data on the dispersion of SP in solid solutions is employing ATR technique, as it has been shown in [9] for Ga1−xAlxAs and GaAsxP1−x. Thus, present work is aimed to study the influence of ZnP2nanoclusters on the disper-sion of the SP in CdXZn(1−X)P2solid solutions. This might provide information on the distribution of the ZnP2 nanoclusters in the host CdP2 that can be useful for employing CdXZn(1-X)P2in the construction of the opto-electronic devices.
The paper consists of the following parts: Introduction briefly represents the previous results and describes the motivation of the research. Experimental section proce-dures work, we describe the experimental proceproce-dures, such as preparing the samples, optical spectra measure-ments, and their treatment. In the Results and Discus-sion section we describe the influence of the doping CdP2by the ZnP2nanoclusters on the dispersion of SP in CdXZn(1−X)P2 by the analysis of the systematic changes in the ATR spectra. In Conclusions section we summarize obtained results.
Methods
CdP2in the polycrystalline form was grown from the ini-tial elements by two-temperature way and then was used to grow single crystals of CdP2. The CdXZn(1−X)P2solid * Correspondence:[email protected]
1Lashkaryov Institute of Semiconductor Physics, National Academy of
Sciences of Ukraine, Nauki av. 45, Kyiv 03028, Ukraine
Full list of author information is available at the end of the article
solution was obtained in the following way: Zn was de-posited on the surface of the CdP2 single crystal and then annealed in the oven at the temperature of 650 °C for 600 h. The CdXZn(1−X)P2 system is a CdP2 single
crystal with inclusions of tetragonal ZnP2 with size of up to 100 nm [1]. The concentration of ZnP2nanoclusters has been controlled by XRF, and in the studied CdXZn(1−X)P2 sample it was x= 0.9991. As a reference,
in this work we also used pure CdP2 (x= 1) samples. All studied samples were in the shape of plates with a size of 2 × 3 × 1 mm.
The ATR spectra of the SP were recorded in the usual manner in the 150−500 cm−1 frequency range. In the experiments, we used p-polarized radiation and spec-trometers KSDI-82 equipped with ATR unit LOMO NPVO-1 as well as Bruker IFS 88 equipped with Perkin Elmer ATR unit. CsI semicylinder served as ATR elem-ent in both cases. ATR spectra were recorded with sev-eral angles of the incidence of the radiation in the range of 40–60°. The polystyrene spacers were used to make an air gap between the investigated sample and the semicylinder, it was varied from 6 to 8μ.
Results and Discussion
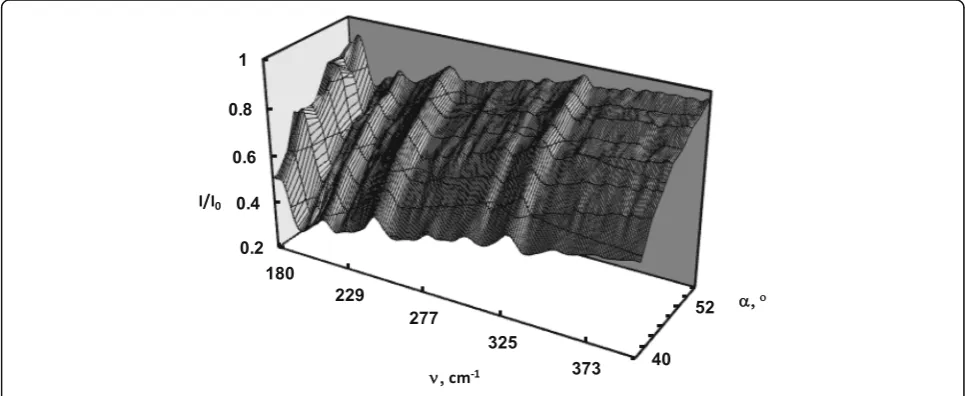
To study the dispersion of SP, the method of ATR was employed. The general principles of the excitation of surface waves by ATR has been proposed and described by Otto in [12] for the surface plasma waves on metals. Figures 1 and 2 represent experimental ATR spectra of CdP2and CdXZn(1−X)P2in form of surfacesI(α,ν)/I0(α,ν),
which is a three-dimensional presentation of the system’s response that depends on the radiation frequencyνand angle of its incidenceα. Each surface is formed by eight experimental ATR spectra obtained in the range of 42–55° and in the presence of the SP damping and dissipation of
the electromagnetic wave energy the surfacesI(α,ν)/I0(α,ν)
exhibit 7 “canyons” connected with several “passes”. The depth of the“canyon” depends on the gapdbetween the ATR semicylinder and sample, radiation frequency ν, di-electric permittivity ε(ν) of the sample, refractive indexes of the ATR unit and gap. The SP dispersion curves νs(k)
correspond to the“canyons”, i.e., to the set of ATR spectra minima. In order to better show the impact of the doping, we plotted the experimental ATR spectra of CdXZn(1−X)P2
(x= 1 andx= 0.9991) recorded at 42° in Fig. 3.
The analysis of the obtained experimental data on SP in CdXZn(1−X)P2 we begin with the spectral ranges of
their existence. SP propagate along the interface and decay exponentially for directions normal to the inter-face between two media, one having a negative dielectric permittivity and the other a positive one. Tetragonal β -CdP2and α-ZnP2belong to the similar space symmetry groupP41212 D4
4
[13], where the vibrational modes have following symmetry types: 9A1+ 9A2+ 9B1+ 9B2+ 18E, according to the results of the group theoretical analysis [14].Modes of the symmetry A2(z) andE(x,y) modes are IR active, whereasA1,B1,B2,Eare first-order Raman ac-tive. Infrared active A2(z) andE(x,y) modes in CdP2and ZnP2cause occurrence of the several reststrahlen bands in the corresponding dielectric function that have been reported in [3]. In [7], we analysed the effect of the dop-ing of the CdP2single crystal by the ZnP2 nanoclusters on the vibrational properties. Due to the similarity of the crystal structure of ZnP2and CdP2, their dielectric func-tions exhibit similar profile in the IR, exhibiting the similar number and types of the modes. In Fig. 4a, we show the real part of the dielectric function ε1(with zero
phonon damping) of CdXZn(1−X)P2 and CdP2 obtained
from the reflectance measurements [7]. Replacing Cd by Zn in CdXZn(1−X)P2 causes evolution of the reststrahlen
[image:2.595.56.539.520.718.2]bands located at lower wavenumbers, that is shown in the Fig. 4: these bands are shifted to the higher wavenumbers, and at the same time they have smaller widths in the com-parison to those of the corresponding reststrahlen bands in pure CdP2. These findings can be explained in the terms of the electronic polarizability of the vibrating ions and their masses. In tetragonal CdP2, ZnP2 anion atoms form the zigzag chains which penetrate through the crystal [13]. In [15], the low frequency lattice vibrations have been attrib-uted to the Zn(Cd)-P and Zn(Cd)-Zn(Cd) modes, whereas the high frequency peaks were assigned to the internal vi-brations of the phosphorus chain. Therefore, in compari-son with CdP2in CdXZn(1−X)P2the most changes should
occur with the low frequency cation vibrations, whereas the high frequency vibrations of the phosphorus chain should remain mostly unchanged. Difference in the masses of Zn and Cd is responsible for the blue shift of the rest-strahlen bands that correspond to the cation-cation and cation-anion modes, since different energies are needed for
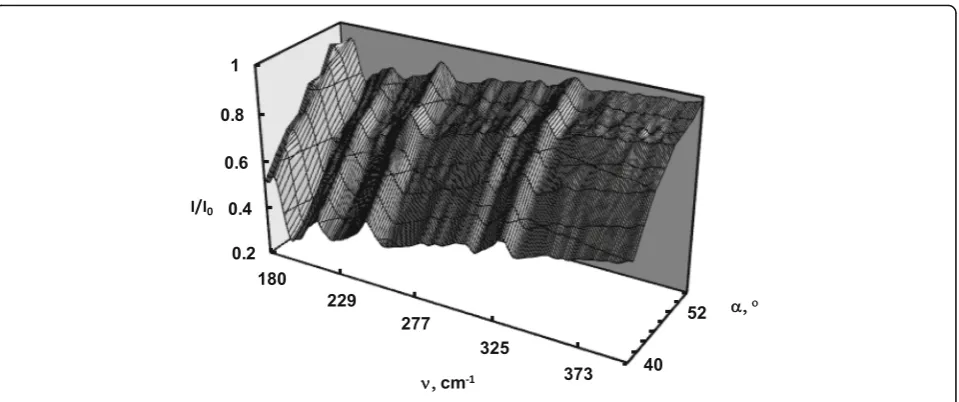
Fig. 2Experimental ATR surfaceI(α,ν)/I0(α,ν) of CdXZn(1−X)P2(x= 0.9991)
Fig. 3Experimental ATR spectra of CdXZn(1−X)P2recorded at 42°: 1
(dark blue)x= 1, 2 (light blue)x= 0.9991
Fig. 4Impact of the doping on the reststrahlen bands in CdXZn(1−X).
The dielectric function of of CdXZn(1−X).aThe real part of the dielectric
[image:3.595.306.539.347.672.2] [image:3.595.56.291.563.704.2]the excitement of the lite Zn and heavy Cd ions. Observed evolution of the widths of the bands can be explained in the terms of the electronic polarizability of the vibrating ions. According to [16], Cd ions exhibit significantly higher polarizability, and therefore, the replacement of the Cd ions by Zn ones, upon forming the ZnP2-nanoclasers, reduces the corresponding dipole moment, which we de-tected in the reduced oscillator strength and the shortening of the spectral width of the corresponding reststrahlen bands, that are presented in Table 1.
The dispersion of the SPνs(k)in CdP2and CdXZn(1−X)P2
has been calculated in the same manner as previously in
[17, 18] with respect to the sample orientation (C||y) and using as the input data the discussed above dielectric func-tion of CdP2and CdXZn(1−X)P2within the spectral range of
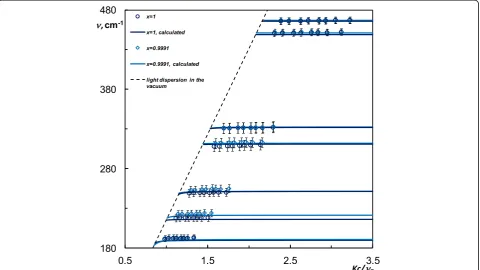
the ATR measurements. According to the Table 1, in both CdP2and CdXZn(1−X)P2calculated dispersion curveνs(k)of
the SP exhibits 7 branches within studied range. From the obtained ATR spectra, we have also distinguished 7 experimental dispersion curves to the SP in each CdP2 and CdXZn(1−X)P2 within the measured spectral
range. However, the minima in the ATR spectra that correspond to the bands between 450 and 467 cm−1 were hardly distinguished from the noise due to the weakness of the corresponding modes: the last can also be noticed in the reflectance data [7]. The SP dispersion curves have been evaluated from the ATR spectrum minima in the following way:
k¼ð2πν=cÞnsinα; ð1Þ
hereνis the frequency of the ATR spectrum minimum;
[image:4.595.56.291.110.234.2]c is the speed of light in a vacuum; n is the refractive index of material of the ATR semicylinder (n= 1.72, CsI). Thus, we have shown that experimental SP disper-sion, shown in dots in Fig. 5, obtained from the ATR spectra is in reasonable agreement with calculated branches.
Table 1The position and width of the reststrahlen bands in CdXZn(1−X)P2
No. x= 1 x= 0.9991
ν1, cm−1 Δν, cm−1 ν1, cm−1 Δν, cm−1
1 183.3 8.00 189.65 3.55
2 215.0 1.20 221.55 3.75
3 247.6 4.00 251.5 2.40
4 310.4 0.20 312.0 0.70
5 330.2 2.10 332.5 1.40
6 448.9 0.10 450.95 0.10
7 465.7 0.30 467.05 0.05
[image:4.595.59.540.440.710.2]Conclusions
We applied the spectroscopy of the SP to study the ef-fect of the doping of CdP2by ZnP2nanoclusters on the properties of the near surface area of CdXZn(1−X)P2solid
solution. Presence of ZnP2nanoclusters in the near sur-face area of CdXZn(1−X)P2causes shift of the reststrahlen
bands as well as the shortening of their widths. This finding is confirmed by the observed evolution of the dispersion of the SP in CdXZn(1−X)P2. With obtained
re-sults, we have shown that the spectroscopy of the SP might be used as a non-destructive method of the prop-erty control of the near surface area of CdXZn(1−X)P2.
Acknowledgements
One of the authors (KS) gratefully acknowledges the support from the Polish Academy of Sciences.
Authors’Contributions
TS and VT prepared the samples, KS, TB, and JB performed the measurements. KS, JB, TS, VT, TB, and EV discussed the results. KS analyzed the experimental data and drafted the manuscript. VT and JB helped to draft the manuscript. All authors read and approved the final manuscript.
Competing Interests
The authors declare that they have no competing interests.
Author details
1Lashkaryov Institute of Semiconductor Physics, National Academy of
Sciences of Ukraine, Nauki av. 45, Kyiv 03028, Ukraine.2Institute of Low Temperature and Structure Research, PAS, 2 Oko´lna Street, P.O. Box 1410, 50-950 Wroclaw 2, Poland.3Scientific and Practical Center for Materials Science, National Academy of Sciences of Belarus, P. Brovki str. 19, 220072 Minsk, Belarus.
Received: 30 December 2016 Accepted: 31 January 2017
References
1. Marenkin SF, Trukhan VM (2010) Phosphides and arsenides of Zn and Cd. IP A.N. Varaksin, Minsk
2. Stepanchikov D, Shutov S (2006) Cadmium phosphide as a new material for infrared converters. Semicond Physics, Quantum Electron Optoelectron 9:40–44 3. Shportko KV, Izotov AD, Trukhan VM et al (2014) Effect of temperature on
the region of residual rays of CdP2and ZnP2single crystals. Russ J Inorg
Chem 59:986–991. doi:10.1134/S0036023614090204
4. Baran J, Pasechnik YA, Shportko KV, Trzebiatowska-Gusowska M, Venger EF (2006) Raman and FIR reflection spectroscopy of ZnP2and CdP2single
crystals. J Mol Struct 792–793:239–242. doi:10.1016/j.molstruc.2006.01.068 5. Shportko KV, Rückamp R, Trukhan VM, Shoukavaya TV (2014) Reststrahlen
of CdP2single crystals at low temperatures. Vib Spectrosc 73:111–115.
doi:10.1016/j.vibspec.2014.05.001
6. Shportko KV, Pasechnik YA, Wuttig M, Rueckamp R, Trukhan VM, Haliakevich TV (2009) Plasmon–phonon contribution in the permittivity of ZnP2single
crystals in FIR at low temperatures. Vib Spectrosc 50:209–213. doi:10.1016/j. vibspec.2008.11.006
7. Shportko K, Shoukavaya T, Trukhan V et al (2016) The role of ZnP2
nanoclusters in the vibrational properties of CdxZn(1−x)P2solid solutions.
Nanoscale Res Lett 11:423. doi:10.1186/s11671-016-1635-y
8. Goncharenko AV, Gorea OS, Dmitruk NL et al (2001) Dielectric response function of GaPAs solid solutions in the vibrational absorption region. Tech Phys 46:968–976. doi:10.1134/1.1395117
9. Dmitruk NL (1982) Surface Polariton Spectroscopy As a Method of Studying the Structure of the Interfaces. In: Stud. Surf. Sci. Catal., p 269
10. Hadzaman I, Klym H, Shpotyuk O, Brunner M (2010) Temperature sensitive spinel-type ceramics in thick-film multilayer performance for environment sensors. Acta Phys Pol A 117:234–237
11. Karbovnyk I, Bolesta I, Rovetskii I et al (2014) Studies of CdI2-Bi3
microstructures with optical methods, atomic force microscopy and positron annihilation spectroscopy. Mater Sci. doi:10.2478/s13536-014-0215-z 12. Otto A (1968) Excitation of nonradiative surface plasma waves in silver by
the method of frustrated total reflection. Zeitschrift fuer Phys 216:398–410. doi:10.1007/BF01391532
13. Aleinikova KB, Kozlov AI, Kozlova SG, Sobolev VV (2002) Electronic and crystal structures of isomorphic ZnP2 and CdP2. Phys Solid State 44:1257–1262.
doi:10.1134/1.1494619
14. Gorban IS, Gorinya VA, Dashkovskaya RA, Lugovoi VI, Makovetskaya AP, Tychina II (1978) One and two-phonon states in tetragonal ZnP2and CdP2
crystals. Phys Stat Sol (b) 86:419–424
15. Jayaraman A, Maines RG, Chattopadhyay T (1986) Effect of high pressure on the vibrational modes and the energy gap of ZnP2. Pramana - J Phys 27:291–297
16. Shanker J, Agrawal SC, Lashkari AKG (1978) Electronic polarizabilities of ions in the chalcogenides of Zn and Cd. Solid State Commun 26:675–677. doi:10.1016/0038-1098(78)90717-2
17. Shportko K, Barlas T, Venger E et al (2016) Influence of the temperature on the dispersion of the surface polaritons in Zn3P2- Material for the
photovoltaic applications. Curr Appl Phys 16:8–11
18. Shportko KV, Otto A, Venger EF (2016) Dispersion of phonon surface polaritons in ZnGeP2: anisotropy and temperature impacts. Nanoscale Res
Lett 11:76. doi:10.1186/s11671-016-1270-7
Submit your manuscript to a
journal and benefi t from:
7Convenient online submission
7Rigorous peer review
7Immediate publication on acceptance
7Open access: articles freely available online
7High visibility within the fi eld
7Retaining the copyright to your article