BIROn - Birkbeck Institutional Research Online
Rosli, A. and Rossi, Federica (2016) Third-mission policy goals and
incentives from performance-based funding: are they aligned? Research
Evaluation 25 (4), pp. 427-441. ISSN 1471-5449.
Downloaded from:
Usage Guidelines:
Please refer to usage guidelines at or alternatively
1
Third mission policy goals and incentives from performance-based funding: are
they aligned?
Ainurul Rosli University of Westminster, Westminster Business School,
35 Marylebone Road London NW1 5LS, UK
E-mail: [email protected]
Federica Rossi
School of Business, Economics and Informatics, Birkbeck, University of London,
Malet Street, London, WC1E 7HX, UK E-mail: [email protected]
Forthcoming in Research Evaluation
Acknowledgements:
2
Abstract
In competitive knowledge-based economies, policymakers recognise the importance
of universities’ engagement in third mission activities. This paper investigates how a
specific policy approach to encourage third mission engagement – the use of
performance-based funding to reward universities’ success in this domain – aligns
with the broader goals of third mission policy. Considering the case of the United
Kingdom (UK), the first country to have implemented a system of this kind, we
analyse how the system has come into being and how it has evolved, and we discuss
whether its implementation is likely to encourage universities to behave in ways that
are aligned with the goals of third mission policy, as outlined in government
documents. We argue that the system encourages universities to focus on a narrow
range of income-producing third mission activities, and this is not well aligned with
the policy goal to support a complex innovation ecosystem comprising universities
with different third mission objectives and strategies. The paper concludes by
proposing possible avenues for achieving greater alignment between incentives and
policy goals.
3
1. Introduction
In order to create value for the economy and for society at large, universities are
expected to actively engage with stakeholders from the private, public and third
sectors (Grady and Pratt 2000). The often-repeated argument that, by accelerating the
rate of creation and distribution of knowledge, universities’ engagement with external
stakeholders can bring about greater economic prosperity (Howlett 2010; Vorley and
Lawton-Smith 2007), has underpinned what has been described as the ‘second
academic revolution’ (Etzkowitz 2003): universities have acquired a ‘third mission’
(Nelles and Vorley 2010) that consists of the ‘generation, use, application and
exploitation of knowledge and other university capabilities outside the academic
environment’ (Molas-Gallart et al. 2002, p.2). This mission, now considered as
important as teaching and research, can be pursued through various activities that
include, but are not limited to, commercialising scientific research, collaborating with
public and private organisations, providing education to audiences beyond traditional
students, contributing to public debates and to cultural activities, and engaging in
social and community regeneration processes (Bekkers and Bodas Freitas 2008;
Hewitt-Dundas 2012; Laursen and Salter 2004; Lawton-Smith 2007; Perkmann and
Walsh 2007).
The third mission has been increasingly institutionalised within universities (Lockett,
Wright and Wild 2014; Pinheiro, Langa and Pausits 2015) through actions like
top-down strategic planning, changes in leadership and implementation of supporting
organisational structures (Fumasoli, Pinheiro, and Stensaker 2014; Pinheiro and
Stensaker 2014). Policy pressures have been important drivers of institutionalisation
(Sanchez-Barrioluengo 2014; Pinheiro, Langa and Pausits 2015): since the late 1990s,
4 some third mission activities, particularly the commercialisation of university
research through patents and spinoff companies (Mowery and Sampat 2005; Geuna
and Rossi 2011), and research collaborations between university and industry
(Bozeman 2000; Perkmann, Neely and Walsh 2011). Key decisions for third mission
policy involve the choice of which activities should be encouraged, and what
incentives should be established to accomplish this. Incentives can be defined
explicitly: for example, additional funds can be assigned to reward universities that
perform certain activities particularly well. Incentives can also arise implicitly from
the way in which performance is measured (Rossi and Rosli 2015), for example
through the choice of indicators used to construct rankings (Montesinos et al. 2008;
Marhl and Pausits 2011). Devising third mission support initiatives that, in promoting
some channels of university engagement, do not hamper other productive efforts,
poses an important challenge to policymakers.
This paper explores how a particular approach to incentivising universities’
engagement in third mission activities – the introduction of performance-based
funding – aligns with the broader goals of third mission policy. We consider the case
of the United Kingdom (UK), which is the first country to have implemented a
comprehensive performance-based funding system for universities’ third mission
engagement: we analyse how the system has come into being and how it has evolved,
and we discuss whether such system is likely to encourage universities to behave in
ways that are aligned with the goals of third mission policy, as outlined in government
documents. So far, few studies have attempted to empirically explore the implications
of this funding system in terms of, among other things, how funds are distributed over
time (does the system lead to funding being progressively concentrated in a few
5 strategies of engagement in different third mission activities and in the other two
missions of teaching and research1. Complementing existing empirical studies, this
paper develops a critical discussion of the incentives that the performance-based
funding system is likely to generate, in light of the general goals of third mission
policy. Analysing this issue is important, not just to identify potential weaknesses in
the system that is being studied, but also to derive lessons that may be useful to
policymakers elsewhere who are considering implementing similar approaches.
The paper is structured as follows. Section 2 reviews the literature on the design and
implementation of third mission policy, focusing on the debate about the use and
implications of performance indicators and performance reward systems. Section 3
reconstructs the main steps in the evolution of the policy discourse around
universities’ third mission agenda, based on an analysis of selected policy documents
published by the UK government between 1993 and 2015. We examine the
overarching policy goals outlined in these documents. Section 4 describes how a
performance-based funding system for third mission engagement has been introduced
in the UK, and how its implementation has evolved over time. Section 5 presents a
critical discussion of the incentives that this system is likely to generate for
universities, and of their alignment with the goals of third mission policy. Possible
avenues for achieving greater alignment between policy incentives and policy goals
are discussed in the final section.
1Day and Fernandez (2015) explored the patterns of income growth from third mission activities in
UK universities, highlighting a concentration trend; Rosli and Rossi (2015) and Rossi and Rosli (2015) analysed the limitations of current indicators in reflecting universities’ actual third mission
6
2. The implementation of performance indicators and funding systems in third
mission policy
The implementation of the third mission agenda in universities has not occurred
without controversy. Critics have highlighted potential conflicts with the other
missions of the university, suggesting that the pursuit of this agenda may not only be
detrimental to the university’s search for research excellence (Florida 1999; Philpott
et al. 2011), but also to its mission to effectively produce qualified human capital
through teaching (Sanchez-Barrioluengo 2014). The distortions introduced by
commercial incentives to the fundamental principles underpinning the scientific
enterprise (Blumenthal et al. 1996; Murray and Stern 2007) might threaten
universities’ ability to fulfil all these roles simultaneously and to achieve some
balance among their missions (European Commission 2011; Sanchez-Barrioluengo
2014). Furthermore, the multiple rationales that underpin third mission activities –
from the pursuit of immediate economic gain, to broader community and regional
development and the attainment of social goals – may lead to conflicting institutional
strategies, and even conflicting policy goals and policy instruments (Flanagan et al.
2011; Mok 2005).
In view of the increasing institutionalisation and permanence of third mission
activities (Gulbrandsen and Rasmussen 2012) criticisms to third mission policy have
also focused on pragmatic aspects of design and implementation, building on the
argument that it is difficult to determine what constitutes successful performance in
third mission activities, and what activities should policies target. Four main
challenges in relation to third mission policy implementation can be identified from a
7
(i) Difficulty in identifying which third mission activities should be incentivised. The range of activities that fall within the realm of third mission is very broad (Perkmann
et al. 2013), and the choice of which ones should be incentivised is a politically
contested issue (Docherty et al. 2012), since different stakeholders might be invested
in different activities. Lockett, Wright and Wild (2014) show that, in the UK, different
associations representing different groups of university institutions had remarkably
different views about what third mission entailed, and they actively sought to shape
the discourse about the nature of third mission and the indicators used to measure
engagement and success2.
(ii) Difficulty in evaluating successful performance. It is unclear what ‘success’ means with respect to third mission. Success should be evaluated on the basis of the
outcomes of third mission activities, particularly the impacts that they produce on the
economy and on society. However, this is problematic, because it is difficult to
identify all the possible impacts to be measured, to decide the temporal interval after
which impact should be assessed, and to ascertain the extent to which impact is
directly due to the university’s actions, as opposed to serendipity, luck and other
factors beyond the university’s control (Molas-Gallart et al. 2002; Meagher, Lyall and
Nutley 2008). For this reason, success is often evaluated on the basis of engagement
measures rather than impact (Molas-Gallart et al. 2002; Robichau and Lynn 2009).
(iii) Policy goals expressed in terms of indicators rather than of underlying outcomes.
Indicators have tended to take on a central role in policy implementation (Grupp and
Mogee 2004; Sorlin 2007), often leading policymakers to express their goals in terms
8 of achievement of indicators, rather than of the outcomes they are intended to proxy
(Langford et al. 2006). Molas-Gallart and Castro-Martinez (2007) suggest that
indicators – besides being simple to handle (Sorensen and Chambers 2008) – have the
advantage of allowing stakeholders to avoid potential gridlocks due to conflicting
policy goals: in a context characterised by high ambiguity and high conflict (Matland
1995), it is easier for stakeholders to agree on symbolic measures of performance
(DiMaggio and Powell 1983) which appear objective and uncontroversial, rather than
on the more ambiguous and conflicting policy goals that they are pursuing.
(iv) Performative effects of indicators on institutional behaviour. The focus on indicators often has a performative effect (Rafols et al. 2012; Texteira and Koryakina
2013): institutions are incentivised to strategically adapt their behaviour in order to
achieve good scores in the indicators. This can stimulate undesirable changes in
institutional policies and practices (Dougherty and Reddy 2013). For example,
organizations may end up engaging too intensively in activities that are not very
commercially productive but are measured, instead of focusing on activities that are
not measured but more productive (Gulbrandsen and Rasmussen 2012).
These criticisms have become even more relevant in light of the increasing reliance
on performance-based funding as a way to promote efficiency in universities (Geuna
and Martin 2001; Hewitt-Dundas 2012). Based on theories of action (Argyris and
Schon 1996), the rationale for the use of performance-based funding is that
institutional performance can be improved through material incentives that mimic the
profit motive for business (Dougherty and Hong 2006), thus inducing organizational
compliance with a set of intended policy goals (Etzioni, as cited in Matland 1995, p.
9 ‘effector’ tools that allow the policymaker to translate goals into actions (Hood and
Margetts 2007).
Performance-based approaches have been used to distribute research funding (e.g.
UK, Holland, Italy, Spain, Canada), and since the mid-2000s the UK has implemented
a similar approach for third mission activities. Since this approach assigns a central
role to performance measurement, its implementation is likely to raise the four
problems outlined earlier. As indicators are seen as signifiers of policy goals
(Lascoumes and Le Gales 2007), they can have performative effects leading
institutions to narrowly focus on activities that are financially rewarded (Dougherty
and Reddy 2013). This can cause a misalignment between the incentives created by
the system and the overarching goals of third mission policy.
3. Third mission policy in the United Kingdom: evolution in policy goals
The UK’s science, research and higher education policy is the responsibility of the
Department of Business Innovation and Skills (BIS). However, funding allocation is
devolved to the governments of the four countries of England, Northern Ireland,
Scotland and Wales, each of which has appointed an authority in charge of higher
education policy (the Higher Education Funding Council for England, HEFCE; the
Department for Employment and Learning Northern Ireland, DELNI; the Scottish
Funding Council, SFC; and the Higher Education Funding Council for Wales,
HEFCW). Each authority is responsible for distributing funding for universities’
teaching and research activities, and for implementing policy instruments in support
of third mission engagement in its country. Further research funds to universities are
distributed competitively by seven funding councils that operate nationally. The
10 (81%) localised in England. This reflects the importance of policies implemented in
England and their influence on the whole system.
In order to illustrate the evolution of policy goals in relation to third mission, we
analysed the main documents produced by the UK government since the mid 1990s,
which we identified through a systematic publications search of the government’s
national archives and of the Higher Education Funding Council for England (HEFCE)
websites. Through qualitative analysis of these documents’ focus and contents, in line
with our research objectives (Lee 2009), we tracked change and discontinuities in
policymakers’ goals and recommendations (Bowen 2009), leading to temporal
bracketing (Lamothe and Langley 2001; Mills, Durepos and Wiebe 2010). Temporal
bracketing helps to decompose the data and identify specific theoretical mechanism
recurring over time (Langley 1999; Langley et al. 2013).
We identified 25 key policy documents that are particularly relevant to understand the
evolution of the government’s policy goals in relation to university third mission3.
These documents have been published between 1993 and 2015 by the departments
that, over time, have been in charge of higher education policy4 and by the devolved
higher education authorities. For each of these 25 documents, we identified the
general policy goal to be addressed, the specific goal identified in relation to third
mission, and the key recommendations made in order to achieve such third mission
3Based on secondary literature, this analysis does not explore what were the social, political, cultural
factors that underpinned the changes in the way in which third mission has been conceptualized in policy documents. However, our main objective here was to reconstruct and map these changes, rather than identify their driving factors, and the documents provided a convincing illustration of this.
11 policy goals. A table summarizing these is presented as a supplementary file.
Temporal bracketing has led us to identify three key overlapping periods in the
evolution of third mission policy goals.
3.1. Early 1990s – early 2000s: Third mission engagement as technology transfer
The UK government’s concern with supporting university-industry technology
transfer began in the 1970s, when a widespread debate on the UK’s presumed failure
to exploit research emerged (Grady and Pratt 2000). Initial interventions to answer the
problem were fragmented, the government’s aspirations were unclear, and synergies
among government, university and industry were lacking. In, 1993 the white paper
‘Realising our potential’ (OST 1993) purported to highlight a gap between the UK’s
excellence in science and technology and its relative weakness in exploiting them to
economic advantage. For the first time, universities were explicitly identified as the
central focus for economic development, and the importance of partnerships between
industry, government and the science base was emphasised. This white paper led to a
re-configuration of government support for science and technology. The move of the
Office of Science and Technology (OST) from the Cabinet Office to the Department
for Trade and Industry (DTI) in 1995 provided an avenue for more coordinated
national policy on university third mission. With the election of the Labour
government in 1997, greater concern for improved economic competitiveness and
social welfare led to more attention being paid to supporting universities’ engagement
with business and the community, reflected in an increasing number of government
white papers and policy reviews on this issue.
The Dearing Report (National Committee of Enquiry Into Higher Education 1997)
12 encouraging them to commercialise scientific results through patents and spinoff
companies. The white paper ‘Our Competitive Future: Building a Knowledge Driven
Economy’ (DTI 1998) drew attention to the government’s ability to promote
enterprise and stimulate innovation by rewarding universities for strategies and
activities to enhance interaction with business. The white paper ‘Excellence and
Opportunity’ (DTI 2000) highlighted the government’s crucial role in encouraging
the exploitation of knowledge in order to improve UK’s competitive position; it
suggested that the commercialisation of scientific research and invention should be
encouraged, particularly through the use of intellectual property rights.
The model of university third mission engagement that prevailed until the early 2000s
borrowed heavily from the sciences and engineering (Kitagawa and Lightowler
2012): innovation was viewed as an essentially linear process whereby universities
would transfer technology to business, either by selling patents and licenses, by
performing contract research (National Committee of Enquiry Into Higher Education
1997; DTI 1998) or by setting up spinoff companies (Lockett, Wright and Wild
2014).
3.2. Early 2000s- 2010s: Third mission engagement as knowledge transfer
During the 2000s, policy documents began to reflect a more nuanced view of third
mission engagement, supported by growing empirical evidence highlighting the
diversity of engagement channels (Jones and Craven 2001; Wright et al. 2008;
Meagher, Lyall and Nutley 2008). It was recognised, particularly on the basis of
evidence from the US (Chakrabarti and Santoro 2004; Mowery and Sampat 2005),
that the commercialisation of patents and licenses and the sale of shares in spinoffs
13 and that emphasizing intellectual property rights could hamper knowledge-sharing
and collaborative work (David and Metcalfe 2007).
The Lambert Review (HM Treasury 2003) explicitly took a holistic view of
universities’ third mission activities, recognising the limitations and possible
drawbacks of focusing too much on patenting and on the pursuit of narrow financial
returns. This was reiterated in later documents such as the Gowers Review (HM
Treasury 2006) and the Saraga report (DIUS 2007), which argued that universities’
emphasis on intellectual property negotiations might not be beneficial to the wider
economy. The more recent Hargreaves Review (BIS 2011) highlighted that
universities should realise the potential of their intellectual property beyond their
patent portfolio, focusing on other areas such as copyright.
In this period, the term ‘knowledge transfer’ began to be used widely (e.g. DES 2003;
HM Treasury 2003). While universities were still seen as transfer agents (Bozeman
2000) involved in a somewhat linear innovation process, the term ‘knowledge
transfer’ suggested that they could transfer more than just technology, by engaging in
people-based and problem-solving activities (Hughes and Martin 2012). These
activities included, among others, professional development, consulting for the public
and private sectors, provision of testing, prototyping, clinical, legal, logistic and other
knowledge-intensive services (Bekkers and Bodas Freitas 2008; D’Este and Patel
2007).
The focus broadened from science and engineering to the entire spectrum of academic
disciplines, including the social sciences and the arts and humanities, and to different
types of universities (DIUS 2008a, 2008b). The white paper ‘Opportunity for all in a
world of change’ (DTI/DFES 2005) claimed that different universities had different
14 in global markets, and others primarily as collaborators engaging with local
businesses, communities and policymakers), and that institutions must choose the role
which best suits their strengths. It argued that public funding should encourage such
choice, by providing incentives for institutions to become more entrepreneurial, build
closer links with business and the community, and have proper arrangements for
exploiting the results of their work. Acknowledging that different universities engage
in different types of activities, the Sainsbury Review (HM Treasury 2007)
recommended that third mission funding should be spread more widely across the
sector.
During the 2000s, particular attention was paid to the regional dimension of
universities’ third mission (Potts 2002). The ‘Future of Higher Education’ white paper
(DES 2003) proposed a more regional focus for universities to support economic
development. In 2000 the government had created a new Regional Innovation Fund
worth £50 million a year to enable Regional Development Agencies (RDAs) to
support clusters, incubators and networking among scientists, entrepreneurs,
managers and financiers. The Lambert Review (HM Treasury 2003) emphasised that
RDAs should be given targets to promote links between business and university. The
Fifth Parliamentary Report by the Select Committee on Science and Technology
(2003) recommended that HEFCE should develop measures to assess the
effectiveness of third mission engagement, with particular focus on their regional
dimension, to complement national quality measures for teaching and research. The
report suggested the implementation of an appropriate measurement system, to ensure
‘sustained commitment by HEIs [Higher Education Institutions] to supporting
business so that they develop the motivation, capacity, capability and commitment to
15 (Select Committee on Science and Technology 2003, 5.2). Interestingly, policy
debates in Europe in the same period showcased similar developments, calling for
universities to contribute to society not only by generating research and consultancy
income but also by driving the development of regional innovation systems (European
Commission 2011, 2015).
3.3. Early 2010s onwards: Third mission engagement as knowledge exchange
Since the 2010s, the government’s aspirations have broadened further. Universities
are expected to be part of ecosystems of innovation characterised by collaboration and
exchange among a variety of stakeholders, aimed at addressing complex social and
economic challenges (Andersen, Brinkley and Hutton 2011; BIS 2015). The term
‘knowledge exchange’, which emphasises the two-way, collaborative nature of the
interactions between universities and businesses (or other stakeholders) began to gain
ground (DIUS 2008; BIS 2012, 2013a, 2015).
The ‘Innovation Nation’ white paper (DIUS 2008b) argued for the importance of
approaching innovation systemically by building a supporting environment that
involved the Research Councils, the government, the RDAs, universities and
businesses. Emphasis was placed on creating collaborative relations and two-way
exchange of knowledge as opposed to one-way transfer. The Wilson Review (BIS
2012) suggested that the impact of university-industry collaboration should not be
measured purely on the basis of economic gain but also consider policy development.
The Dowling review (BIS, 2015) recommended universities to expand the numbers of
long-term strategic partnerships with businesses across all areas, disciplines and
sectors, while the ‘Growing your business’ review by Lord Young (BIS 2013a)
16 was placed on creating a conducive environment for university-industry collaboration,
by setting up appropriate structures and incentives (BIS Committee 2013; BIS 2014a),
and on the development of interdisciplinary and concerted action on a large scale to
bring about radical change (BIS 2010a; BIS 2013b). In response to these concerns, the
government introduced the Catapults, clusters and hubs to encourage collaborative
work and free flow of ideas through co-location of university and industry staff. The
Hauser review (BIS 2014) encouraged the government to increase the number of
Catapults to twenty by 2020 and thirty by 2030.
After 2010, however, the regional focus has been abandoned. Cochrane and Williams
(2013, p. 47) noted that ‘it would be hard to find any explicit reference to local or
regional economies in statements emerging from the Department of Business,
Innovation and Skills or the Higher Education Funding Council for England since
May 2010’. This is in line with the broader trend towards regional policy
disengagement level occurring in England5: following the publication of the white
paper ‘Local Growth: Realising Every Place’s Potential’ (BIS, 2010b), and in parallel
with the change to a Conservative-Liberal Democrats coalition government, all RDAs
were closed down (31 March 2012) and new business-led Local Enterprise
Partnerships (LEPs) between local authorities and businesses were established. By
April 2014, 39 LEPs covered all areas of England (BIS Committee, 2014). The Witty
Review (BIS, 2013b) and the Heseltine Review (BIS 2013c) highlighted the
importance of the LEP as a pathway to national economic growth: they argued that
5 Interestingly, the progressive abandonment of a regional policy focus within England has been accompanied by the ongoing devolution of policy powers across the countries of Northern Ireland, Scotland and Wales. Devolution has allowed these governments to implement independent science and innovation policy initiatives. See Huggins and Kitagawa (2012) for a comparative analysis of
17 funding allocation should support LEPs partnering with local universities, which
would enhance the locality’s competitive advantages and leverage their co-location to
generate growth (BIS 2013c, 2014b, 2015). However, how policies in support and
innovation and knowledge transfer can be implemented in the LEP context remains
unclear. This might have had the consequence of discouraging universities to pursue
an agenda of contributing to regional development as a key form of engagement, and
rather focus on different objectives. Little empirical evidence exists at the moment to
argue whether this has been the case.
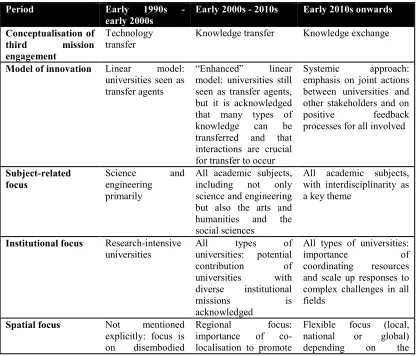
Table 1 summarises the key policy goals, closely related to different
conceptualisations of the nature and focus of third mission activities, in each of these
[image:18.595.85.503.412.768.2]three periods.
Table 1. The evolution of third mission policy goals in the UK
Period Early 1990s -
early 2000s Early 2000s - 2010s Early 2010s onwards
Conceptualisation of third mission engagement
Technology
transfer Knowledge transfer Knowledge exchange
Model of innovation Linear model: universities seen as transfer agents
“Enhanced” linear
model: universities still seen as transfer agents, but it is acknowledged that many types of
knowledge can be
transferred and that interactions are crucial for transfer to occur
Systemic approach:
emphasis on joint actions between universities and other stakeholders and on
positive feedback
processes for all involved
Subject-related focus
Science and
engineering primarily
All academic subjects, including not only science and engineering but also the arts and humanities and the social sciences
All academic subjects, with interdisciplinarity as a key theme
Institutional focus Research-intensive
universities All universities: potential types of
contribution of
universities with
diverse institutional
missions is
acknowledged
All types of universities:
importance of
coordinating resources and scale up responses to complex challenges in all fields
Spatial focus Not mentioned explicitly: focus is
on disembodied
Regional focus:
importance of
co-localisation to promote
Flexible focus (local, national or global)
18
knowledge which can be transmitted easily
interactions challenges to be
addressed
Key policy goals Increase
universities’ ability
to respond to
industry needs
Increase universities’ ability to build ongoing relationships with
stakeholders in
business, policy,
communities, broader society
Help universities to work with other partners to build effective ecosystems of innovation able to tackle complex challenges
4. Third mission policy in the United Kingdom: implementation of a
performance-based funding system
Since the mid-1990s, in parallel with the setting out of policy goals in government
documents, several policy instruments were launched with the objective to encourage
and support universities’ third mission engagement. While performance-based
funding systems have been implemented in all four UK countries, the particular sets
of instruments and the details of their implementation differ (Huggins and Kitagawa
2012). Our analysis focuses on England, which hosts the majority of university
institutions in the UK, and where the switch to performance-based funding has been
more marked. We track the consolidation of different instruments into a single
funding stream, whose allocation has progressively changed from competitive to
performance-based, and the evolution in the formula used for the allocation.
4.1. The implementation of a performance-based funding system for third mission engagement
While several stand-alone initiatives supporting university-industry collaborations
around research and training had been implemented in the UK since the mid-1970s,6
19 the Knowledge Exploitation Programme launched in 1999 was the first package of
measures explicitly designed to support universities’ third mission engagement in a
comprehensive way. The package included three instruments:
(i) The Higher Education Reach-out to Business and the Community (HEROBAC)
Fund: sponsored by Department for Education and Skills (DFES) and Department of Trade and Industry (DTI) and allocated by HEFCE, the HEROBAC fund initially was set at £60m over four years (HEFCE 1999). From the start, the intention was to turn it
into a permanent third stream of funding, aimed at developing the capability of
universities to engage with business and the wider community, by setting up
appropriate organisational and structural arrangements.
(ii) The Science Enterprise Challenge (SEC) supported entrepreneurially-oriented
education and training through networks of universities. It aimed to foster the
development of an innovation culture in universities and encourage them to more
closely align their practices and objectives to those of business. Allocated through
competition and managed directly by OST, £45 million was made available over the
period 1999-2004.
(iii) The University Challenge Seed Fund provided access to seed funds to exploit
science and engineering research outcomes and support the creation of university
spinoffs. The scheme was funded by the Wellcome Trust, the Gatsby Charitable
Foundation and the UK Government. Universities receiving the fund had to provide
20 25% of the total fund from their own resources. £45 million was allocated in the first
round of the competition in 1999, and £15 million more in 2001.
Both the SEC and the University Challenge Seed Fund were aligned with the focus on
spinoffs as key channels of technology transfer, which prevailed at that time.
Following the Government’s 2000 Spending Review, in 2001/2 a new stream of
funding to support universities’ third mission engagement was announced as a
partnership between HEFCE, DTI and DFES, in order to continue and develop the
work of the HEROBAC initiative: the Higher Education Innovation Fund (HEIF), to
sit alongside the core funding to university institutions for research and teaching7.
Since the remit of HEIF included the activities originally funded by the HEROBAC,
Science Enterprise Challenge and University Challenge Seed Fund, HEIF streamlined
the various initiatives under a single fund. The fund was supposed to facilitate a more
strategic approach to third mission, whereby some universities attributed more
importance to supporting local industry and to other focus areas, than to basic
research (Select Committee on Science and Technology, 2003).
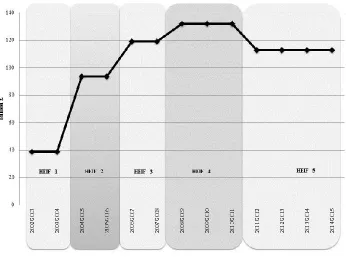
Figure 1 shows the evolution of the yearly amount of funding allocated to the HEIF in
England since its inception in 2001. After a marked increase between 2004 and 2008,
the fund has later stabilised on an amount of just under £120 million per year, which
is almost three times as much as in 2001. The fund has become, over time, a very
important source of support for third mission activities, also as a consequence of the
progressive drying up of other sources of funding. A recent report (Coates Ulrichsen
21 2014) suggests that about 34% of universities’ third mission income resulted from
[image:22.595.121.467.197.454.2]activities realised using HEIF funding.
Figure 1: The evolution of HEIF funding allocation
Source: Authors’ elaboration based on data from HEIF reports, available from http://www.hefce.ac.uk/kess/heif/ (last accessed August 2015).
Besides the consolidation of various funds into a single stream, the decade following
the introduction of HEIF has also seen a change in the allocation process. Initially,
funds were allocated competitively, on the basis of the project proposals; but since
2006 funds have been allocated to universities according to their third mission
performance.
This has been justified in terms of a change in the fund’s objectives. The funds
allocated competitively in the first period of the HEIF (HEIF1 and HEIF2) were
22 appropriate infrastructures and developing competences (Grady and Pratt 2000). The
rationale for performance-based funding was to reward and encourage excellence in
third mission activities alongside research and teaching (HEFCE 2011). This switch
was progressive: while HEIF3 and HEIF4 introduced formula-based funding, this
constituted only part of the overall allocation with the remaining part still being
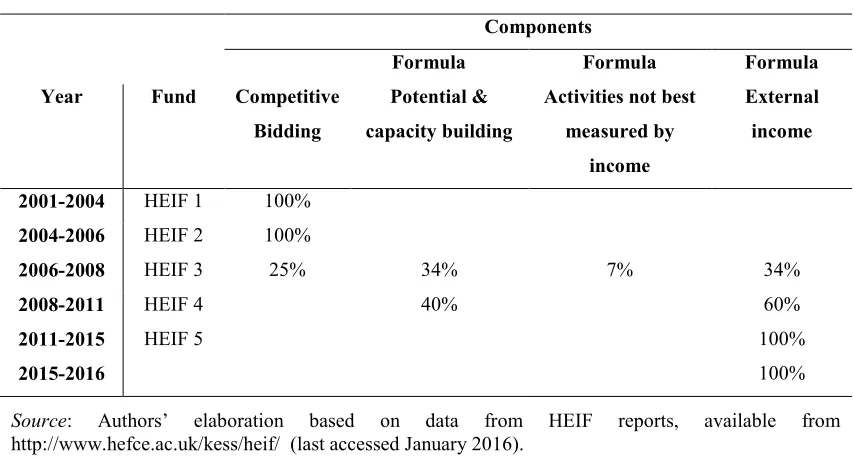
allocated competitively. Since HEIF5, the allocation is entirely formula-based. The
[image:23.595.85.512.291.520.2]evolution of the allocation mechanism is shown in Table 2.
Table 2: Evolution of HEIF allocation mechanism
Components
Formula Formula Formula Year Fund Competitive
Bidding
Potential & capacity building
Activities not best measured by
income
External income
2001-2004 HEIF 1 100%
2004-2006 HEIF 2 100%
2006-2008 HEIF 3 25% 34% 7% 34%
2008-2011 HEIF 4 40% 60%
2011-2015 2015-2016
HEIF 5 100%
100%
Source: Authors’ elaboration based on data from HEIF reports, available from http://www.hefce.ac.uk/kess/heif/ (last accessed January 2016).
4.2. Characteristics of the implementation of performance-based funding
Once the performance-based funding system was established in 2006, its
implementation involved the decision to link it to a formula based on quantitative
indicators of performance, rather than, for example, some form of qualitative
assessment. The formula also changed over time, with increasing weight assigned to
23 In HEIF3, the formula (which was used to allocate 75% of the HEIF funding) was
based on a set of 12 indicators derived from several sources (Kitagawa and
Lightowler 2012; Molas-Gallart and Castro-Martinez 2007). These indicators
included income from intellectual property exploitation, regeneration and
development, and non-credit bearing courses, as well as data on student placements,
engagement with noncommercial organizations, staff dedicated to third mission
activities, and overall number of staff of the university (Molas-Gallart and
Castro-Martinez 2007). In HEIF4, 100% of funds were allocated via formula, and the
formula was based on a combination of number of staff and income from a set of third
mission activities. Income from small and medium-sized enterprises (SMEs) was
double-weighted (Kitagawa and Lightowler 2012). In HEIF5, all funds were allocated
via formula, and the formula was entirely based on the income that universities
accrued from third mission activities8. Again, income from SMEs was double
weighted.
Moreover, a more stringent approach to funds allocation was adopted, from granting
the funds lump sum (HEIF1-HEIF3) to administering the allocation yearly (HEIF4,
HEIF5). This required universities to adopt a more strategic approach to planning for
their third mission activities within the specific HEIF period. There was also a move
towards greater concentration of funds, with an increase in the maximum award
received by each university (£2.85 million for HEIF5) and the introduction of a
threshold, whereby only universities earning more than £250,000 were eligible to
receive HEIF funds. While the presence of a cap on the maximum and minimum
changes in funding allocations allowed year-on-year should have tempered the
24 process of funding concentration (allocations could increase by 50% at most, and
could not drop by more than 50%), evidence suggests that the latest HEIF rounds
have increased funding concentration (Coates Ulrichsen 2014; Day and Fernandez
2015). Since the transition to 100% formula funding in HEIF4, growth rates in third
mission incomes have increased more in those institutions that already had higher
income, reversing a previously established trend whereby smaller institutions used to
have higher third mission income growth (Day and Fernandez 2015). Moreover,
HEIF5 (2011-2015) allocated around £26 million additional funding to top
performers, which further increased concentration. HEIF funding for 2015-2016
followed the methods used from 2011 to 2015 for the main HEIF allocations (£150
million) and included additional awards for the top performing institutions (£10
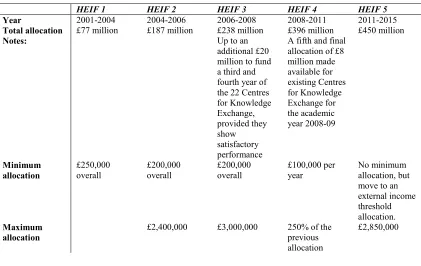
million) (HEFCE 2015). 9 Details of the evolution of HEIF allocation mechanisms are
[image:25.595.88.509.454.720.2]summarised in Table 3.
Table 3: Evolution of the HEIF funding allocation mechanisms
HEIF 1 HEIF 2 HEIF 3 HEIF 4 HEIF 5
Year 2001-2004 2004-2006 2006-2008 2008-2011 2011-2015
Total allocation £77 million £187 million £238 million £396 million £450 million
Notes: Up to an additional £20 million to fund a third and fourth year of the 22 Centres for Knowledge Exchange, provided they show satisfactory performance
A fifth and final allocation of £8 million made available for existing Centres for Knowledge Exchange for the academic year 2008-09 Minimum allocation £250,000
overall £200,000 overall £200,000 overall £100,000 per year No minimum allocation, but move to an external income threshold allocation.
Maximum allocation
£2,400,000 £3,000,000 250% of the previous allocation
£2,850,000
25
Other constraints
No institution will receive less than 75% of its previous allocation under HEIF 2
Each institution is guaranteed 80% of their previous allocation
Maximum allocation constrained to 50% increase No institution sees its allocation drop by more than 50%
Threshold for participation in the HEIF funding scheme
None None None None £250,000
minimum third mission income
Source: Authors’ elaboration based on data from HEIF reports, available from http://www.hefce.ac.uk/kess/heif/ (last accessed August 2015).
The introduction of a formula based on quantitative indicators required the
availability of such indicators in the first place. While the first step towards the
development of a performance-based funding system should be the creation of an
appropriate system to measure performance (Molas-Gallart et al. 2002), in practice,
the formulas used for the allocations of HEIF relied upon already existing indicators
that had been collected for other purposes. In particular, most of them (all of them in
HEIF5) were derived from a survey (Higher Education Business and Community
Interaction, HEBCI) that had been implemented by HEFCE in 2000 as a monitoring
system to collect information about universities’ third mission activities.
The HEBCI was developed starting from some early surveys commissioned in the
mid to late 1990s (Howells, Nedeva and Georghiou 1998), whose scope was limited
to relatively few universities. These surveys placed a strong emphasis on qualitative
information and had a strong focus on measuring regional interactions. In order to
systematise data collection, HEFCE was put in charge of carrying out a more
comprehensive survey covering all universities in the UK. The first edition of the
survey, called Higher Education and Business Interaction (HEBI) was launched in
26 Centre for Urban and Regional Development Studies, University of Newcastle upon
Tyne (Charles and Conway 2001).
Starting from the third edition (carried out in 2003 and referring to 2001/2002) the
survey has been carried out every year, but it has undergone several changes both in
its overall structure and in the activities measured, which influence the kind of
indicators that it is possible to build from the data. In particular, the structure of the
survey (now called Higher Education Business and Community Interaction, HEBCI)
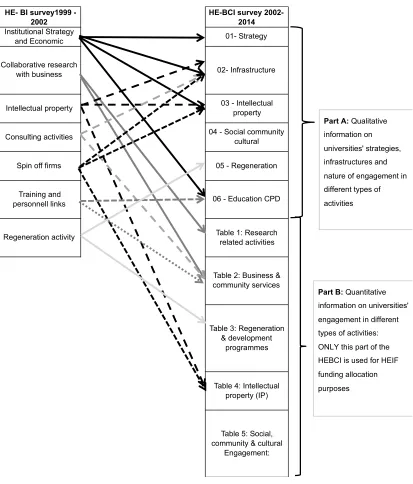
changed drastically in 2002, when it was split into two parts, one dedicated to the
collection of qualitative information about universities’ knowledge exchange
infrastructures and strategies (part A), and one dedicated to the collection of
quantitative information on their third mission activities (part B). Figure 2 shows how
the themes present in the first two editions of the survey (1999-2002) were reallocated
into these two main sections (the arrows in the figure point to the sections of the
HE-BCI survey in which the themes included in the HE-BI survey were reallocated).
Although the information collected after 2002 was initially not too dissimilar from
that collected in previous editions of the survey, in practice collating all the
quantitative information in a separate section made it easier to detach it from
qualitative information about the context in which it was generated, and it can be
argued that this facilitated the transition toward a system in which the only part that
mattered for policy implementation was the quantitative one.
27 Source: Authors’ own elaboration based on HE-BI and HEBCI questionnaires, available from http://www.hefce.ac.uk/data/ (until 2011; last accessed August 2015) and https://hesa.ac.uk/pubs/hebci (last accessed August 2015).
Since 2008, the survey has been managed by the Higher Education Statistics Agency
(HESA). In 2012 HESA launched a consultation for a review of the survey, resulting
in some changes to the 2013/14 edition. Although some universities proposed to
reintroduce an integration between quantitative and qualitative information, in order
for the qualitative responses to contextualise and help to explain the quantitative data, HE- BI survey1999 -
2002
HE-BCI survey 2002-2014
01- Strategy
02- Infrastructure
03 - Intellectual property Collaborative research with business Intellectual property Institutional Strategy and Economic
Spin off firms Consulting activities
Regeneration activity Training and personnell links
Table 5: Social, community & cultural
Engagement: 04 - Social community
cultural
05 - Regeneration
[image:28.595.93.506.66.550.2]06 - Education CPD
Table 1: Research related activities
Table 2: Business & community services
Table 3: Regeneration & development
programmes
Table 4: Intellectual property (IP)
Part B: Quantitative information on universities' engagement in different types of activities: ONLY this part of the HEBCI is used for HEIF funding allocation purposes
Part A: Qualitative information on universities' strategies, infrastructures and
28 HESA decided to leave the two-part split (HESA 2012). Moreover, the number of
qualitative questions in part A was markedly reduced, while only small changes were
made to the quantitative information collected in part B, such as removing the request
to provide income figures by RDA (following the abolition of RDAs, this request was
no longer meaningful), clarifying some definitions around intellectual property, and
including information about social enterprises.
Over time, there has also been a progressive change in the importance of the different
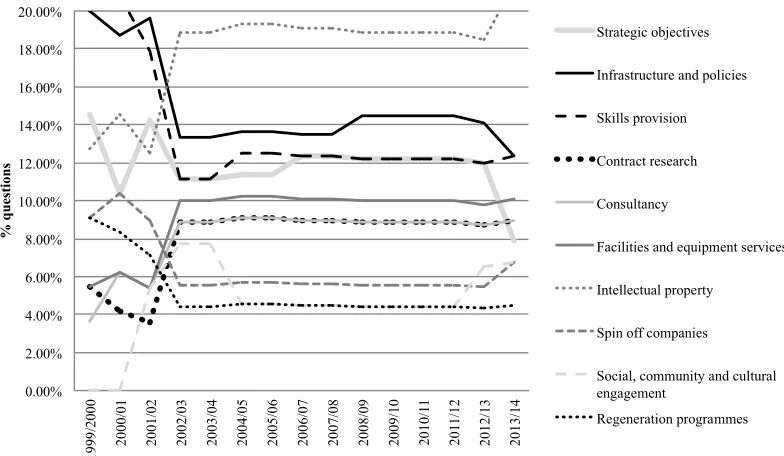
thematic areas included in the survey. Figure 3 shows the relative importance of
different themes, measured on the basis of their share of questions. Four main themes
gained ground: intellectual property, provision of facilities and equipment services,
and contract research and consultancy. Other themes declined in importance, albeit
slightly: strategic objectives, spinoff companies, and regeneration programmes. A
couple of themes appeared to lose considerable ground: infrastructure and policy, and
skills provision. The theme ‘social, community and cultural engagement’, was
introduced in 2001/2002 and, after a period in which it gained increasing importance,
its prominence in the survey stabilised.
29 Source: Authors’ own elaboration based on HE-BI and HEBCI questionnaires, available from http://www.hefce.ac.uk/data/ and https://hesa.ac.uk/pubs/hebci (last accessed August 2015).
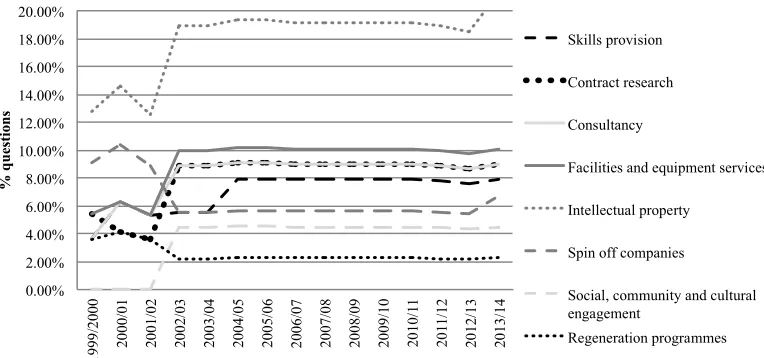
Analysing the quantitative part of the survey, Figure 4 shows that the relative
importance of various thematic areas has changed, consistently with the overall
changes introduced in the survey: rising importance of intellectual property, provision
of facilities and equipment services, consultancy and contract research, and, again,
[image:30.595.103.495.76.304.2]progressive loss of importance of spinoff companies and regeneration programmes.
Figure 4: Only Part B: The relative importance of various thematic areas in the survey, over time 0.00% 2.00% 4.00% 6.00% 8.00% 10.00% 12.00% 14.00% 16.00% 18.00% 20.00% 19 99 /2 00 0 20 00 /0 1 20 01 /0 2 20 02 /0 3 20 03 /0 4 20 04 /0 5 20 05 /0 6 20 06 /0 7 20 07 /0 8 20 08 /0 9 20 09 /1 0 20 10 /1 1 20 11 /1 2 20 12 /1 3 20 13 /1 4 % q u es ti on s Strategic objectives
Infrastructure and policies
Skills provision
Contract research
Consultancy
Facilities and equipment services
Intellectual property
Spin off companies
Social, community and cultural engagement
30 Source: Authors’ own elaboration based on HE-BI and HEBCI questionnaires, available from http://www.hefce.ac.uk/data/ and https://hesa.ac.uk/pubs/hebci (last accessed August 2015).
Figure 5 shows that over time, and in particular since 2002, the share of questions
collecting quantitative information has increased markedly: quantitative information
counted for about 40% of the survey questions in 1999/2000, but constituted 70% of
the survey questions in 2013/14.
Figure 6: The growing importance of quantitative indicators 0.00% 2.00% 4.00% 6.00% 8.00% 10.00% 12.00% 14.00% 16.00% 18.00% 20.00% 19 99 /2 00 0 20 00 /0 1 20 01 /0 2 20 02 /0 3 20 03 /0 4 20 04 /0 5 20 05 /0 6 20 06 /0 7 20 07 /0 8 20 08 /0 9 20 09 /1 0 20 10 /1 1 20 11 /1 2 20 12 /1 3 20 13 /1 4 % q u es ti on s Skills provision Contract research Consultancy
Facilities and equipment services
Intellectual property
Spin off companies
Social, community and cultural engagement
[image:31.595.104.486.98.277.2]31 Source: Authors’ own elaboration based on HE-BI and HEBCI questionnaires, available from http://www.hefce.ac.uk/data/ and https://hesa.ac.uk/pubs/hebci (last accessed August 2015).
Therefore, even though third mission policy increasingly encouraged a focus on a
broad set of third mission activities, arising from a variety of academic disciplines, in
practice the survey attributed progressively greater importance to a few activities
likely to generate income to the university, many of which are also associated with
technological and scientific subjects. The loss of importance of regeneration
programmes, spinoff companies and skills provision themes reflected a shift away
from the regional dimension of knowledge exchange, with progressively greater
importance attributed to the achievement of excellence on a national scale rather than
to the involvement in interactions with local stakeholders. The reduced focus on
strategies and policies also suggests a shift away from more intangible aspects of
32
5. Implications: are the incentives created by performance-based funding aligned
with policy goals?
The goals of third mission policy in the UK have evolved from a narrower focus on
supporting technology transfer from university to industry, to a broader focus on
promoting the development of innovation ecosystems where universities engage with
many stakeholders, through different channels and activities, in order to address
complex social and economic challenges.
Can a performance-based funding system support the pursuit of such complex policy
goals for third mission policy? In theory, this might be possible as long as this system
provides incentives for universities to develop third mission strategies that best
exploit their relative strengths and competitive advantages (Sánchez-Barrioluengo
2014) and, within those strategies, encourages them to focus on the activities that
generate the greatest positive socioeconomic impacts.
However, the four arguments that we presented earlier suggest that in practice it is a
challenge to devise a performance-based funding system that supports these complex
goals, and we argue that these challenges are present in the system implemented in the
UK.
(i) Difficulty in identifying which third mission activities should be incentivised.
Policy documents have acknowledged that different universities may adopt different
models of engagement while equally fulfilling their third mission remit (BIS 2012).
However, some forms of engagement are more amenable to performance
measurement: for example, activities that produce returns that can be quantified in
monetary terms, rather than activities whose returns are more intangible. Therefore,
performance measure systems are more likely to focus on the former. In the UK, the
33 strategies, policies and infrastructure has been reduced, while greater importance has
been assigned to activities that can be measured by quantitative indicators, in
particular income. Moreover, the set of quantitative indicators have progressively
focused on a narrower range of activities (Rosli and Rossi 2015), moving away from
skills provision, entrepreneurship and local regeneration, and focusing more on
research contracts, consultancies and especially intellectual property. This seems to
increasingly privilege the collection of quantitative information about the ‘technology
transfer’ model of third mission engagement, which has instead been progressively
abandoned by policy thinking.
(ii) Difficulty in evaluating successful performance. Policy should encourage universities to focus on third mission activities that are more impactful, rather than
simply to engage in a lot of activities with limited impact. Nevertheless, measuring
the impact of third mission activities is difficult (Molas-Gallart et al. 2002) and this
often leads to a focus on measuring engagement. But measuring third mission
engagement and assessing impact are different things, and it cannot be assumed that
certain activities are always impactful and should therefore be promoted (Perkmann et
al. 2013) for all types of universities (Sánchez-Barrioluengo 2014).
In the UK, the formula used to allocate funds has relied on a progressively narrow
range of indicators of engagement, most recently including only income. It has been
observed that higher income does not always mean greater impact (Coates Ulrichsen
2014; Rossi and Rosli 2015), as it can be connected with reputation or with the higher
cost of engaging with stakeholders in particular subjects, while lower income, rather
than denote lack of impact, may be due to engagement with particular types of
beneficiaries, such as disadvantaged socioeconomic groups (Hatakenaka 2005), or to
34 Although these objections do not completely undermine the usefulness of using
income as a guide for tracking impact10, nonetheless the exclusive use of income as a
guide for distributing funding contains an implicit incentive to move away from
activities that are not income-producing (which are poorly measured in the survey, on
the one hand, and do not form the basis for reward, on the other) and, among income
producing activities, to focus on those whose returns are less risky and which are
more highly remunerated.
(iii) Policy goals expressed in terms of quantitative indicators rather than of underlying outcomes, and (iv) performative effects of indicators on institutional behaviour. Because the system rewards institutions whose model of third mission engagement leads them to generate higher income from a certain set of activities, it
could induce some universities to change their strategy of engagement to fit this
model, even when it is not suited to their specific strengths, and when engagement in
other non income-producing activities may be more socially beneficial (Rossi and
Rosli 2015; Lockett, Wright and Wild 2014; Dougherty and Reddy 2013). In
particular, it might encourage universities to see their interactions with businesses
within a context of short-term revenue generation, rather than for longer-term
economic and public benefit (Guldbrandsen and Rasmussen 2012).
The formula used particularly rewards larger institutions (University Alliance 2011;
Coates Ulrichsen 2014), since it is based on income levels rather than on income per
capita or income growth (Rossi and Rosli 2015). Moreover, compared to the more
forward-looking competitive approach, the formula is entirely based on past
35 performance and rewards institutions that have been successful in the past (Coates
Ulrichsen 2014). Making policy choices based upon past accomplishment (Kay 2006)
not only reinforces the status quo, but also stifles variety in the system by hindering
experimentation.
Because of these issues, the funding system is not well aligned with the objective to
support a complex innovation ecosystem in which universities with different
objectives and approaches to their third mission engagement coexist. Policy
documents have recommended the use of sophisticated assessment methods focusing
on long term evaluations, subjective assessment and metrics that are not strictly
economic in nature (Select Committee on Science and Technology 2003; BIS 2012),
which would spread funds more widely across the university sector (HM Treasury
2007). These approaches however imply a greater degree of complexity and possibly
an increase in the cost of implementation.
While, to our knowledge, no studies have so far attempted to empirically assess
whether UK universities’ third mission strategies have actually changed in response to
the incentives generated by the performance-based funding system, and while the
amount of funds distributed through this system is small relative to their overall
public funds allocations (although it is instrumental in producing about a third of
universities’ third mission income, Coates Ulrichsen 2014), it is nonetheless
important to be aware of the incentives that this system is likely to create and of the
potential misalignment with broader policy goals so that similar approaches are not
adopted uncritically elsewhere.
Interestingly, some third mission programmes that used performance-based funding
have moved back to competitive allocation. Guldbrandsen and Rasmussen (2012)
36 reward performance created incentives for technology transfer offices to strategically
change their behaviour in undesirable ways. This led to many changes in the formula
and to its eventual abandonment for purposes of fund allocation. In Scotland, the SFC
claimed that formula-based funding allocations ‘have not resulted in a strong,
strategic focus on Scotland’s biggest challenges or opportunities’ (THE 19 June 2010,
cited in Kitagawa and Lightowler 2012, p.9), recognizing their failure to fulfil broader
policy goals.
6. Conclusions and avenues for further research
To be successful in supporting policy goals, instruments and their implementation
need to be clearly linked to the goals they intend to facilitate. This is particularly
important for a designated third-stream fund such as HEIF, which plays a unique role
in the landscape of third mission policy instruments in the UK: while academics can
access many sources of funds to support their engagement with business and other
stakeholders, HEIF is one of the few instruments that universities can use strategically
at central level to specifically strengthen their third mission activities. For this reason,
and also because of its relatively small size, an instrument such as HEIF should not
just reinforce what universities are already capable of doing with recourse to other
funds, but it probably would be more effective in sustaining the complex innovation
ecosystem envisaged by policymakers, if it allowed universities to experiment with
the third mission strategies that are best suited to their evolving sources of
competitive advantage. Greater experimentation could be allowed by implementing
performance-based funding in a less restrictive way, for example by broadening the
range of indicators used for performance measurement, including the evaluation of
37 allowing the use of different indicators for different institutions or different
departments, acknowledging that the mode of third mission engagement tends to vary
across subject areas. Another approach could be to mix different instruments through
a ‘policy-mix’ approach (Nauwelaers et al. 2009). In complex, unpredictable contexts,
flexibility in achieving a goal is better supported by the concept of equifinality
(Gresov and Drazin 1997; Kapsali 2011), by having different possible trajectories–
paths to reach the goal. The ‘policy-mix’ approach would imply returning to a mix of
different instruments supporting specific types of third mission activities and/or
supporting them in different ways, possibly with greater coordination with the
instruments made available by other funding agencies (research councils, funding
trusts, local governments etc.). This would require interaction between funding
agencies to clarify the characteristics and objectives of the planned instruments
(Dolfsma and Seo 2013) and to coordinate the degree of differentiation between the
instruments, and how they may be coupled with the structure of the policy objectives
(Bach, Matt and Wolff 2014).
While the objective of this work was to showcase the difficulty in aligning the
incentives created by performance-based funding with the complex goals of third
mission policy, the patterns that have emerged from it could be further explored by
investigating the implications of performance based-funding on universities’ strategic
behaviour through empirical analyses exploiting available data on universities’
strategic priorities, income and engagement in different activities.
References