N A N O E X P R E S S
Open Access
Novel Anodic Catalyst Support for Direct
Methanol Fuel Cell: Characterizations and
Single-Cell Performances
N. Abdullah
1, S. K. Kamarudin
1,2*and L. K. Shyuan
1Abstract
This study introduces a novel titanium dioxide carbon nanofiber (TiO2-CNF) support for anodic catalyst in direct
methanol fuel cell. The catalytic synthesis process involves several methods, namely the sol-gel, electrospinning, and deposition methods. The synthesized electrocatalyst is compared with other three electrocatalysts with different types of support. All of these electrocatalysts differ based on a number of physical and electrochemical characteristics. Experimental results show that the TiO2-CNF support gave the highest current density at 345.
64 mA mgcatalyst− 1
, which is equivalent to 5.54-fold that of carbon support while the power density is almost double that of the commercial electrocatalyst.
Keywords:Direct methanol fuel cell, Catalyst support, Titanium dioxide, Carbon nanofiber
Background
A direct methanol fuel cell (DMFC) is one of the most promising candidates for a renewable energy source. It is a power-generating system that produces electrical energy by converting the energy of a chemical liquid (methanol) fuel directly, without auxiliary devices. DMFCs are pow-ered by their exciting possibilities in transportation and stationary application. Moreover, researchers also believe that this system is one of the most promising power sources for many mobile and portable applications, as well as a new alternative to rechargeable battery tech-nology. DMFCs offer many advantages, including a smaller system size and weight. They are also clean energy carriers and lowering pollution. However, des-pite these advantages, they also face problems that hinder their commercialization. The most challenging problems are poor methanol electro-oxidation kinetics and low system performance. The overall cost needs to be reduced and problems such as methanol crossover, dur-ability, stdur-ability, heat, and water management need to be improved for the DMFC to be successful [1–3].
The development of the DMFC began a decade ago by creating many solutions that utilized catalysts. One of the studies regarding the enhancement of DMFC performance analyzed different catalyst support structures, including carbon nanofiber (CNF), carbon nanotube (CNT), carbon nanowire (CNW), and other structure layers. The addition of new material into the catalyst, including a new hybrid catalyst creation, has also become a trend in DMFC evolu-tion [4–6]. Despite this research, problems still exist, espe-cially those related to low catalytic activity, stability, and conductivity for both electronic and protonic operation.
Platinum (Pt) is the best catalyst for both the hydrogen oxidation reaction (HOR) and the oxygen reduction reac-tion (ORR). Despite being effective in electrocatalyst appli-cations [7–10], Pt is expensive, which requires more research to find a new catalyst. Currently, bimetallic platinum-ruthenium (PtRu) is the best catalyst for DMFC. The use of this catalyst reduced Pt loading, which reduced the electrocatalyst cost of DMFC with a standard ratio of 1: 1. The role of Ru in this bimetallic catalyst is to remove the carbon monoxide (CO) from the active sites for the HOR which leads to surpass the CO poisoning of the catalyst [11, 12]. According to a study by Bock et al., PtRu showed su-perior catalytic activity in the DMFC, and it was clear that the catalytic performance strongly depended on the distri-bution of Pt and Ru sites at the atomic level [13]. However,
* Correspondence:[email protected]
1Fuel Cell Institute, Universiti Kebangsaan Malaysia, 43600 Bangi, Selangor, Malaysia
2Department of Chemical and Process Engineering, Universiti Kebangsaan Malaysia, 43600 Bangi, Selangor, Malaysia
the problem of low methanol oxidation cannot be solved using the PtRu catalyst, so further alteration of the catalyst must be undertaken to assist the fuel cell industry.
Metal oxides are the most prominent materials used to improve the electrocatalysis of DMFC. Titanium dioxide (TiO2), also known as titania, is an inorganic substance that is naturally stable, non-flammable, and highly resistant to corrosion. Titania is also not categorized as a hazardous substance by the United Nations (UN) Globally Harmo-nized System (GHS) of Classification and Labelling of Che-micals. In addition, the crystal structures of TiO2 are thermodynamically stable and help to create a composite material with good electrochemical and thermal stability [14]. The charge carriers from the anatase form become ex-cited deeper in the bulk material, create more surface reac-tions, and incrementally improve the catalytic activity [15]. The electronic behavior of the material is enhanced when the interaction between the TiO2metal oxide and the other material occurs. This enhancement can also improve the oxidation activity by lowering the CO oxidation potentials [6]. The use of TiO2as a support for the metal catalyst af-fects the reaction kinetics and the reaction mechanism [16]. TiO2has all of the previously listed benefits for many appli-cations in various industries. Despite these benefits, the main problem precluding its widespread use for fuel cell applications is its low conductivity. However, to overcome this problem, high loadings of a Pt catalyst over TiO2 composited with an electric conducting material, such as N-doped carbon, and the employment of substoichiometric TiO2are required [5].
This study reported the synthesis and characterization of titanium dioxide-carbon nanofiber (TiO2-CNF) de-posited on a platinum-ruthenium (PtRu) catalyst for the DMFC application. The objective of the study was to synthesize the composite electrocatalyst with TiO2 in a nanofiber structure that can reduce the poisoning effect of the catalyst while enhancing the catalytic activity to improve the DMFC performance more than the com-mercial PtRu/C electrocatalyst. TiO2-CNF was prepared by electrospinning, followed by carbonization; finally, PtRu was deposited with an annotation of PtRu/TiO2 -CNF. To characterize the prepared PtRu/TiO2-CNF composite electrocatalyst with different supports, X-ray diffraction (XRD), Brunauer-Emmett-Teller (BET), scan-ning electron microscope (SEM), and transmission elec-tron microscope (TEM) were used. The performance of the electrocatalyst was evaluated by cyclic voltammetry (CV), electrochemical surface area (ECSA), Tafel ana-lysis, chronoamperometry (CA), and DMFC single cell. All performance information was compared with several other supports, including C, CNF, and TiO2. Based on the experimental results, the effect of using the metal oxide as a support to improve the catalytic activity in the DMFC was discussed.
Methods
Materials
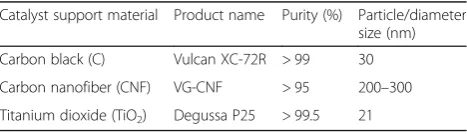
Titanium isopropoxide (TiPP, 97%) was obtained from Sigma-Aldrich Co., Ltd. Poly(vinyl acetate) (PVAc (Mw 500,000)), dimethylformamide (DMF (99.8%)), and acetic acid (99.7%) were received from Sigma-Aldrich Co., Ltd. Ethanol (99.8%) was purchased from R&M Chemical Reagents. These chemical reagents were used for nanofi-ber preparation. The deposition included a Pt precursor, H2PtCl6(40% content), from Merck, Germany, and a Ru precursor, RuCl3 (45–55% content) and reducing agent, sodium borohydride (NaBH4, 96%), from Sigma-Aldrich Co., Ltd. The commercial catalyst support for C, CNF, and TiO2 nanopowder were obtained from Cabot Corporation, Cheap Tubes Inc., and Sigma-Aldrich Co., Ltd., respectively. The detailed properties for the catalyst support are tabulated in Table 1. All chemical reagents were used without further purification.
Preparation of the TiO2-CNF
TiO2-CNF was synthesized using the sol-gel method and electrospinning technique. The PVAc (11.5 wt%) solution was prepared by dissolving the polymer with DMF for 1 h at a temperature of 60 °C and was continuously stirred overnight. 50 wt% of TiPP and a few drops of ethanol and acetic acid were mixed into the PVAc solution and stirred with a homogenizer until the mixture was homogenous. The mixed solution was fed from a syringe with a stainless steel needle for the electrospinning technique at a con-stant rate of 0.1 mL h−1, an applied voltage of 16 kV, and a distance of 18 cm between the tip and collector. The electrospun nanofiber was dried for 5 h at room temperature and continued to stabilize at 130 °C for 8 h. The fiber was carbonized using a tube furnace at 600 °C for 2 h in a nitrogen atmosphere. The calcined fiber then underwent a size controlling process using a mortar and pestle before further use in this study.
Preparation of the Composite Electrocatalyst
[image:2.595.305.539.666.733.2]All the electrocatalysts were synthesized using the depos-ition method by chemical reduction of NaBH4. The 20 wt% of PtRu with the atomic ratio 1:1 is loaded onto different catalyst supports, which are synthesized support, TiO2 -CNF, and another three commercial supports, C, CNF and TiO2. A mixture of deionized water (DI water) and isopro-pyl alcohol (IPA) was added to the support material and
Table 1Properties of commercial catalyst support
Catalyst support material Product name Purity (%) Particle/diameter size (nm)
Carbon black (C) Vulcan XC-72R > 99 30
Carbon nanofiber (CNF) VG-CNF > 95 200–300
sonicated for 30 min. The precursors were mixed into the support mixture and were continuously stirred for another 30 min until the solution was well mixed. The pH value of the solution was adjusted to 8 using a 1 M NaOH solution. Then, the temperature of the solution was increased to 80 °C. A 25-mL volume of a 0.2-M solution of NaBH4was added dropwise into the solution and stirred for an add-itional hour. The mixture was cooled, filtered, and repeat-edly washed with DI water. The electrocatalyst powder was dried for 3 h at 120 °C under a vacuum and crushed with a pestle and mortar to obtain a fine powder.
Characterization of the Electrocatalyst
The X-ray diffraction (XRD) pattern and crystal structure for all of the electrocatalysts were investigated with an X-ray diffractometer (D8 Advance/Bruker AXS Germany) using powdered samples and operated at 40 kV and 20 mA. The surface area and pore size analysis using BET was handled by Micromeritics ASAP 2020 in the nitrogen ad-sorption/desorption isotherm condition at 77 K. A study of the surface morphology for the electrocatalyst-supported nanofibers and the prepared electrocatalyst was conducted using field emission scanning electron microscopy (FESEM (SUPRA 55 VP)). Mapping analysis was done to observe the distribution of the elements on a selected area in com-posite electrocatalyst. The detailed structure of the support
and composite electrocatalyst was analyzed with high-resolution images obtained via transmission electron mi-croscopy (TEM (Tecnai G2 F20 X-Twin)).
Evaluation of the Electrochemical Measurement
[image:3.595.58.538.87.384.2]Electrochemical measurements were evaluated by the Autolab electrochemical workstation. The methanol oxi-dation reaction (MOR) activity for the electrocatalyst was measured using the cyclic voltammetry (CV) of a three-electrode cell system. This system used a glassy carbon electrode (GCE, 3-mm diameter) as the working electrode and Pt and silver/silver chloride (Ag/AgCl) electrodes as the counter and reference electrodes, respectively, oper-ated at room temperature. The working electrode must be cleaned with polish paper and alumina before being used. The preparation of the electrocatalyst ink for the working Fig. 1X-ray diffraction patterns.aTiO2-CNF,bPtRu/TiO2-CNF, andccompared electrocatalysts
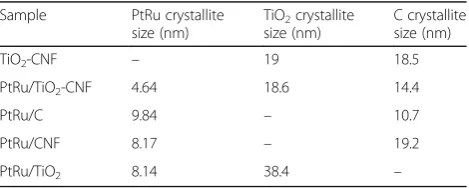
Table 2PtRu, TiO2, and C crystallite sizes for all samples
Sample PtRu crystallite size (nm)
TiO2crystallite size (nm)
C crystallite size (nm)
TiO2-CNF – 19 18.5
PtRu/TiO2-CNF 4.64 18.6 14.4
PtRu/C 9.84 – 10.7
PtRu/CNF 8.17 – 19.2
[image:3.595.305.540.638.732.2]electrode was ultrasonically dispersed with 15 mg of the electrocatalyst in a mixture of 400μL of DI water, 400μL of IPA, and 125μL of Nafion solution (5 wt%) for 30 min. A micropipette was used to transfer 2.5μL of electrocata-lyst ink onto a GCE. The working electrode was air-dried for 1 h at room temperature and then heated in an oven for 30 min at 80 °C. The working electrode was then ready for CV measurement. A solution of 0.5 M H2SO4in 2 M methanol was prepared as an electrolyte. This electrolyte solution was bubbled with nitrogen gas (N2) for 20 min to achieve the oxygen-free content. The CV measurement was performed at a scan rate of 20 mV s−1, and the range of potentials was from 0 to 1.1 V vs. Ag/AgCl. The long-term performance of all electrocatalysts was assessed using chronoamperometry (CA) in the electrolyte solution at a potential of 0.5 V for 3600 s.
MEA Fabrication
Membrane electrode assembly (MEA) consists of three main parts: membrane, anode, and cathode. Nafion 117 is selected as a membrane, and the membrane is treated to re-move the impurities using hydrogen peroxide (H2O2) and DI water as applied in Hasran et al.’s [17] study. The treated membrane is stored in the beaker filled with DI water until it is ready to be used. Carbon cloth is used as the anode and cathode backing layer. This carbon cloth is treated with 5 wt% of polytetrafluoroethylene (PTFE) to make it water-proof. The carbon cloth is immersed into the PTFE solu-tion and dried in the furnace for 30 min at 380 °C. The backing layer is coated with a gas diffusion layer of carbon, where the loading is 2 mg cm−2. The carbon is mixed with the IPA and Nafion dispersion D520 (Dupont). The carbon slurry is casted onto the carbon cloth and dried in the oven at 100 °C for 1 h. Then, the electrocatalyst layer is ready to be coated and synthesized by PtRu/TiO2-CNF and commercial electrocatalyst PtRu/C, used for the anode part, and Pt/C for cathode part. 2 mg cm−2 loading of electrocatalyst is added with IPA (1100 μL), DI water (300 μL), and Nafion dispersion (24 mg). The solution is dispersed in the homogenizer for 1 min and casted onto the carbon cloth. The anode and cathode are dried in the oven for 1 h at 100 °C. The anode and cathode are clamped together with membrane in the middle using hot press at the condition of 135 °C and 50 kPa for 3 min. The MEA is ready to be used in single-cell performance testing.
Single-Cell Performance Testing
Performance testing of DMFC single cell was conducted in passive condition and room temperature. The MEA with a 4-cm2 active area is stated on the single cell, where the anode part is fixed at the methanol tank. Ten milliliters of 3 M methanol is fueled into the tank and tested using potentiostat/galvanostat (WonATech, Korea). The cell polarization curve is obtained for different electrocatalysts.
Results and Discussion
Structural Characterization
The pattern and crystal structure of fabricated catalyst sup-port, TiO2-CNF, synthesized electrocatalyst, PtRu/TiO2 -CNF, and other electrocatalysts (PtRu/C, PtRu/-CNF, and PtRu/TiO2) were investigated by XRD analysis. This ana-lysis was completed using an X-ray diffractometer in the range of 5°–90° with 2θ, as shown in Fig.1. The result for synthesized TiO2-CNF shows the existence of all materials, TiO2, and C. The diffraction peak of 25° (1 0 1) represents the TiO2anatase structure, while peak at 27° (1 1 0) is the TiO2rutile structure. These existing structures form in tet-ragonal structure (crystallographic structure for anatase and rutile) [18]. However, this sample had the anatase structure because the TiO2structure changed from anatase to rutile while the sample was exposed to temperatures higher than 700 °C [19], whereas the temperature used in this research was only 600 °C.
The TiO2-CNF shows more diffraction peaks for TiO2 anatase at 38° (1 1 2), 48° (2 0 0), 55° (2 1 1), 63° (2 0 4), 69° (1 1 6), and 75° (2 1 5), while those of TiO2rutile are 36° (1 0 1), 41° (1 1 1), and 54° (2 1 1). The carbon shows at the diffraction peaks of 31° (1 1 0) and 55° (2 1 1) in cubic structure. The XRD pattern for PtRu/TiO2-CNF electrocatalyst shows the diffraction peak for all the elec-trocatalysts involved, Pt, Ru, TiO2, and C. The peak for TiO2and C is almost same with the TiO2-CNF sample, and the Pt and Ru stand out with another four peaks for each material, which is Pt at 39.7° (1 1 1), 46.2° (2 0 0), 67. 5° (2 2 0), and 81.3° (3 1 1). The diffraction peaks for Ru are 40.7° (1 1 1), 47° (2 0 0), 69° (2 2 0), and 83.7° (3 1 1). Both of these metals come in the cubic structure. The syn-thesized electrocatalyst is compared with a few electroca-talysts supported with different catalyst supports, namely carbon black (PtRu/C), carbon nanofiber (PtRu/CNF), and titanium dioxide nanoparticle (PtRu/TiO2), and the dif-fraction pattern is figured out in Fig.1c.
High Bragg angles were clearly visible, especially in the range of 25°–60° for the entire electrocatalyst sample. This showed that there was a bimetallic or alloy inter-action that occurred in the catalyst [20]. A weak and broad intensity was observed for all of the electrocatalyst samples, which illustrates high dispersions in the pre-pared sample. The crystallite size was measured using the Debye-Scherrer equation [8]; crystallite size = 0.98α/
Surface area and porosity analysis of all electrocata-lyst samples were analyzed using BET analysis. The ni-trogen absorption/desorption isotherm is carried out at 77 K. The surface area, total pore volume, and average pore diameter of PtRu/TiO2-CNF, PtRu/C, PtRu/CNF, and PtRu/TiO2 electrocatalysts are listed in Table 3. The BET surface area for the nanofiber structure of metal oxide composite, PtRu/TiO2-CNF electrocatalyst, shows the lowest value with 50.59 m2/g, followed by PtRu/CNF, PtRu/TiO2, and PtRu/C electrocatalysts in ascending order. The results obtained in this study are close with the results of BET surface area conducted by other study [6], where PtRu/C electrocatalyst shows a much higher surface area compared to metal oxide composite electrocatalyst.
The total pore volume,VTotal pore, shows results in as-cending order initiated by PtRu/TiO2-CNF < PtRu/CNF < PtRu/TiO2< PtRu/C (0.227 < 0.370 < 0.529 < 0.734). The re-sult pattern of the total pore volume and BET surface area is the same, indicating that an increase in the volume of the pore volume can increase the overall surface area of the electrocatalyst. Reduction of surface area and pore volume of PtRu/TiO2-CNF electrocatalyst is due to exposure and use of carbonization temperature up to 600 °C; meanwhile, other electrocatalyst do not undergo carbonization and exposure to high temperatures. This is due to the sintering effect, which subsequently leads to the growth of particles and crystallization [21].
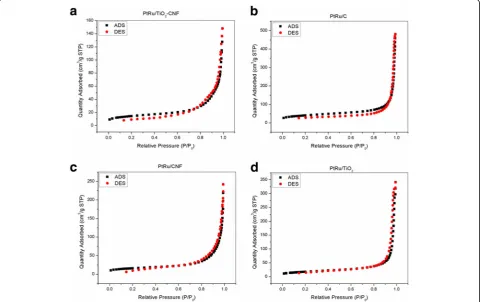
The nitrogen adsorption/desorption isotherm graphs at 77 K for all electrocatalysts are summarized in Fig.2. The results show that the pores for all electrocatalyst samples highlight mesoporous properties, which have an average diameter within the range of 2–50 nm, which can largely be attributed to the large gap found in the electrocatalyst lattice. This type of electrocatalyst has the ability to increase the level of distribution and homogen-eity of the immobilized catalyst, resulting in improving stability and catalytic activity [22].
[image:5.595.57.291.110.188.2]The average pore diameter of the four electrocata-lyst samples tested was between 22 and 33 nm, and the pore diameter of the PtRu/TiO2-CNF showed the
Table 3BET analysis results for electrocatalyst PtRu/TiO2-CNF,
PtRu/C, PtRu/CNF, and PtRu/TiO2 Electrocatalyst SBET(m2/g) VTotal pore
(cm3/g)
VMicro (cm3/g)
DPore (nm)
PtRu/TiO2-CNF 50.59 0.227 0.0046 22.39
PtRu/C 143.92 0.734 0.0127 32.94
PtRu/CNF 55.46 0.370 0.0047 27.69
PtRu/TiO2 62.32 0.529 0.0016 32.10
[image:5.595.58.539.411.713.2]lowest diameter compared to other electrocatalysts. Small diameter size illustrates the size of the particle as a whole. The small particle size has a high surface-to-volume ratio and potentially results in in-creasing surface reactivity and solubility and able to alter the toxicity profile of the substance. In addition, ob-servation on the nitrogen adsorption/desorption isotherm graph appears flat at relatively low pressure (P/Po≤0.6), which may be due to the absorption of micropore in the sample. At a relatively high-pressure area (0.6 <P/Po< 1.0) , there is an increment in sample adsorption capability due to the adsorption of monolayer and/or multilayer ni-trogen molecules in the meso-structure.
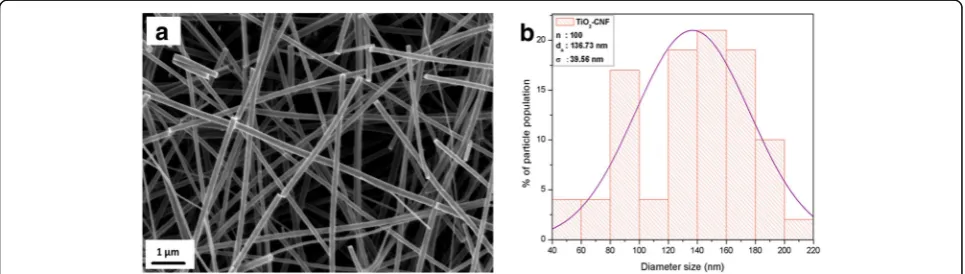
Figure9shows the SEM images for the nanofiber sup-port, TiO2-CNF. The image illustrates that the nanofiber is produced smoothly without any agglomerates, beads, or connected nanofibers, which happens because of equivalent electrospinning parameters [23]. The distribu-tion for the diameter size of TiO2-CNF is investigated by collecting 100 diameter measurements for this catalyst support and analyzed by the “Origin Software,” and the distribution diameter size is 136.73 ± 39.56 nm in the range of 90–170 nm.
The prepared electrocatalyst, PtRu/TiO2-CNF, also underwent SEM analysis, and the image is shown in Fig. 10. Figure 10a is the catalyst deposited on the
support, PtRu/TiO2-CNF, after the milling process. The SEM image spotted the long fiber is covered with Pt and Ru nanoparticles. However, the image shows some ag-glomeration of Pt and Ru nanoparticles. To see the distri-bution of Pt and Ru, the mapping is shown in Fig.10bfor Pt and Fig. 10cfor Ru. The results of the mapping illus-trated that both metals were uniformly dispersed on the nanofiber; however, some agglomeration occurred for Pt due to an error during the deposition process. The agglomeration of nanoparticles was a reaction result because of overusing the NaOH solution during the pH adjustment for the deposition process [24].
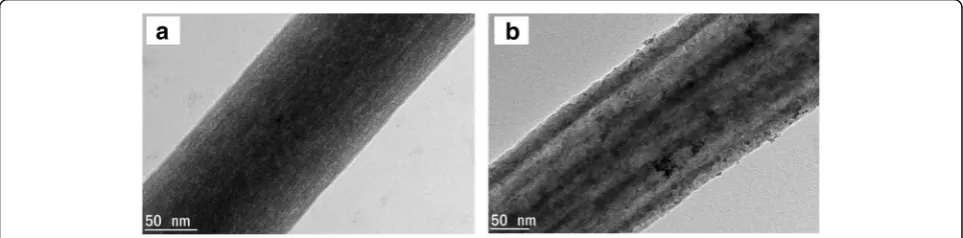
The TEM images for the prepared catalyst support, TiO2-CNF, and electrocatalyst, PtRu/TiO2-CNF, are shown in Fig. 11. The TEM images of catalyst support Fig. 11a show that the TiO2 was homogenously dis-persed in a 136-nm diameter of carbon nanofiber, due to the homogenous dispersion of polymer solution and TiO2precursor during sol-gel method. Figure11bshows the image of catalyst deposited on TiO2-CNF, where PtRu particles with a diameter of approximately 7 nm were deposited on the TiO2-CNF and exposed to the TiO2surface. This connection and the exposure to TiO2 can produce a more active reaction spot during the per-formance. However, the PtRu particles agglomerated and were not homogenously distributed on the nanofiber surface.
Electrochemical Characterization
The electrochemical characterization is applied to all catalysts, to see their potential and performance as anodic catalyst in DMFC. There are two main measure-ments in this section, which is cyclic voltammetry (CV), to measure electrocatalytic performance, and chronoam-perometry (CA), to test long-term stability and durability of the samples. Figure 3 shows the CV profiles of all catalysts in 0.5 M H2SO4solution in the potential range between −0.2 and 1.2 V. The hydrogen adsorption/de-sorption region, in the range of −0.2 to 0.1 V, is also indicated as the electrochemical active surface area (ECSA) is calculated. The ECSA is the estimation of PtRu nanoparticles surface area in the electrocatalyst [25]. The procedure involved a cycle of electrode current in the voltage range, where the charge transfer reactions are adsorption-limited at the activation sites. The total Fig. 3Cyclic voltammetry profiles of the different catalyst supports,
[image:6.595.57.291.87.262.2]PtRu/TiO2-CNF, PtRu/CNF, PtRu/C, and PtRu/TiO2in 0.5 M H2SO4 solution at the scan rate of 20 mV s−1
Table 4Comparison of the current density results with the different catalyst supports
Catalyst ECSA, [m2/gPtRu] Peak potential, [V vs. Ag/AgCl]
Onset potential, [V vs. Ag/AgCl]
Peak current density, [mA/mgPtRu]
CO tolerance, If/Ibratio
PtRu/TiO2-CNF 10.4 0.639 0.305 345.64 4.73
PtRu/C 0.94 0.657 0.388 62.336 2.13
PtRu/CNF 8.4 0.542 0.315 186.29 15.4
[image:6.595.55.544.653.732.2]charge required for monolayer adsorption/desorption is used as reactive surface sites for ECSA [26]. The evaluated ECSA result is reported in Table 4. ECSA for the CV measurement was determined using the equation below:
ECSA m2g−Pt1¼ Q
Γ:WPt
where Q is the charge density or area under the graph ((C) of CV experiment), Γ (2.1 CmPt−2) is the constant for the charge required to reduce the proton monolayer on the Pt, and WPt is the Pt loading (gPt) on the electrode. The ECSA calculation results show that the synthesized electrocatalyst, PtRu/TiO2-CNF, has the highest value of 10.4 m2gPtRu−1, followed with PtRu/CNF (8.4 m2/gPtRu), PtRu/C (0.94 m2gPtRu−1), and PtRu/TiO2 (0.76 m2 gPtRu−1). This happened because of several key
factors. One of them is the crystallite size of PtRu, as mentioned in Table 2 from XRD analysis; the PtRu crystallite size for PtRu/TiO2-CNF is the smallest and shows a high ECSA value. The smallest crystallite size can elicit an increase in the catalyst and reaction surface area. The trend of crystallite size is followed with the trend of ECSA value for PtRu/CNF and PtRu/C. However, PtRu/ TiO2sample supposedly can produce higher ECSA value than PtRu/C, since the crystallite size is smaller, but the ECSA obtained is lower. This may happen due to the agglomeration of PtRu particle in the sample. This agglomeration can reduce the potential surface area to react and decrease the ECSA.
The electrocatalytic performance of synthesized elec-trocatalyst and other elecelec-trocatalyst was analyzed with CV as illustrated in Fig.4. The CV curve for the electro-catalysts, including PtRu/TiO2-CNF, PtRu/C, PtRu/CNF, and PtRu/TiO2, is measured in 2 M methanol with 0. 5 M H2SO4with saturated N2gas at room temperature. The multiple curves are measured within the potential
Fig. 4CV in 2 M methanol and 0.5 M H2SO4at the scan rate of 20 mV s−1.aPtRu/TiO
[image:7.595.306.539.111.254.2]2-CNF and PtRu/CNF.bPtRu/C and PtRu/TiO2
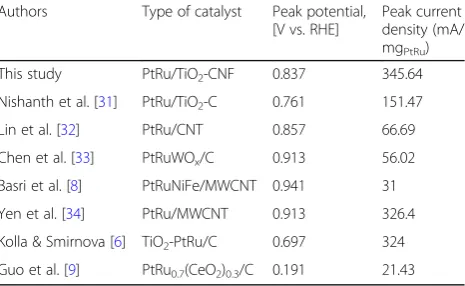
Table 5Comparison of the performance results with the previous study
[image:7.595.56.292.331.703.2] [image:7.595.305.538.517.702.2]Authors Type of catalyst Peak potential, [V vs. RHE]
Peak current density (mA/ mgPtRu)
This study PtRu/TiO2-CNF 0.837 345.64
Nishanth et al. [31] PtRu/TiO2-C 0.761 151.47 Lin et al. [32] PtRu/CNT 0.857 66.69 Chen et al. [33] PtRuWOx/C 0.913 56.02 Basri et al. [8] PtRuNiFe/MWCNT 0.941 31 Yen et al. [34] PtRu/MWCNT 0.913 326.4 Kolla & Smirnova [6] TiO2-PtRu/C 0.697 324 Guo et al. [9] PtRu0.7(CeO2)0.3/C 0.191 21.43
range of−0.1 to 1.1 V vs. Ag/AgCl. Figure 4shows that the peak current density in decreasing order was PtRu/ TiO2-CNF > PtRu/CNF > PtRu/C > PtRu/TiO2. The peak current density of PtRu/TiO2-CNF for the MOR appeared to be approximately 0.639 V vs. Ag/AgCl. The peak current density and other CV values for all of the samples are reported in Table4. The current density value for the PtRu/TiO2-CNF catalyst is 345.64 mA(mgPtRu)−1, which are 1.85 and 5.54 times higher than PtRu/CNF and commercial electrocatalyst, PtRu/C. This shows that the TiO2-CNF catalyst support was a better substitute for the carbon black catalyst support. This is because the nanofiber mixture, through the carbonization process, can increase the electro- and thermal conductivity of the catalyst [27].
Nanofiber structure in the composite electrocatalyst can increase the overall surface area and active reac-tion site on electrocatalyst surface area. Another ad-vantage was the presence of high anatase TiO2 composition as resulted in XRD analysis. Higher elec-trocatalytic activity is acquired by anatase than rutile TiO2. The metal-support interaction also shows posi-tive effect with higher peak current density, where the material combination between PtRu and TiO2-CNF exhibits a successful combination for electrocatalyst in DMFC. The second highest of peak current density with the value of 186.29 mA/mgPtRu belongs to PtRu/
[image:8.595.61.540.86.381.2]CNF that is 2.99 times higher than commercial elec-trocatalyst, PtRu/C. This result is matched with the study by Zainoodin et al. [28] and Ito et al. [29]. The similarity of PtRu/TiO2-CNF and PtRu/CNF is the nanofiber catalyst support structure. The high peak current density for both samples demonstrates that the nanofiber can give an outstanding performance of methanol oxidation due to the capability of nanofiber to increase the electrocatalyst surface area and en-hance catalytic activity. The performance for PtRu/C is much lower than that which resulted from the ag-glomeration of PtRu, where the ECSA value and crys-tallite size from XRD are featured. This situation reduces the potential of the electrocatalyst surface to be an active site and lowers the performance of elec-trocatalyst. The very low activity of PtRu/TiO2 was due to the nature of the TiO2 catalyst support having low electrical conductivity [4]. These results clearly Fig. 6Tafel plot of the electrocatalystaPtRu/TiO2-CNF,bPtRu/CNF,cPtRu/C, anddPtRu/TiO2
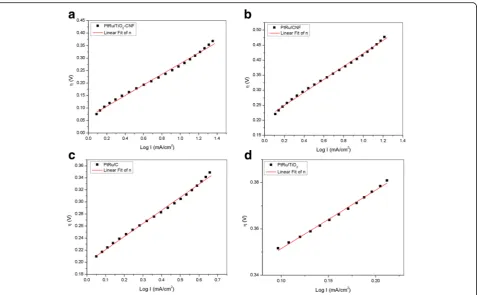
Table 6Data extraction from the Tafel plot
Type of catalyst Tafel slope,ba (mV/dec)
Ionic exchange current density,jo(mA/cm2)
Standard deviation,R2
PtRu/TiO2-CNF 214 0.501 0.995
PtRu/CNF 217 0.112 0.997
PtRu/C 217 0.112 0.996
[image:8.595.304.540.653.732.2]show that the electro-conductive medium was essen-tial for the catalyst systems for an electrochemical re-action [30].
The multiple CV curves in Fig.4a,bshow the reversed scan, and the small oxidation peak appears between 0.4 and 0.57 V vs. Ag/AgCl. Formation of incomplete oxi-dized carbonaceous species during the first oxidation peak resulted in the small oxidation on reversed scan also known as reversed oxidation peak [31]. This oxida-tion peak shows the tolerance of electrocatalyst towards the carbonaceous species by calculating the ratio of for-ward (If) and reversed (Ib) oxidation peak. The oxidation peak ratio called as CO tolerance is tabulated in Table4. The result shows that both samples using nanofiber sup-port, PtRu/TiO2-CNF, and PtRu/CNF have the highest electrocatalyst tolerance against carbonaceous species, which means these can lower the catalyst poisoning potential, with the ratio exceeding 4.7 respectively. This result shows that nanofiber structure and the combin-ation of metal oxide in electrocatalyst can reduce the main problem faced by DMFC technology and have high potential to replace the commercial support used in this technology.
The synthesis electrocatalyst, PtRu/TiO2-CNF, is com-pared with other PtRu-based electrocatalyst, nanostruc-tured catalyst support, and combination of metal oxide in electrocatalyst for DMFC technology and shown in Table5. The result shows that the peak current density for PtRu/ TiO2-CNF is the highest among other electrocatalysts. However, the high value of current density is obtained by using the nanostructure catalyst support and TiO2as one of the side material in the composite electrocatalyst. Even though there are several different types of metal oxide used in the other study, the performance shows a gap with the TiO2-utilized electrocatalyst.
Other than CV, linear sweep voltammetry (LSV) is one of the important electrochemical studies of electroactive substance. LSV is quite similar to CV, which measures the current response as a voltage function. Figure 5 shows the LSV plot for all the electrocatalysts that were measured in 2 M methanol and 0.5 M H2SO4at the scan rate of 20 mVs−1in the N2gas environment. The result shows that the synthesized electrocatalyst, PtRu/TiO2 -CNF, shows the highest current density that was calculated over the electrode surface area. The trend of the current density for LSV and CV is equalized. The Fig. 7CA curve at potential of 0.5 V vs Ag/AgCl for PtRu/TiO2-CNF, PtRu/C, PtRu/CNF, and PtRu/TiO2catalysts
[image:9.595.58.541.88.242.2] [image:9.595.60.539.572.715.2]LSV point shows the rising region between 0.5 and 0. 7 V vs Ag/AgCl, and this region is known as a Tafel region that appeared when the electron transfer kinetics occur in the electrocatalyst surface [32]. The LSV data is extracted to present Tafel plot, where it relates the electrochemical reaction rate to the overpotential.
The Tafel plot of overpotential, E, against log Iis pre-sented in Fig. 6, and data extraction of the plot is tabu-lated in Table6. This plot can provide and calculate the slope of anodic Tafel plot (ba) and ionic exchanging current density (j) from the slope and interception of the Tafel plot. Anodic Tafel slope,ba, for all the electrocata-lyst has not much difference in value, while the ionic ex-change current density gives a big gap between each electrocatalyst. The ionic exchange current density is also known as a catalytic activity explainer [33]. The j for all electrocatalysts shows the difference, where the highest value belongs to PtRu/TiO2-CNF with the value of 0.5012 mA cm−2. This result demonstrates that the synthesized electrocatalyst can produce the highest catalytic activity of bimetallic PtRu compared with other electrocatalyst. Even though the bimetallic composition for all the electrocatalysts is same, the synthesized electrocatalyst gets a greater help from the metal oxide in producing the highest active area for catalytic activity. PtRu/CNF and PtRu/C electrocatalysts have the same value, while PtRu/TiO2 has the lowest of ionic exchange current density with 0.112 and 0.046 mA cm−2, respectively.
The CA experiments were conducted to determine the stability and durability of the electrocatalyst for the long-term performance of MOR in a 2-M solution of methanol containing 0.5 M H2SO4 for 3600 s. Figure 7 shows the CA curve for the PtRu/TiO2-CNF, PtRu/C, PtRu/CNF, and PtRu/TiO2 electrocatalysts at a constant potential, 0.5 V. The current density of PtRu/TiO2 electrocatalysts shows the effect of a sharp drop at the start of the experiment, possibly due to the effect of poisoning by methanol oxidation medi-ation. The PtRu/TiO2-CNF, PtRu/CNF, and PtRu/C electrocatalysts showed a slight decline of approxi-mately 5 and 3% in current density, respectively. After 3600 s, all of the electrocatalysts were stable, and the reducing current density ratios in increasing order are as follows: PtRu/CNF (6.16) < PtRu/TiO2-CNF (6.54) < PtRu/C (11.66) < PtRu/TiO2 (14.82). The PtRu/TiO2 -CNF electrocatalyst showed the reducing current density ratio is slightly higher than PtRu/CNF, but this electrocatalyst reached the highest current density of all the electrocatalysts. This was due to good dis-persion of the catalyst support and also to increased use of catalysis [6].
DMFC Single-Cell Performance
[image:10.595.57.291.110.202.2]The synthesized electrocatalyst, PtRu/TiO2-CNF, with the highest electrochemical/half-cell performance was tested with single-cell performance. The performance is compared with commercial electrocatalyst, PtRu/C, using same composition, 20 wt% of PtRu. The 4-cm2 anode electrocatalyst layer clamped with cathode and membrane to be MEA, ready for single-cell performance using 3 M methanol of passive system. Figure 8 shows the current–voltage curve for PtRu/TiO2-CNF and PtRu/C. The PtRu/TiO2-CNF showed the highest per-formance compared to the commercial electrocatalyst, which is 1.66 times higher. The maximum power density for synthesized electrocatalyst was 3.8 mW cm−2, while PtRu/C was 2.2 mW cm−2.
Table 7Comparison of the single-cell performance results with the previous study
Study Catalyst Catalyst loading (mg/cm2)
Power density (mW/cm2)
This study PtRu/TiO2-CNF 2 3.8
This study PtRu/C 2 2.20
Shimizu et al. [35] PtRu/C 2 3 Hashim et al. [36] PtRu/C 2 1.7 Tang et al. [37] PtRu/C 2 3.3
[image:10.595.57.540.576.713.2]The best PtRu/TiO2-CNF performance is confirmed by comparing this result with the previous study of com-mercial PtRu/C electrocatalyst, using the same catalyst loading in passive mode system that is tabulated in Table7. The overall electrochemical and single-cell per-formance conclude that the combination of bimetallic catalyst, PtRu, and introduction of metal oxide nanofiber with carbon nanofiber have high potential to be replaced with PtRu/C in DMFC technology (Figs. 9, 10, and11). By using the low composition of bimetallic catalyst and electrocatalyst loading, the synthesized electrocatalyst reveals the superior DMFC performance.
Conclusions
[image:11.595.59.537.86.395.2]The TiO2-CNF was synthesized using an electrospin-ning method and applied in the DMFC as a catalyst support for an anodic catalyst. The catalytic activity for the electrocatalyst was prepared for different catalyst supports including PtRu/TiO2-CNF, PtRu/C, PtRu/ CNF, and PtRu/TiO2, which were compared with one another. The results showed that the prepared electrocata-lyst, PtRu/TiO2-CNF, had the highest current density, which was 5.54 times higher than that of the commercial electrocatalyst, PtRu/C. The DMFC single-cell perform-ance of PtRu/TiO2-CNF reveals the superior performance Fig. 10PtRu/TiO2-CNF catalyst after deposition and milling.aSEM images (magnification × 30,000),bmapping of Pt nanoparticles, andc
[image:11.595.57.539.595.714.2]mapping of Ru nanoparticles
almost twice higher than that of PtRu/C. The highest cata-lytic activity was due to the nanofiber catalyst structure and the introduction of TiO2as the catalyst support. The reaction with the metal support interface between the PtRu and TiO2-CNF catalysts helped to improve the prop-erties of the catalyst layer. PtRu/TiO2-CNF is a promising candidate for support of the anode catalyst in DMFCs.
Abbreviations
BET:Brunauer-Emmett-Teller; CA: Chronoamperometry; CNF: Carbon nanofiber; CNT: Carbon nanotube; CNW: Carbon nanowire; CV: Cyclic voltammetry; DI: Deionized; DMF: Dimethylformamide; DMFC: Direct methanol fuel cell; ECSA: Electrochemical surface area; GCE: Glassy carbon electrode; GHS: Globally Harmonized System; HOR: Hydrogen oxidation reaction; IPA: Isopropyl alcohol; LSV: Linear sweep voltammetry; MEA: Membrane electrode assembly; MOR: Methanol oxidation reaction; ORR: Oxygen reduction reaction; PTFE: Polytetrafluoroethylene;
SEM: Scanning electron microscope; TEM: Transmission electron microscope; UN: United Nations; XRD: X-ray diffraction
Acknowledgements
The authors gratefully acknowledge the financial support given for this work by the Universiti Kebangsaan Malaysia under DIP-2017-021.
Funding
The study received financial support from the Universiti Kebangsaan Malaysia: DIP-2017-021.
Availability of Data and Materials
The data will not be shared due to privacy and confidentiality for the purpose of patent filling.
Authors’Contributions
This study introduces a novel Titanium Dioxide Carbon Nanofiber (TiO2-CNF) support for anodic catalyst in Direct Methanol Fuel Cell. The catalytic synthesis process involves several methods, namely the sol-gel, electrospin-ning and deposition methods. This study proves that the TiO2-CNF support capable to improve the performance of the commercial catalyst for Direct Methanol Fuel Cell. All authors read and approved the final manuscript.
Authors’Information
Mrs Norulsamani Abdullah is a student of the Fuel Cell Institute, Universiti Kebangsaan Malaysia, Malaysia.
Prof Ir. Dr Siti Kartom Kamarudin is the Director of the Fuel cell Institute, Universiti Kebangsaan Malaysia, Malaysia.
Dr Loh Kee Shyuan is a Fellow of the Fuel Cell Institute, Universiti Kebangsaan Malaysia, Malaysia.
Competing Interests
We confirm that the work described has not been published before, it is not under consideration for publication anywhere else, and publication has been approved by all co-authors and the responsible authorities at the institute(s) where the work was carried out. The authors declare that they have no com-peting interests.
Publisher’s Note
Springer Nature remains neutral with regard to jurisdictional claims in published maps and institutional affiliations.
Received: 7 December 2017 Accepted: 15 March 2018
References
1. Shah R (2007) Introduction to fuel cells, in recent trends in fuel cell Science and Technology. New York, Springer, p 1–9.
2. Dillon R et al (2004) International activities in DMFC R&D: status of technologies and potential applications. J Power Sources 127(1–2):112–126 3. Abdullah N, Kamarudin S (2015) Titanium dioxide in fuel cell technology: an
overview. J Power Sources 278:109–118
4. Drew K et al (2005) Boosting fuel cell performance with a semiconductor photocatalyst: TiO2/Pt-Ru hybrid catalyst for methanol oxidation. J Phys Chem B 109(24):11851–11857
5. Fuentes RE, García BL, Weidner JW (2011) Effect of titanium dioxide supports on the activity of Pt-Ru toward electrochemical oxidation of methanol. J Electrochem Soc 158(5):B461–B466
6. Kolla P, Smirnova A (2013) Methanol oxidation on hybrid catalysts: PtRu/C nanostructures promoted with cerium and titanium oxides. Int J Hydrog Energy 38(35):15152–15159
7. Soloveichik GL (2014) Liquid fuel cells. Beilstein J Nanotechnol 5(1):1399–1418 8. Basri S, et al (2014) Novel anode catalyst for direct methanol fuel cells. Sci
World J ID 547604: p1-8
9. Guo J et al (2006) Development of PtRu-CeO 2/C anode electrocatalyst for direct methanol fuel cells. J Power Sources 156(2):345–354
10. Saida T et al (2010) Titanium oxide nanosheet modified PtRu/C
electrocatalyst for direct methanol fuel cell anodes. J Phys Chem C 114(31): 13390–13396
11. Moura AS et al (2017) Ruthenium–platinum catalysts and direct methanol fuel cells (DMFC): a review of theoretical and experimental breakthroughs. Catalysts 7(2):47
12. StamenkovićV et al (2002) Electrocatalysis of fuel cells reaction on Pt and Pt-bimetallic anode catalysts: a selective review. Hemijska Industrija 56(6): 273–286
13. Bock C et al (2004) Size-selected synthesis of PtRu nano-catalysts: reaction and size control mechanism. J Am Chem Soc 126(25):8028–8037 14. Carp O, Huisman CL, Reller A (2004) Photoinduced reactivity of titanium
dioxide. Prog Solid State Chem 32(1):33–177
15. Luttrell T et al. (2014) Why is anatase a better photocatalyst than rutile?—model studies on epitaxial TiO2 films. Sci Rep 4:4043
16. Nakagawa N et al (2014) Improved reaction kinetics and selectivity by the TiO2-embedded carbon nanofiber support for electro-oxidation of ethanol on PtRu nanoparticles. J Power Sources 248:330–336
17. Hasran UA et al (2013) Optimization of hot pressing parameters in membrane electrode assembly fabrication by response surface method. Int J Hydrog Energy 38(22):9484–9493
18. Smyth JR, Bish DL, Allen & Unwin (1989) Book Review. Crystal structures and cation sites of the rock-forming minerals. Geol J 24:75-82
19. Ding B et al (2004) Titanium dioxide nanofibers prepared by using electrospinning method. Fibers Polym 5(2):105–109
20. Cordero-Borboa A et al (2003) X-ray diffraction evidence of the single solid solution character of bi-metallic Pt-Pd catalyst particles on an amorphous SiO2 substrate. Appl Surf Sci 220(1):169–174
21. Mohamed MA et al (2017) Carbon as amorphous shell and interstitial dopant in mesoporous rutile TiO 2: bio-template assisted sol-gel synthesis and photocatalytic activity. Appl Surf Sci 393:46–59
22. Bagheri S, Muhd Julkapli N, Bee Abd Hamid S, (2014) Titanium dioxide as a catalyst support in heterogeneous catalysis. Sci World J ID 727496:1-21 23. Thiam H et al (2013) Nafion/Pd–SiO 2 nanofiber composite membranes for
direct methanol fuel cell applications. Int J Hydrog Energy 38(22):9474–9483 24. Deivaraj TC, Lee JY (2005) Preparation of carbon-supported PtRu
nanoparticles for direct methanol fuel cell applications—a comparative study. J Power Sources 142(1–2):43–49
25. Tiwari A, Syväjärvi M, (2015) Graphene materials: fundamentals and emerging applications. Hoboken, Wiley.
26. Cooper KR, (2009) In Situ Pem Fuel cell electrochemical surface area and catalyst utilization measurement, in fuel cell magazine. Scribner Associates, North Carolina
27. Chronakis IS (2005) Novel nanocomposites and nanoceramics based on polymer nanofibers using electrospinning process—a review. J Mater Process Technol 167(2):283–293
28. Zainoodin AM et al (2014) High power direct methanol fuel cell with a porous carbon nanofiber anode layer. Appl Energy 113(0):946–954 29. Ito Y et al (2013) Ultrahigh methanol electro-oxidation activity of PtRu
nanoparticles prepared on TiO2-embedded carbon nanofiber support. J Power Sources 242:280–288
30. Ou Y et al (2010) Titanium carbide nanoparticles supported Pt catalysts for methanol electrooxidation in acidic media. J Power Sources 195(5): 1365–1369
32. Lin Y et al (2005) PtRu/carbon nanotube nanocomposite synthesized in supercritical fluid: a novel electrocatalyst for direct methanol fuel cells. Langmuir 21(24):11474–11479
33. Chen W, Wei X, Zhang Y (2014) A comparative study of tungsten-modified PtRu electrocatalysts for methanol oxidation. Int J Hydrog Energy 39(13): 6995–7003
34. Yen CH et al (2007) Chemical fluid deposition of Pt-based bimetallic nanoparticles on multiwalled carbon nanotubes for direct methanol fuel cell application. Energy Fuel 21(4):2268–2271
35. Shimizu T et al (2004) Design and fabrication of pumpless small direct methanol fuel cells for portable applications. J Power Sources 137(2):277–283 36. Hashim N, Kamarudin SK, Daud WRW (2009) Design, fabrication and testing
of a PMMA-based passive single-cell and a multi-cell stack micro-DMFC. Int J Hydrog Energy 34(19):8263–8269