Open Access
T E C H N I C A L N O T E S
© 2010 McCommis et al; licensee BioMed Central Ltd. This is an Open Access article distributed under the terms of the Creative Com-mons Attribution License (http://creativecomCom-mons.org/licenses/by/2.0), which permits unrestricted use, distribution, and reproduc-tion in any medium, provided the original work is properly cited.
Technical notes
Quantification of global myocardial oxygenation in
humans: initial experience
Kyle S McCommis, Robert O'Connor, Donna Lesniak, Matt Lyons, Pamela K Woodard, Robert J Gropler and Jie Zheng*
Abstract
Purpose: To assess the feasibility of our newly developed cardiovascular magnetic resonance (CMR) methods to quantify global and/or regional myocardial oxygen consumption rate (MVO2) at rest and during pharmacologically-induced vasodilation in normal volunteers.
Methods: A breath-hold T2 quantification method is developed to calculate oxygen extraction fraction (OEF) and MVO2 rate at rest and/or during hyperemia, using a two-compartment model. A previously reported T2 quantification method using turbo-spin-echo sequence was also applied for comparison. CMR scans were performed in 6 normal volunteers. Each imaging session consisted of imaging at rest and during adenosine-induced vasodilation. The new T2 quantification method was applied to calculate T2 in the coronary sinus (CS), as well as in myocardial tissue. Resting CS OEF, representing resting global myocardial OEF, and myocardial OEF during adenosine vasodilation were then calculated by the model. Myocardial blood flow (MBF) was also obtained to calculate MVO2, by using a first-pass perfusion imaging approach.
Results: The T2 quantification method yielded a hyperemic OEF of 0.37 ± 0.05 and a hyperemic MVO2 of 9.2 ± 2.4 μmol/ g/min. The corresponding resting values were 0.73 ± 0.05 and 5.2 ± 1.7 μmol/g/min respectively, which agreed well with published literature values. The MVO2 rose proportionally with rate-pressure product from the rest condition. The T2 sensitivity is approximately 95% higher with the new T2 method than turbo-spin-echo method.
Conclusion: The CMR oxygenation method demonstrates the potential for non-invasive estimation of myocardial oxygenation, and should be explored in patients with altered myocardial oxygenation.
Introduction
As an aerobic organ, the heart has to consume large amounts of O2 for its primary contractile function. Oxy-gen supply and demand must match to maintain normal myocardial contractility. The myocardial oxygen extrac-tion fracextrac-tion (OEF = ([O2]artery - [O2]venous)/[O2]artery)
reflects this balance in the heart. Non-invasive assess-ments of this parameter are of paramount interest because they may provide convenient and cost-effective tools to study the pathophysiology and metabolic conse-quences of myocardial ischemia. While progress has been made in the qualitative assessment of myocardial oxygen-ation with myocardial T2 or T2* contrast [1-3], limited
effort has been devoted to quantification of myocardial OEF by cardiovascular magnetic resonance (CMR), par-ticularly on a regional basis. A quantification model was recently reported to measure myocardial OEF during pharmacologically induced hyperemia in vivo using myo-cardial BOLD effects [4,5]. The model was validated in animal studies, using a segmented black-blood Turbo-Spin-Echo (TSE) sequence with T2 contrast. However, this CMR T2 based oximetry technique has yet been
assessed in human subjects. Furthermore, irregular ECG triggering due to tachycardia or arrhythmias, and unsatu-rated blood flow artifacts, which often occur in cardiac patients, may deteriorate the T2-weighted image quality using the TSE sequence.
The overall goal of this study was to translate our vali-dated CMR oximetry technique to human imaging. In particular, we investigated a modified T2 preparation * Correspondence: [email protected]
1 Mallinckrodt Institute of Radiology, Washington University School of Medicine, 510 S. Kingshighway Blvd, St. Louis, MO 63110, USA
technique (T2prep) that can be performed in human sub-jects with reduced susceptibility to the adverse ECG-trig-gering effects aforementioned and improved sensitivity to myocardial oxygenation alternations. Similar methods were reported recently to qualitatively assess myocardial oxygenation [6,7]. Like the quantification model, it uti-lizes T2-weighted contrasts. However, by selecting proper imaging parameters, the imaging procedure can be sim-plified compared to the TSE methods. Moreover, the OEF at the coronary sinus can be quantified using the T2prep sequence as an index of global myocardial OEF at rest, which was an assumed value in the previous animal stud-ies [4,5]. Lastly, unlike the intravascular contrast agent used in the previous animal studies, we will utilize an FDA-approved extracellular agent, Multihance, for myo-cardial perfusion quantification which is used for the measurement of myocardial oxygen consumption rate (MVO2). The CMR T2prep oximetry method was demon-strated in human volunteers, at rest and during adenos-ine-induced vasodilation. The findings from the T2prep
method were compared with the previously reported TSE method for the quantification of myocardial OEF during adenosine vasodilation.
Theory and Methods
Theory
The detail of the model was reported previously [4]. Briefly speaking, in T2-weighted TSE or spin-echo (SE) images with an interecho spacing τ (the time difference between two consecutive 180° pulses in TSE or between the 90° pulse and subsequent echoes in SE), the signal in a myocardial tissue voxel can be approximated in a biexpo-nential form from a two-compartment model as follows:
where Svoxel is the mean signal intensity of the voxel at echo time TE,; S0 is a variable related to the proton den-sity of the voxel, receiver gain, and T1 of the tissue. T2b and T2t are the T2 values of blood and tissue, respectively.
Using the van Zijl intravascular component model [8], intravascular T2 can be derived:
where α1, α2, and α3 are the functions of magnetic sus-ceptibilities, interecho spacing τ, oxygenation-dependent T2 of erythrocytes and plasma, arterial oxygen saturation, and hematocrit. The three constants can be derived with
experimental data obtained at 1.5 T [9], using subject-specific hematocrit values. For coronary sinus imaging, only the first term in Eq. [1] was used. The extravascular T2t can be approximated using a diffusion model [10,11]:
where R20t is the intrinsic myocardial tissue transverse
relaxation rate, and R21t is a function of the diffusion con-stant (D), susceptibility difference between the blood ves-sel and the surrounding tissue, geometry of the heart relative to the B0 static field, and the size of capillary and venous vessels. Therefore, both R20t and R21t are subject-specific parameters and need to be determined during each imaging session. Increasing τ180 would increase the
sensitivity of this method to the changes of myocardial oxygenation. With knowledge of R20t, R21t, apparent myo-cardial T2, and MBV, hyperemic myocardial OEF can be calculated through Eqs. (1-3).
T2prep Imaging Method for Myocardial OEF Estimation The T2prep sequence was implemented in a 1.5 T
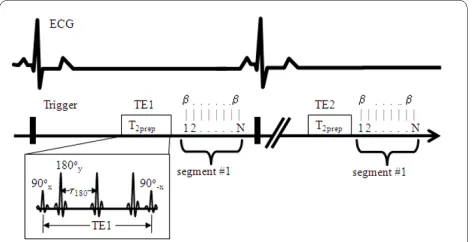
Sie-mens Sonata system (SieSie-mens Medical Solutions, Malvern, PA) (Figure 1). The sequence consists of a T2prep module and gradient-echo acquisition module. The T2prep module maintains the flexibility of changing the number of 180° pulses between two 90° tip-down and tip-up pulses. No gradients were played during the T2 preparation period, except one large spoil gradient at the end of T2prep module. Both 90° and 180° pulses were composite pulses. The 90°x consisted of a (270°x)(360°-x) composite pulse, whereas the 180°x was consisted of a (90°x)(180°y) (90°x) composite pulse. The last tip-up 90°
Svoxel TE
S e
TE
T apparent MBV e TE
T b MBV e TE T t
( )
( )
0
2 2 1 2
= = × + − × −
− −
1
2 1
2
2 3
T b =a ×OEF +a ×OEF+a (2)
1
2 20 21
2 2 2
[image:2.595.305.541.540.661.2]T t =R t +R t×OEF ×MBV t (3)
Figure 1 Diagram of T2prep sequence for the measurement of myocardial T2-weighted images. The sequence begins with a T2prep module followed by a N-line of gradient-echo data acquisition using a flip angle of β. All pulses in T2prep module are composite puls-es. The acquisition continues until the full k-space lines are collected. The second TE2 images are then acquired in the same manner, fol-lowed by the TE3, TE4, etc.
pulse was (360°x270°-x). If the TE is fixed, more 180° pulses will lead to less interecho spacing τ. In this study, because longer τ may increase the sensitivity of the sequence to the changes in myocardial oxygenation due to the extravascular diffusion weighting factor [5], it is desirable to have 180° pulses as less as possible in the T2prep module. A previous study [12] showed that a 4-180° scheme can minimize the B1 and B0 inhomogene-ities. We observed (data not shown) that a T2prep module with three 180° pulses is sufficient to minimize inhomo-geneity artifacts. The gradient-echo acquisition allows for bright-blood imaging, and thus reduces the flow artifacts. In addition, gradient-echo acquisition is less sensitive to cardiac motion compared to the TSE sequence.
The T2prep sequence was used to obtain T2 maps with
different TE values. In the previous OEF model using the TSE acquisition, at least two different τ180 values were needed to calculate model parameters R20t and R21t, lead-ing to two separate TSE acquisitions at rest. Uslead-ing the T2prep method, only one acquisition is necessary since different TE or τ180 values are used for the T2 calculation. Therefore, we developed a multi-variable regression method for the data set {Svoxel, TE, α1, α2, α3} at rest for
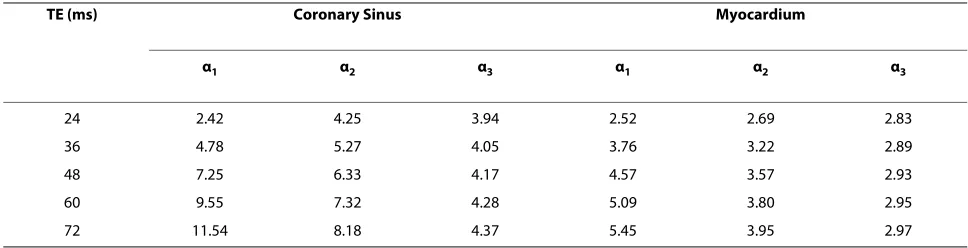
the determination of R20t and R21t. Then using the data set during hyperemia, a similar multi-variable regression can be repeated again to calculate the hyperemic OEF. Table 1 shows the TE and the model parameters we used to fit Eq. (1-3) in this method. The way to derive these parameters was reported previously [5], which were based on the the-oretical model by another group [8]. It is noted that these parameters in Table 1 are different between myocardium and CS due to the difference in hematocrit value [8]. The hematocrit was assumed to be one half of that in coro-nary sinus (40%), i.e. 20% [13]. Increasing τ180 will increase α1, α2, α3, and thereby increase the sensitivity of T2 to the change in OEF (Eq. 2 and 3). MBV at rest and during hyperemia were calculated independently by using first-pass perfusion imaging.
OEF of Coronary Sinus
We estimated the resting global OEF using a similar method reported by Foltz et al [14]. Briefly, coronary sinus T2 was measured using the same T2prep imaging sequence. The resting OEF was determined by a blood T2-OEF model, expressed in Eq. [1-2] with the parame-ters defined in Table 1. Since 90% of left interventricle blood is drained to the coronary sinus, such measured resting OEF should represent the global OEF of the left ventricle.
T2 Phantom Study
The T2 accuracy measured by the T2prep sequence was first studied in a phantom study. Four polyethylene tubes with a diameter of 3 cm were filled by a combination of agarose, Gd-DTPA, and NaCl, and distilled water. Such compositions created phantoms with T1, T2, and dielec-tric property similar to human myocardial tissues [15]. The concentrations of these components were slightly varied to yield T2 from 30 to 50 msec in 4 phantoms. Table 2 lists the T1 and T2 values of these phantoms. The T2prep sequence using the same imaging parameters as
in volunteer study (see below) was applied to scan these phantoms. Standard spin echo sequence with 7 different TEs from 24 to 96 msec was used to provide reference T2 values.
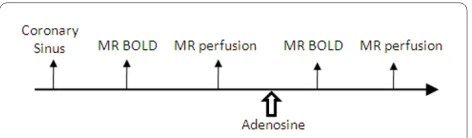
Volunteer Study
[image:3.595.55.539.623.747.2]Six healthy volunteers (average age = 32 ± 5 years old, 4 male) were recruited for this study. Informed consent was obtained from each volunteer prior to imaging session. Figure 2 shows the time sequence of the measurements. Coronary sinus imaging was performed first at rest, fol-lowed by T2-weighted imaging using both T2prep and TSE sequences. The location of the image plane was approximately 2-3 cm from the sinus ostium [14] to ensure the blood in the CS was dominated by the venous blood. We selected Multihance as the contrast agent for the first-pass perfusion imaging, partially because of its lowest risk profile to nephrogenic systemic fibrosis (NSF)
Table 1: Fitting Parameters for the Calculation of Coronary Sinus and Myocardial Hyperemic OEF
TE (ms) Coronary Sinus Myocardium
α1 α2 α3 α1 α2 α3
24 2.42 4.25 3.94 2.52 2.69 2.83
36 4.78 5.27 4.05 3.76 3.22 2.89
48 7.25 6.33 4.17 4.57 3.57 2.93
60 9.55 7.32 4.28 5.09 3.80 2.95
[16]. Bolus injections of Multihance (0.02 mmol/kg) were performed two times using a MR compatible injector (Spectris, Medrad, Indianola, PA), once at rest and once 4-6 min after the start of infusion of adenosine for coro-nary artery vasodilation. The time interval between two contrast injections was 15 ± 2 min. This allowed for the washout of the first contrast agent to minimize the inter-ference of two contrast injections.
Adenosine was infused intravenously for 6 minutes at a constant rate of 0.14 mg/kg/min by using a CMR compat-ible infusion system (Continuum, Medrad, Indianola, PA). Two minutes after the start of adenosine infusion, CMR started with T2-weighted imaging, followed by the
first-pass perfusion imaging as the last scan. Heart rate (HR) and blood pressure (BP) were measured continu-ously during the entire image session with an CMR-com-patible vital-signs monitoring system (Millennia; Invivo Research, Orlando, FL). The hard record was obtained at rest and every 1 min after the start of the adenosine infu-sion until the end of the infuinfu-sion.
The T2-weighted imaging consisted of two imaging methods: T2prep and TSE. The image parameters for T2prep were as follows: TE in the T2prep module = 24, 36, 48, 60, 72 ms, gradient-echo readout TR/TE = 3.6/2.0 ms, segmentation number = 27-35 (depending on the RR interval), bandwidth = 400 Hz/pixel, slice thickness = 8 mm, data matrix = 145 × 256, FOV = 255 × 340 mm2, and
flip-angle = 15°. The scan time was approximately 20-25 sec. For CS imaging, the spatial resolution was slightly higher, i.e., data matrix = 162 × 256, resulting in a resolu-tion of 1.57 mm × 1.32 mm. For TSE imaging at rest, two scans were performed using two different interecho spac-ing τ values, i.e., 8 and 12 ms, to calculate parameters R20t and R21t in Eq. [3]. Other imaging parameters included:
TE = 24, 48, and 72 ms, segmentation number = 5, band-width = 390 Hz/pixel, slice thickness = 8 mm, data matrix = 145 × 256, FOV = 255 × 340 mm2, scan time = 22-25
sec. Respiratory motion was controlled by breath-hold at end-expiration.
The first-pass perfusion sequence was a 2 D multi-slice saturation-recovery (SR) prepared Turbo FLASH sequence with a total of 70-80 images acquired in each slice. The T1-weighting was provided by a volume-selec-tive SR pulse. Each dynamic image was obtained in mid-diastole by ECG triggering. The center slice was located approximately at the mid-cavity level of the left ventricle across the papillary muscles in a short-axis view. Image parameters were as follows: TR/TE = 2.4/1.2 ms, slice thickness = 8 mm, data matrix = 84 × 256, FOV = 137 × 220 mm2, flip-angle = 18°, and SR time = 100 ms
depend-ing on the RR interval. Respiratory motion was controlled by breath-hold at the end expiration.
Image Processing and Statistical Analysis
[image:4.595.56.540.113.193.2]The central slice of the perfusion imaging corresponding to the T2prep slice was processed using homemade soft-ware developed in our laboratory, written in JAVA (Java V5.0, Sun Microsystems, Santa Clara, CA). A model-free deconvolution method, Consolidated-basis, was imple-mented to calculate MBF and MBV [17]. The approach used a linear combination of basis functions to represent impulse function. Few parameters [3] are required for the deconvolution process and thus noise-sensitivity is rela-tively low. Using the mean transit time (MTT) deter-mined by the software, MBV is calculated as the product of MTT and MBF. The software provides the capability for denoising the image before mapping MBF or MBV [18]. On each MBF map, a large, global ring ROI was drawn to include approximately 75% transmural left ven-tricle myocardial wall to calculate the global MBF. Input curves for these calculations were obtained from a circu-lar ROI manually drawn over the left ventricle blood pool. To process coronary sinus images, a circle ROI was drawn in the center of the coronary sinus and adjusted manually for the compensation of motions between dif-ferent T2-weighted images. These signal intensities were then fitted to Eq. (1-2) using the constants defined in Table 1, without using the second term in Eq. (1). Resting
Table 2: T2 phantoms and T2 measurement results with T2prep and SE sequences
Sequences Phantom 1
(1043.5)
Phantom 2 (1122.4)
Phantom 3 (754.3)
Phantom 4 (859.5)
SE 32.3 43.9 46.5 51.4
T2prep 32.3 43.5 46 51.7
Errors (%) 0 -0.91 -1.0 0.6
T1 values are shown in parenthesis.
[image:4.595.57.293.653.722.2]CS OEF could be obtained by the multi-variable regres-sion method using DataFit (Oakdale Engineering, Oakdale, PA).
Myocardial T2prep images were analyzed by drawing the same ring ROI as in the perfusion measurements and T2-weighted signal intensities at rest and during stress were obtained at different TEs. Theoretically, R20t and R21t can be determined using Eqs. (1-3) by using multi-variable non-linear regression procedures. However, it was found that non-linear fitting was not stable due to few data points for 3 parameters to be calculated. We have thus developed following procedures to calculate these parameters and myocardial regional OEF during stress:
(a) Using a single-variable non-linear regression, appar-ent T2apparent values are calculated at rest and during
stress;
(b) With OEF obtained at rest from the CS measure-ment, R2b can be calculated at each TE using Eq. [2]; and R2t can be then calculated using Eq. [1] with MBV obtained from the perfusion measurement at rest.
(c) In Eq. [3], R2t is linearly correlated with R20t and R21t with the single variable OEF2MBV2τ2, where τ = TE/3. By
linear fitting of Eq. [3], R20t (the intercept) and R21t (slope) can be calculated.
(d) With the knowledge of R20t, R21t, and MBV during stress, the relationship of T2apparent and OEF during stress
can be derived using Eq. (1). Based on T2apparent during stress from (a), myocardial OEF during stress was obtained. The procedures for calculating hyperemic myo-cardial OEF using the TSE method were reported previ-ously [2]. MVO2 was calculated using the formula: MVO2 (μmol/g/min) = 1.39 (mL O2/(hemoglobin) g) × 0.14 (hemoglobin) g/mL blood × 44.658 (μmol/mL) × 0.95 (Oxygen saturation in arterial blood) × OEF × MBF (mL/ g/min). It should be noted, in contrast to the first-pass perfusion images, neither OEF nor MVO2 were calcu-lated from maps, but from ROIs drawn on the source images.
To compare the performance of T2prep and TSE
meth-ods, T2 sensitivity was defined as
It indicates the percentage change in measured myo-cardial T2 per 100% increases in MBF. All data are expressed as mean ± SD. Paired student's T-tests were performed to test significant differences between the TSE and T2prep methods, as well as between resting and hyperemic parameters. P < 0.05 was considered statisti-cally significant.
Results
Phantom Study
The T2 measurement results are shown in Table 2 and the T2 error by using T2prep sequence was less than 1% in comparison with reference T2 values.
MBF, OEF, and MVO2 of Global Myocardium at Rest
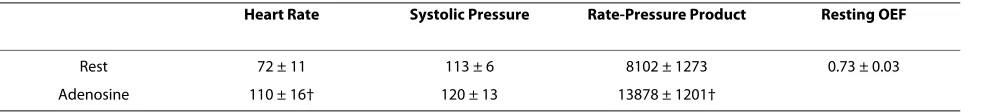
The volunteer's hemodynamic data along the time course is presented in Table 3, along with the measurement results of OEF of the coronary sinus at rest. HR and rate pressure product (RPP) were both significantly elevated over the resting values during adenosine infusion (~70% increase in RPP). Systolic blood pressure showed signifi-cant elevation only at 1 and 5 min after the start of ade-nosine infusion. The increase in RPP with the vasodilation agent adenosine is not unusual as this was also reported by others [19,20]. Figure 2 shows examples of T2-weighted images of the coronary sinus of one vol-unteer using the T2prep sequence. The resting CS T2 was
62 ± 4 msec and OEF was 0.73 ± 0.05, which agrees nicely with one previously reported global OEF of healthy vol-unteers (0.71 ± 0.08) measured by PET imaging [21]. The mean resting global MBF was 0.89 ± 0.36 mL/g/min and MBV was 5.5 ± 1.8 mL/100 g tissue. The corresponding resting MVO2 is approximately 5.2 ± 1.7 μmol/g/min or 0.116 ± 0.038 mL/g/min which also agrees well with pub-lished data in normal humans [18,22].
T sensititvity
hyperemic T resting T restingT hyperem
2
2 2
2
=
−
( )
( iic MBF resting MBF resting MBF
[image:5.595.58.549.642.698.2]− )×100
Table 3: Hemodynamic Data of the Volunteers and Resting CS OEF
Heart Rate Systolic Pressure Rate-Pressure Product Resting OEF
Rest 72 ± 11 113 ± 6 8102 ± 1273 0.73 ± 0.03
Adenosine 110 ± 16† 120 ± 13 13878 ± 1201†
Values are presented as mean ± SD
†P < 0.001 for the comparison between rest and adenosine
MBF, OEF, and MVO2 of Global Myocardium during
Adenosine Stress
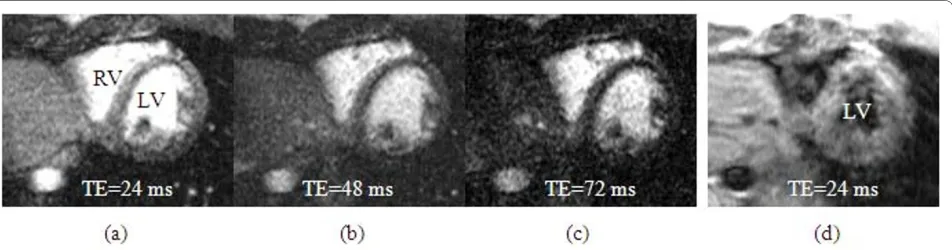
One set of hyperemic BOLD images with the TSE method was distorted in one volunteer due to rapid changes in heart rate during adenosine infusion, but T2prep scans were completed in all volunteers. Figure 3 demonstrates three T2-weighted images using T2prep sequence and one distorted TSE images during the ade-nosine infusion. Table 4 shows the comparison of myo-cardial perfusion and oxygenation parameters from both the TSE and T2prep methods. Except for MVO2 obtained by the TSE method, significant differences were found between adenosine and resting measurements for all other parameters.
The mean hyperemic MBF was 2.97 ± 0.75 mL/g/min and MBV was 9.9 ± 2.4 mL/100 g. Adenosine induced 220 ± 152% increase in MBF and 65 ± 53% increase in MBV. The corresponding global myocardial T2 changes were 5.8 ± 2.0 % with the TSE method and 11.5 ± 8.1% with the T2prep method. Global myocardial T2 values are gener-ally lower with T2prep method than TSE, due to the dif-fusion effects with larger echo spacing time in the T2 preparation pulses (8). The T2 sensitivity is approxi-mately 95% higher with the T2prep method than TSE method, although no significant difference was observed due to limited subject number. The R20t, representing intrinsic myocardial tissue R2, was 24.5 ± 4.1 sec-1. The R21t, reflecting geometry of the heart and local gradient fields, was 10.6 ± 9.7 (×104) sec-3. For the T2prep method, myocardial OEF was reduced 47 ± 21% during adenosine infusion and mean MVO2 increased approxi-mately 88 ± 75%. This magnitude increase is consistent with the increase in the RPP value (71%). Overall, there were no significant differences in OEF and MVO2 mea-surements between the T2prep and TSE methods.
Discussion
A modified quantitative CMR method was demonstrated to estimate global myocardial OEF and MVO2 in humans, at rest and during pharmacologically induced vasodila-tion. While resting OEF and MVO2 are only measurable on coronary sinus, regional myocardial OEF and MVO2 can be measured during hyperemia using myocardial BOLD effects. Adenosine induced 2-3 fold increases in MBF that exceeded the increase in MVO2. Consequently, myocardial OEF was reduced 47% in normal volunteers. The bright-blood T2prep method appears to be a better
method than black-blood TSE technique, as indicated in much improved T2 sensitivity to the changes in myocar-dial blood flow (Table 4).
The models to estimate hyperemic myocardial OEF and MVO2 were established and validated in animal studies previously, using a black-blood TSE sequence [4,5]. How-ever, in some cases, particularly in the presence of tachy-cardia or arrhythmias, black-blood preparation using the double inversion technique does not sufficiently suppress the blood signals in the left ventricle, resulting in flow artifacts on the myocardium. This often leads to decreased myocardial T2 and thus overestimation of myo-cardial OEF. The bright-blood T2prep technique, fol-lowed by robust gradient-echo acquisition, avoids these flow artifacts. Unlike the procedure to estimate hypere-mic OEF using the TSE sequence [4,5], in which two rest-ing scans are required to estimate model parameters R20t
[image:6.595.56.541.559.664.2]and R21t, the use of the T2prep sequence requires only one resting scan for this purpose. Up to five images with dif-ferent echo times (TEs) can be acquired within one breath-hold rather than only 3 images using the TSE sequence, potentially increasing the precision of the OEF estimation. With the use of larger 180° echo time (τ), the
Table 4: Global Myocardial Perfusion and Oxygenation in Volunteers (Data is presented as mean (SD))
Method T2 MBF
(mL/g/min)
MBV (mL/g)
OEF MVO2
(μmol/g/min)
T2sen*
T2prep Rest 44 (6) 0.89 (0.36) 0.06 (0.02) 0.73 (0.05) 5.2 (1.7)
Aden 49 (5)† 2.97 (0.75)† 0.10 (0.02)† 0.37 (0.05)† 9.2 (2.4) ξ 4.8(5.1)
TSE Rest 55 (4)†† 0.73 (0.05) 5.2 (1.7)
Aden 59 (4) † 0.41(0.14)† 10.4 (5.1) 3.2(2.9)
OEF at rest are values of coronary sinus in Table 2
MBF and MBV were calculated from the first-pass perfusion imaging data sets. *T2sen or T2 sensitivity = percentage of T2 change/100% increase in MBF Aden = Adenosine vasodilation
sensitivity of the T2prep method to the changes of MBF seems to be improved. Finally, the simple adjustment of segmentation number for the gradient-echo acquisition allows for the change in breath-holding time, which is very beneficial for scanning patients in a clinical setting.
While the T2 preparation method to measure myocar-dial and coronary sinus T2 is not a new approach [13,23], the sequence developed allowed one T2 mapping with single breath-hold using up to 5 different TE. This approach is different from reported methods that used 2 to 3 TEs and/or scan for a relatively long time (~8 min). Another difference is the gradient-echo readout in the sequence, in comparison with reported readout sequences using spiral or TrueFISP. Apparently, gradient-echo has relatively lower SNR than the other two meth-ods, but it offers the most robust signal acquisition against cardiac motion. Spiral readout was not available in our scanner. TrueFISP readout was not adopted due to following reasons: a) unlike the gradient echo sequence, data acquisition of TrueFISP readout starts at approxi-mately 50 msec after the last 90° pulse in the T2 prepara-tion module. This time delay reduced the efficiency of T2 weighting; b) steady-state TrueFISP signal is T2/T1 weighting. Because our model to calculate myocardial or CS OEF relies on T2 measurement, the impact of this T2/
T1 weighting remains to be determined for the accuracy of OEF measurements. Nevertheless, TrueFISP type of readout is still an attractive option owing to its higher SNR. Further investigation of this sequence for the quan-tification of myocardial OEF is warranted.
Measurement of coronary venous oxygenation was pre-viously reported by Foltz et al [13] and Yang et al [24] using a similar T2prep (MLEV module) with a spiral read-out data acquisition. Four 180° pulses were used within the T2prep module to minimize B0 and B1 inhomogene-ities in a previous study [12]. The coronary sinus oxygen content in %-O2 was calculated through an in vitro cali-bration procedure involving venipuncture and ex vivo
CMR T2 determination in the blood samples. We have simplified this procedure using a previously established quantification model and directly calculated oxygen con-tent of coronary sinus in OEF term by acquisitions of multiple T2-weighted signals and nonlinear fitting to the model equation. The resulted resting OEF appears to be consistent with other literature values [18]. It is noted that we used one or three 180° pulses in the T2prep mod-ule, aiming to maximize the diffusion sensitivity of the sequence to the changes in blood oxygenation. To effec-tively minimize B0 and B1 inhomogeneity, the combina-tion of MLEV-4 pattern and composite pulses in the T2prep module may still be the optimal condition [12]. Our sequence can be prescribed to using 4 180° pulses in the T2prep module for a MLEV-4 pattern. However, our initial exams in six volunteers found similar image quality using either 3 or 4 180° pulses. Further optimization of the sequence is necessary to minimize B0 and B1 inhomo-geneity while maximizing the sensitivity to oxygenation changes in the coronary system in more subjects. This will involve using different number of 180° pulses (even and odd numbers) with the same vasodilation condition in the same subject. Animal study will likely be ideal for such optimization purposes.
[image:7.595.62.538.96.221.2]relaxivity derives from weak and transient interactions of the Multihance chelate with serum albumin. It appears that such transient interactions may confer a partial blood pool effect which serves to reduce the rate of con-trast extravasations compared to other gadolinium based extracellular agents [25]. In the current human study, both resting and hyperemic MBF agrees well with other literature values.
Limitations of this study
In this initial study, the primary goal was to investigate whether the T2prep method could yield similar hypere-mic global myocardial OEF and MVO2 as the TSE method. Regional variations of these parameters were not assessed because neither OEF nor MVO2 map was
cre-ated. However, such spatial variability needs to be mea-sured in order for clinical evaluation of ischemic hearts. Precision and accuracy of this new cardiac oxygenation method using the T2prep technique have yet to be deter-mined. A large sample of subjects with repeated measure-ments may be needed to estimate the precision, in combination with the noise propagation analysis. How-ever, accuracy of the measurement has to be determined in animal studies to compare with the measurement results with a gold standard, such as blood oxygen con-tent through arterial and venous blood sampling. A sys-temic hematocrit of 40% was assumed in this study and capillary hematocrit was also assumed to be 50% of coro-nary sinus. Because the parameters in Table 1 depend on the hematocrit, a small error in the calculation of myo-cardial OEF during the hyperemia may be introduced. If the capillary hematocrit varies by 25%, however, the cal-culated OEF variation is less than 3%. Another limitation of this method is the lack of regional myocardial oxygen-ation at rest. This is partially due to the fact that this method relies on endogenous deoxyhemoglobin, and its perturbation effects on the field inhomogeneity against the baseline condition (the so called BOLD effect). Other methods using exogenous agents, such as 17O-labelled
gas [26] or contrast agents, may have the potential to resolve this problem. Lastly, CS measurement was not performed during the adenosine session due to limited vasodilation effect time (~4 min). Future study without using TSE sequence can allow estimation of CS oxygen-ation during the vasodiloxygen-ation.
Conclusion
A modified CMR approach to estimate global myocardial oxygenation, in terms of myocardial OEF and MVO2, was designed and examined in human volunteers. The method has potential to assess regional myocardial OEF and MVO2 during hyperemia as well. The calculated global OEF and MVO2 appear to be consistent with other reported data. This method may be potentially useful for
the assessment and management of patients with regional myocardial ischemia, as well as patients with altered global myocardial oxygenation, such as diabetes and obe-sity.
Abbreviations
CMR: cardiovascular magnetic resonance, FLASH: fast low-angle shot, MBF: myocardial blood flow, MBV: myocardial blood volume, MVO2: myocardial oxy-gen consumption rate, NSF: nephrooxy-genic systemic fibrosis, OEF: oxyoxy-gen extrac-tion fracextrac-tion, ROI: region of interest, RPP: rate-pressure product, SR: saturaextrac-tion recovery, SNR: signal-to-noise ratio, T2prep: T2 preparation, TrueFISP: fast imag-ing with steady-state precession
Competing interests
The authors declare that they have no competing interests.
Authors' contributions
KSM, RJG, JZ participated in the design of the study. RO designed and imple-mented CMR sequence. ML, DL, and PKW enrolled, coordinated, and partici-pated in the human study. KSM and JZ performed the CMR study and statistical analysis, as well as drafted the manuscript. All authors read and approved the final manuscript.
Acknowledgements
This research was supported in part by National Institute of Health grant 1 R01 HL74019.
Author Details
Mallinckrodt Institute of Radiology, Washington University School of Medicine, 510 S. Kingshighway Blvd, St. Louis, MO 63110, USA
References
1. Balaban RS, Taylor JF, Turner R: Effect of cardiac flow on gradient recalled echo images of the canine heart. NMR Biomed 1994, 7:89-95.
2. Wacker CM, Bock M, Hartlep AW, Beck G, van Kaick G, Ertl G, Bauer WR, Schad LR: Changes in myocardial oxygenation and perfusion under pharmacological stress with dipyridamole: assessment using T*2 and T1 measurements. Magn Reson Med 1999, 41:686-95.
3. Wacker CM, Hartlep AW, Pfleger S, Schad LR, Ertl G, Bauer WR: Susceptibility-sensitive magnetic resonance imaging detects human myocardium supplied by a stenotic coronary artery without a contrast agent. J Am Coll Cardiol 2003, 41:834-40.
4. Zheng J, Wang J, Rowold FE, Gropler RJ, Woodard PK: Relationship of apparent myocardial T2 and oxygenation: towards quantification of myocardial oxygen extraction fraction. J Magn Reson Imaging 2004, 20:233-41.
5. Zheng J, Wang J, Nolte M, Li D, Gropler RJ, Woodard PK: Dynamic estimation of the myocardial oxygen extraction ratio during dipyridamole stress by MRI: a preliminary study in canines. Magn Reson Med 2004, 51:718-26.
6. Shea SM, Fieno DS, Schirf BE, Bi X, Huang J, Omary RA, Li D: T2-prepared steady-state free precession blood oxygen level-dependent MR imaging of myocardial perfusion in a dog stenosis model. Radiology
2005, 236:503-509.
7. Huang TY, Liu YJ, Stemmer A, Poncelet BP: T2 measurement of the human myocardium using a T2-prepared transient-state TrueFISP sequence. Magn Reson Med 2007, 57:960-966.
8. van Zijl PC, Eleff SM, Ulatowski JA, Oja JM, Ulug AM, Traystman RJ, Kauppinen RA: Quantitative assessment of blood flow, blood volume and blood oxygenation effects in functional magnetic resonance imaging. Nat Med 1998, 4:159-67.
9. Golay X, Silvennoinen MJ, Zhou J, Clingman CS, Kauppinen RA, Pekar JJ, van Zijl PC: Measurement of tissue oxygen extraction ratios from venous blood T(2): increased precision and validation of principle.
Magn Reson Med 2001, 46:282-91.
10. Kennan RP, Zhong J, Gore JC: Intravascular susceptibility contrast mechanisms in tissues. Magn Reson Med 1994, 31:9-21. Received: 11 January 2010 Accepted: 2 June 2010 Published: 2 June 2010
This article is available from: http://www.jcmr-online.com/content/12/1/34 © 2010 McCommis et al; licensee BioMed Central Ltd.
This is an Open Access article distributed under the terms of the Creative Commons Attribution License (http://creativecommons.org/licenses/by/2.0), which permits unrestricted use, distribution, and reproduction in any medium, provided the original work is properly cited.
11. Bartha R, Michaeli S, Merkle H, Adriany G, Andersen P, Chen W, Ugurbil K, Garwood M: In vivo 1H
2O T2+ measurement in the human occipital
lobe at 4T and 7T by Carr-Purcell MRI: detection of microscopic susceptibility contrast. Magn Reson Med 2002, 47:742-50. 12. Brittain JH, Hu BS, Wright GA, Meyer CH, Macovski A, Nishimura DG:
Coronary angiography with magnetization-prepared T2 contrast.
Magn Reson Med 1995, 33:689-696.
13. Ito H: Quantitative Myocardial Contrast Echocardiography in Coronary Artery Disease. J Echocardiogr 2006, 4:99-109.
14. Foltz WD, Merchant N, Downar E, Stainsby JA, Wright GA: Coronary venous oximetry using MRI. Magn Reson Med 1999, 42:837-848. 15. Kato H, Kuroda M, Yoshimura K, Yoshida A, Hanamoto K, Kawasaki S,
Shibuya K, Kanazawa S: Composition of MRI phantom equivalent to human tissues. Med Phys 2005, 32:3199-3208.
16. Kuo PH: Gadolinium-containing MRI contrast agents: important variations on a theme for NSF. J Am Coll Radiol 2008, 5:29-35. 17. Goldstein TA, Jerosch-Herald M, Misselwitz B, Zhang H, Gropler RJ, Zheng
J: Fast mapping of myocardial blood flow with MR first-pass perfusion imaging. Magn Reson Med 2008, 59:1394-1400.
18. Goldstein TA, Zhang H, Misselwitz B, Gropler RJ, Zheng J: Improvement of quantification of myocardial first-pass perfusion mapping: a temporal and spatial wavelet denoising method. Magn Reson Mad 2006, 56:439-45.
19. Wei K, Ragosta M, Thorpe J, Coggins M, Moos S, Kaul S: Noninvasive quantification of coronary blood flow reserve in humans using myocardial contrast echocardiography. Circulation 2001, 103:2560-2565.
20. Firschke C, Andrássy P, Linka AZ, Busch R, Martinoff S: Adenosine myocardial contrast echo in intermediate severity coronary stenoses: a prospective two-center study. Int J Cardiovasc Imaging 2007, 23:311-321.
21. Agostini D, Iida H, Takahashi A, Tamura Y, Henry Amar M, Ono Y: Regional myocardial metabolic rate of oxygen measured by O2-15 inhalation and positron emission tomography in patients with cardiomyopathy.
Clin Nucl Med 2001, 26:41-49.
22. Sun KT, Yeatman LA, Buxton DB, Chen K, Johnson JA, Huang SC, Kofoed KF, Weismueller S, Czernin J, Phelps ME, Schelbert HR: Simultaneous measurement of myocardial oxygen consumption and blood flow using [1-carbon-11]acetate. J Nucl Med 1998, 39:272-280. 23. Huang TY, Liu YJ, Stemmer A, Poncelet BP: T2 measurement of the
human myocardium using a T2-prepared transient-state TrueFISP sequence. Magn Reson Med 2007, 57:960-966.
24. Yang Y, Foltz WD, Merchant N, Stainsby JA, Wright GA: Noninvasive quantitative measurement of myocardial and whole-body oxygen consumption using MRI: initial results. Magn Reson Imaging 2009, 27:147-154.
25. Wyttenbach R, Gianella S, Alerci M, Braghetti A, Cozzi L, Gallino A: (2003) Prospective blinded evaluation of Gd-DOTA- versus Gd-BOPTA-enhanced peripheral MR angiography, as compared with digital subtraction angiography. Radiology 2003, 227:261-269.
26. Mellon EA, Beesam RS, Baumgardner JE, Borthakur A, Witschey WR, Reddy R: Estimation of the regional cerebral metabolic rate of oxygen consumption with proton detected 17O MRI during precision 17O2 inhalation in swine. J Neurosci Methods 2009, 179:29-39.
doi: 10.1186/1532-429X-12-34