N A N O E X P R E S S
Open Access
Effect of Intrinsic Ripples on Elasticity of the
Graphene Monolayer
Seungjun Lee
Abstract
The effect of intrinsic ripples on the mechanical response of the graphene monolayer is investigated under uniaxial loading using molecular dynamics (MD) simulations with a focus on nonlinear behavior at a small strain. The calculated stress-strain response shows a nonlinear relation through the entire range without constant slopes as a result of the competition between ripple softening and bond stretching hardening. For a small strain, entropic contribution is dominant due to intrinsic ripples, leading to elasticity softening. As the ripples flatten at increasing strain, the energetic term due to C–C bonds stretching competes with the entropic contribution, followed by energetic dominant deformation. Elasticity softening is enhanced at increased temperature as the ripple amplitude increases. The study shows that the intrinsic ripple of graphene affects elasticity. This result suggests that a change of ripple amplitudes due to various environmental conditions such as temperature, and substrate interactions can lead to a change of the mechanical properties of graphene. The understanding of the rippling effect on the mechanical behavior of 2D materials is useful for strain-based ripple manipulation for their engineering applications.
Keywords: Graphene, Ripples, Elasticity, Molecular dynamics
Background
Graphene has received considerable interest due to its unique properties, potentially leading to a wide range of applications such as display screens [1, 2], energy storage [3–5], solar cells [6–8], and field-effect transistors [9–11]. As one of its unique properties, suspended graphene is not perfectly flat but forms spontaneous ripples on the surface [12]. Thermal fluctuation is known for the origin of out-of-plane deformations, and the intrinsic ripples are inevitable to maintain the stability of 2D crystal structures [13]. The spontaneous roughening of graphene is intri-guing because it is attributed to unexpected physical characteristics such as a negative thermal expansion coefficient [14], increasing bandgap [15], and unusual electronic properties [16].
The mechanical properties of graphene have been widely studied experimentally and theoretically. In terms of experimental studies, Lee et al. performed a pioneering mechanical test to measure the Young’s modulus and fracture strength of a monolayer graphene
membrane, reporting the values as 1 TPa and 130 GPa, respectively [17]. Since direct measurement of the mechanical properties is challenging for the atomically thin membrane, they used a nanoindentation technique on a freely suspended graphene membrane using an atomic force microscope. Recently, a direct uniaxial tensile test was performed with a micromechanical de-vice to measure the fracture toughness of graphene with a pre-crack [18]. In terms of theoretical studies, various atomistic calculations using density functional theory (DFT) [19], molecular dynamics simulations and tight-binding (TB) approach [20] were performed by adapting the traditional uniaxial tension test.
Theoretical studies usually predict higher mechanical strength since they assume a perfect crystalline structure while experimentally synthesized samples often have defects and grain boundaries [21]. To complete this dis-crepancy, systematic simulations have been widely per-formed, focusing on the effect of imperfection such as grain boundaries [22], Stone-Wales defects [23], and nanopores [24]. Expanding the single defect issue, the ef-fect of a large number of deef-fects has recently been researched [25, 26]. The uniaxial tensile test of highly Correspondence:[email protected]
Department of Mechanical, Robotics and Energy Engineering, Dongguk University-Seoul, Seoul 100715, Korea
defective graphene showed totally different mechanical responses such as the lowering of Young’s modulus and ductile fracture behavior [26]. In addition, Zhang et al. obtained the stress-strain curve of nanocrystalline gra-phene from a tension test, showing a clear nonlinear be-havior at the initial stage [27]. They showed that the nonlinear mechanical behavior at the beginning is attrib-uted to entropic contribution due to wrinkles produced by atomic mismatches at grain boundaries. This interest-ing behavior induced by out-of-plane deformations raises questions about whether a similar characteristic also ex-ists in the defect-free pristine graphene monolayer since it has intrinsic ripples. However, although the stress-strain relation of pristine graphene has been obtained in many theoretical studies, the nonlinear elasticity at a small strain has rarely been mentioned.
The nonlinear stress-strain relation of graphene has been proposed in various experimental studies [17, 28]. However, in these studies, the experiment focused on the overall response at a large strain. Furthermore, most of the experiments measure the stress-strain relation using an indentation technique, which does not effect-ively capture the rippling effect since the indentation direction is same as the out-of-plane displacements: the ripple amplitudes may change due to the interaction with the indentation tip. Theoretically, while ab initio calculation reported that linear-elastic behavior lasts up to 5 % strain, the rippling effect was not considered, as-suming only the in-plane deformation [29]. Since it is difficult to describe out-of-plane deformations in the DFT studies, molecular dynamics (MD) simulation is an effective technique to study the effect of ripples under axial loading. Although many MD simulations are per-formed to study the mechanical behavior of graphene, the detail studies on the mechanical behavior are rarely attended, especially for small strain regions. For ex-ample, the Young’s modulus of graphene is typically cal-culated by assuming a linear trend in the stress-strain curve at a small strain [20]. However, questions still re-main: how far a linear region can be defined in the curve for the slope fitting, whether a linear region exists at in-finitesimal strain, and how the intrinsic ripples in pris-tine graphene affect the mechanical behavior. The effect of the intrinsic ripples on the mechanical properties is nontrivial because the ripple amplitudes of the graphene on a substrate for an engineering application can change according to the surface properties such as roughness and interfacial van der Waals interactions [30].
In the paper, the mechanical behavior of a suspended monolayer graphene is investigated under uniaxial stretching using 3D and 2D MD simulations, focusing on the effect of intrinsic ripples. The study revealed that the linear region does not exist even at a small strain and the out-of-plane displacements result in elasticity
softening at a finite temperature. This paper is struc-tured as follows. First, the MD simulation model and methods for uniaxial tension are described. Then, the mechanical response of a monolayer graphene is investi-gated and the effect of ripples is studied with varying temperature. Finally, the conclusion is given at the end.
Methods
All MD simulations are performed using the open-source program LAMMPS [31]. The second generation reactive empirical bond order (REBO) potential [32] is used unless it is mentioned. A square-shaped monolayer graphene is simulated with periodic boundary condi-tions. Figure 1 shows the equilibrated graphene mono-layer for a tensile test. The length of one side is selected as 100 Å, which is large enough to ignore the size effect of graphene [20]. In the z direction, a large height for the simulation box is given to remove the graphene interlayer interactions. A time step of 1 fs is used. The Nose-Hoover thermostat and Nose-Hoover barostat are used in all simulations with a temperature damping con-stant of 0.1 ps and pressure damping concon-stant of 1 ps. The system is equilibrated with the NPT ensemble at zero pressure to remove any internal stress. After equi-librium, a uniaxial tension test is performed with the NVT ensemble. The uniaxial loading is applied by enlar-ging the simulation box with a strain rate of 5 × 10⁻⁵/ps. Figure 2 shows the stress responses at different strain rates. The overall responses are similar except fracturing. The magnified view at fracture is shown in the inset fig-ure. The fracture behavior is converged below a strain rate of 5 × 10⁻⁵/ps. The strain increment is applied every 100 ps. The atomic stresses are obtained by averaging during the last 10 ps at each increment. Stresses are
Parallel
Oblique
[image:2.595.306.538.524.714.2]calculated using the Virial theorem, which is expressed as [33, 34]
σðrÞ ¼Ω1X i
−miu˙i⊗u˙iþ12
X
j≠i
rij⊗fij 2
6 4
3 7
5; ð1Þ
whereΩis the total volume,miis the mass of atomi,u˙i
is the time derivative ofui,ui denotes the displacement
vector of atomirelative to a reference position,rij=rj−
ri,⊗is the cross product, andfijis the interatomic force
applied on atom i by atom j. The engineering stress is calculated by applying the volume of the equilibrated system. The length and width for the volume is obtained from the length of the simulation box in the xandy di-rections. The thickness is assumed as 3.35 Å. Since the initial volume is used for the stress calculation, the stress obtained in this study is engineering stress. The stress level may change if true stress is calculated. To remove the thermodynamic vibration effect, ten points are chosen randomly in the range of the last 10 ps at the equilibrated state, serving as a starting point of the uni-axial test. The results of ten simulations are averaged. The time average fluctuation height of the graphene sur-face is calculated by
〈h〉t¼
ffiffiffiffiffiffiffiffiffiffiffiffiffiffiffiffiffiffiffiffiffiffiffiffiffiffiffiffiffiffiffiffi XN
i¼1
ðhi−hÞ2
N
* +
t v
u u
t ; ð2Þ
where 〈〉t is the time average,N is the total number of
atoms, hiis thezdirection displacements of iatom, and
his the spatial average height of atoms.
Results and Discussion
[image:3.595.58.291.89.264.2]Mechanical Response of Graphene Under Uniaxial Tension
Figure 3a shows the stress-strain response of a mono-layer graphene at 300 K under uniaxial tension in the armchair direction. The fracture occurs at 0.125 and the fracture stress is 87 GPa, showing good agreement with previous study [20]. While the nonlinear relation is ob-served clearly over 0.06 strain, it is not clear at small strains. To investigate linearity in detail, the derivative
0.00 0.02 0.04 0.06 0.08 0.10 0.12 0.14 0
20 40 60 80 100
S
tre
ss (GP
a
)
Strain 0.0002
0.0001 0.00005 0.000025
0.11 0.12 0.13 80
82 84 86 88 90
Fig. 2Stress-strain response at different strain rates of 0.0002 (blue),
0.0001 (green), 0.00005 (red), and 0.000025 (black)
0 2 4 6 8 10 12
300 400 500 600 700 800 900 1000
Der
iv
ativ
e of stress-str
ain
relation (GP
a)
Strain (%)
0 2 4 6 8 10 12
0 20 40 60 80
a
b
c
Stress (GP
a)
Strain (%)
0 2 4 6 8 10 12
-8000 -6000 -4000 -2000 0 2000 4000 6000 8000 10000 12000
Second der
iv
ativ
e of
stress-str
ain relation (GP
a)
Strain (%)
I
II
III
Fig. 3aStress-strain response of a monolayer graphene under uniaxial
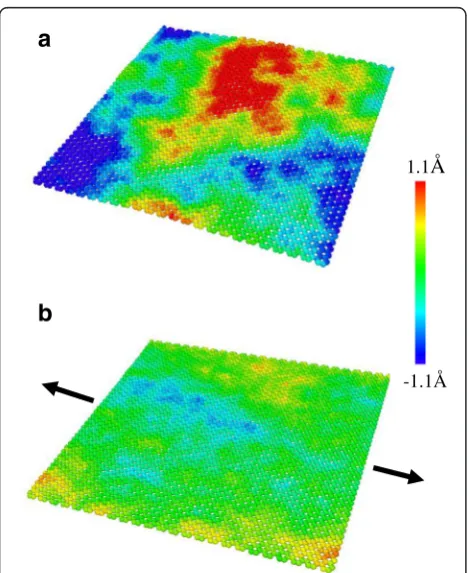
[image:3.595.305.538.223.698.2] [image:3.595.72.271.354.400.2]and the second derivative of the stress-strain curve are calculated and shown in Fig. 3b, c. The curve is divided into three regions according to the second derivatives: positive, negative with decreasing, and negative with constant. In the first region, the tangent slope of the curve increases, which is the characteristic of entropic elasticity that is observed in polymer [35] or biological materials [36]. This initial nonlinearity is similar to the behavior shown in polycrystalline graphene, implying that the effect of intrinsic ripples also exists in the pris-tine graphene. The MD simulation snapshots are shown in Fig. 4. The intrinsic ripples on a graphene monolayer are clearly diminished as strain increases. The ripple amplitude variation upon stretching is shown in Fig. 5a. Initially, the surface has no constraint allowing the out-of-plane displacement of 0.7 Å. However, as strain is ap-plied, the ripple amplitude decreases sharply, indicating that ripple effect disappears rapidly at a small strain.
In the second region, the tangent slopes begin to de-crease because the effect of C–C bond stretching emerges, competing with the effect of ripples. The length of the C–C bonds is calculated to investigate whether the C–C bond stretching begins after the ripples flat-ten or at the same time with the reduction in the rip-ple amplitude. There are two types of the C–C bonds
that are parallel and oblique to the applied loading direction as shown in Fig. 1. Twenty C–C bonds are randomly selected for each type, and their lengths are averaged. The standard deviation of the C–C bonds length for 20 samples is calculated as 0.0002, showing a uniform variation. As shown in Fig. 5b, the C–C bonds are stretched as soon as stretching is applied. However, as seen in the feature of the second derivatives of the C–C
b
a
1.1Å
-1.1Å
Fig. 4Snapshots of the MD simulations showing the out-of-plane
fluctuation of a monolayer graphene at 300 K with (a) 0 % strain and (b) 0.5 % strain
a
b
c
0 2 4 6 8 10
2 4 6 8 10 12 14 16 18
Second derivative of parallel C-C bonds (Å)
Strain (%)
0 2 4 6 8 10 12
1.40 1.45 1.50 1.55
C-C bond length (Å
)
Strain (%) Parallel
Oblique
0 2 4 6 8 10 12
0.3 0.4 0.5 0.6 0.7
Ripple amplitudes (Å
)
Strain (%)
Fig. 5aRipple amplitude variation.bC–C bond length (black
[image:4.595.304.539.90.570.2] [image:4.595.57.292.405.692.2]bond stretching in Fig. 3c, the bond stretching is nonlinear initially and turns to linear, indicating that ripples affect bond stretching at the initial stage of loading. The initial average ripple amplitude is less than 1 Å, which is com-parable to the bonding length. Thus, the uniaxial loading affects simultaneously both the reduction in the ripple amplitude and the increase of the length of C–C bonds, although the effect of bond stretching is not considerably large at the initial stage.
In the third region, the second derivatives are almost constant, indicating quadratic stress-strain behavior. In this region, although the ripple amplitude decreases con-tinuously, the fluctuation reduction is small so the effect of the C–C bond stretching is dominant.
Recently, DFT calculations showed that strain-induced hardening in the out-of-plane acoustic phonon mode explains the absence of rippling in graphene under a biaxial strain [37, 38]. In the study, the vari-ation of the coefficients A and B in w2=Ak4+Bk2 of elasticity model has been calculated as a function of strain [37]. As strain increases, the phonon dispersion curve in the z direction changes from quadratic to lin-ear, representing the strain hardening. The strain hard-ening in the out-of-plane atomic motion results in suppressing the ripple amplitudes. The DFT calculation results are well comparable to our MD simulations al-though the DFT calculations are studied under a biaxial strain. For example, the crossover of the Aand B vari-ance in the DFT calculation is around 1.7 % strain, which agrees with the strain of the maximum tangent modulus in our MD simulation. In addition, the quad-ratic relation in the out-of-plane phonon mode changes to linear after 5 % strain in the DFT calculation, while the linear bond stretching occurs after 4 % strain in our MD simulations as shown in Fig. 5c.
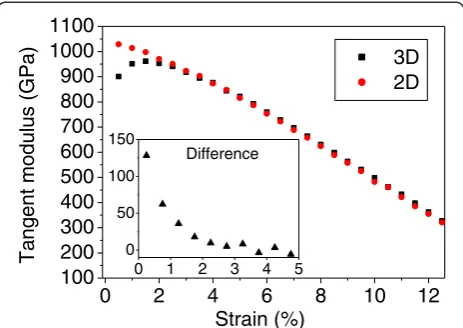
To confirm the effect of intrinsic ripples on the mech-anical behavior, 2D MD simulations are performed. In 2D simulations, no space is given in the zdirection and the z-components of velocities and forces are removed at every time step in order to prevent the atoms from moving in thezdirection. Figure 6 shows a comparison of tangent moduli between 2D and 3D simulations. Un-like the 3D case, the tangent modulus in 2D continu-ously decreases from the beginning of the test. To emphasize the effect of ripples, the difference between 3D and 2D tangent moduli is shown in the inset figure. First, the difference is about 130 GPa, which represents the amount of elasticity softening due to ripples. The softening effect reduces rapidly as strain increases, and the difference becomes almost zero after about 4 % strain: the rippling effect is diminished, and the mechan-ical behavior follows the C–C bond stretching responses. A similar trend between the 2D and 3D difference in Fig. 6 and ripple reduction in Fig. 5a confirms that the
nonlinear behavior at a small strain in 3D simulations is due to rippling.
Effect of Ripples on Graphene Elasticity
To investigate the effect of ripples on graphene elasticity, a series of MD simulations is performed with varying temperature since the ripple amplitude highly depends on temperature. The simulations are conducted using the optimized Tersoff potential proposed by Lindsay and Broido [39] together with the REBO potential. The opti-mized Tersoff potential predicted better thermal [39] and mechanical [40] properties of carbon-based nano-structures. Selected MD snapshots at 1000 K with the REBO potential are shown in Fig. 7. Similar to the 300 K case in Fig. 4, the overall ripple amplitudes decrease as strain increases. However, at 1000 K, the maximum rip-ple amplitudes are higher and the shorter wavelength ripples appear with 0 % strain. Notably, as strain in-creases, randomly distributed ripples at 0 % strain tend to align perpendicular to the direction of the applied strain as shown in Fig. 7b. The ripples in the strain dir-ection are suppressed so the perpendicular ripples re-main freely and appear on the surface.
Here, the mechanical behavior at a relatively small strain is focused because entropic contribution due to rippling is dominant at the initial stage as discussed pre-viously. Selected results are shown in Fig. 8a, b, which are obtained using the REBO and Tersoff potential, re-spectively. For the Tersoff potential, defects and bond breaking are observed beyond a temperature of 1200 K during equilibration, so the stress responses are calcu-lated up to 1200 K. As the temperature increases, the initial slope of the stress-strain curves decreases, lower-ing the elastic modulus. In particular, at 2000 K in Fig. 8a, a nonlinear relationship analogous to entropic elastic behavior is shown clearly from the beginning of
0 2 4 6 8 10 12
100 200 300 400 500 600 700 800 900 1000 1100
T
angent modulus (GPa)
Strain (%)
3D 2D
0 1 2 3 4 5
0 50 100 150
Difference
Fig. 6Tangent modulus of 3D (black squares) and 2D (red dots) MD
[image:5.595.306.538.89.253.2]the curve. To more clearly observe the slope change, the tangent modulus is calculated in Fig. 8c, d. For the REBO potential shown in Fig. 8c, the tangent elastic moduli increase initially and decrease without a con-stant region after reaching the maximum at all different temperature ranges, even at extremely low temperature (1 K). The large reduction at high temperature is due to the increase of thermal fluctuation, which leads to the enhancement of the entropic contribution. In addition, as temperature increases, the location of the maximum slope moves toward a higher strain because a larger strain is needed to flatten the enlarged ripples at higher temperature. For the Tersoff potential shown in Fig. 8d, the trend at low temperature is different. The initial in-crease shown in the REBO potential is not observed at 1 and 300 K. The curve of 1 K almost matches with the 2D simulation. The results indicate that the softening effect due to ripples is not significant at low temperature for the Tersoff potential compared to the REBO potential.
Figure 9a shows the temperature-dependent elasticity calculated from the 2D and 3D MD simulations. For 3D simulations, the initial and maximum values of the tan-gent modulus are selectively shown. For 2D simulations, the initial and maximum values are the same since elas-ticity decreases through the entire strain range. For 2D simulations, the elasticity does not change significantly with varying temperature since there is no rippling ef-fect. The slightly decreasing elasticity in 2D is due to the thermal effect on the C–C bond stretching. The decreas-ing slope is larger for the Tersoff potential (blue open squares) than for the REBO potential (black squares). In
a
b
1.5
Å
-1.5
Å
Fig. 7Snapshots of the MD simulations showing the out-of-plane
fluctuation of a graphene monolayer at 1000 K with (a) 0 % strain and (b) 0.5 % strain
0.0 0.5 1.0 1.5 2.0 2.5 3.0 3.5 500
550 600 650 700 750 800 850 900 950 1000
Tangent modulus (GPa)
Strain (%) 1 K 300 K 1000 K 2000 K
0.0 0.5 1.0 1.5 2.0 2.5 3.0 3.5 650
700 750 800 850 900 950 1000 1050
T
a
ngent modulus (GPa)
Strain (%) 1 K 300 K 1000 K 0.0 0.5 1.0 1.5 2.0 2.5 3.0 3.5
0 5 10 15 20 25 30 35
a
b
c
d
S
tre
ss (GP
a
)
Strain (%) 1K
300K 1000K 2000K
0.0 0.5 1.0 1.5 2.0 2.5 3.0 3.5 0
5 10 15 20 25 30 35
S
tre
ss (GP
a
)
Strain (%) 1 K 300 K 1000 K
Fig. 8aStress-strain response using the REBO potential.bStress-strain response using the Tersoff potential.cTangent modulus using the REBO
[image:6.595.56.291.87.396.2] [image:6.595.62.538.478.704.2]3D simulations, for the REBO and Tersoff potential, both the maximum and initial elasticity decrease almost linearly as the temperature increases. This reduction fol-lows the tendency of increasing out-of-plane displace-ments shown in Fig. 10, showing a linear increase depending on temperature. The decreasing slope of the Tersoff potential is larger than that of the REBO poten-tial, suggesting that the Tersoff potential is more sensi-tive to change in temperature. For the Tersoff potential, at 200 K, the maximum and initial elasticity are the same due to the continuous decrease in the tangent modulus as shown in Fig. 8d. These differences between REBO and Tersoff can be explained by change in ripple
[image:7.595.58.291.88.428.2]amplitudes shown in Fig. 10. For the Tersoff potential, the ripple amplitudes increase more sharply than for the REBO potential. In addition, the ripple amplitudes are lower in the low-temperature ranges, resulting in weaker elasticity softening than the REBO potential.
Figure 9b shows the amount of elasticity softening due to rippling, which is calculated by subtracting the 3D values from the 2D results. For the REBO potential, at 300 K, the maximum and initial elasticity are reduced by 7.4 and 9.6 %, respectively. As the temperature increases, the softening increases almost linearly and at 2000 K, elasticity softening reaches 16.5 and 35.3 % for the maximum and initial elasticity, re-spectively. For the Tersoff potential, the maximum elasticity softening almost agrees with the REBO poten-tial. However, the initial elasticity reduction is smaller and similar to the maximum elasticity softening at low temperature due to the smaller ripple amplitudes. The ripple amplitude at 300 K is reported as 0.6 Å [13], which is between the REBO (0.7 Å) and Tersoff poten-tial (0.5 Å). The optimized Tersoff potenpoten-tial proposed by Lindsay and Broido shows better thermal conductiv-ity since the optimization is focused on the in-plane modes rather than the out-of-plane mode [39]. Good agreement of the phonon dispersion for the in-plane modes may result in reduction of ripple amplitudes, possibly underestimating elasticity softening of gra-phene. Recently, a new potential has been proposed [41, 42] by Monteverde, Migliorato and Powell, which refers to as MMP potential, and predicted better pho-non dispersion of graphene than the Tersoff and REBO potentials [43]. Although the MMP potential may pro-duce more accurate results, it is expected that the trend of the temperature-dependent elasticity softening is similar.
400 800 1200 1600 2000
600 650 700 750 800 850 900 950 1000 1050
a
b
E
lasti
city
(GP
a
)
Temperature (K)
2D max. (REBO) 3D max. (REBO) 3D initial (REBO) 2D max. (Tersoff) 3D max. (Tersoff) 3D initial (Tersoff)
400 800 1200 1600 2000
5 10 15 20 25 30 35 40
El
astici
ty
softening due to ri
ppl
e
s (%)
Temperature (K)
Max. (REBO) Initial (REBO) Max. (Tersoff) Initial (Tersoff)
Fig. 9aVariation of tangent modulus at increasing temperature:
2D maximum tangent modulus using the REBO potential (black squares), 3D maximum tangent modulus using the REBO potential (red dots), 3D initial tangent modulus using the REBO potential (green triangles), 2D maximum tangent modulus using the Tersoff potential (blue open squares), 3D maximum tangent modulus using the Tersoff potential (cyan stars), and 3D initial tangent modulus using the Tersoff potential (pink open circles).bThe amount of temperature-dependent elasticity softening: maximum tangent modulus using the REBO potential (black squares), initial tangent modulus using the REBO potential (red dots), maximum tangent modulus using the Tersoff potential (green triangles), and initial tangent modulus using the Tersoff potential (blue open squares)
400 800 1200 1600 2000
0.4 0.5 0.6 0.7 0.8 0.9 1.0 1.1 1.2 1.3
Ripple amplitudes (
Å
)
Temperature (K)
[image:7.595.305.539.88.258.2]REBO Tersoff
Fig. 10Variation of intrinsic ripple amplitudes of a monolayer
Conclusions
In this study, the mechanical behavior of the graphene monolayer under a uniaxial tensile test is investigated using MD simulations with a focus on the effect of intrin-sic ripples. The simulations reveal that graphene as a 2D material shows nonlinear mechanical behavior even at a small strain, where the response is analogous to entropic elastic behavior such as that of biomaterials [36]. In the graphene monolayer, the entropic contribution is attrib-uted to the intrinsic ripples. Graphene under uniaxial ten-sion undergoes competition of entropic contribution due to the rippling and energetic contribution as a result of the C–C bond stretching. The elastic softening increased almost linearly as temperature increases since ripple am-plitudes increase. The study implies that the mechanical properties of graphene such as elasticity can change ac-cording to the intrinsic ripple amplitudes, which depend on various environmental conditions such as temperature, van der Waals interactions with a substrate, and the num-ber of graphene layers. The understanding can be useful for strain-based ripple manipulation in graphene engineer-ing. Recently, it has been reported that the controlling bandgap of graphene was possible by the formation of large ripples under compressive strain [43]. Large and regular ripple formation based on compressive strain will be a future work for engineering applications.
Competing interests
The author declares that he has no competing interests.
Acknowledgements
This research was supported by the Dongguk University Research Fund of 2015.
Received: 6 September 2015 Accepted: 21 October 2015
References
1. Blake P, Brimicombe PD, Nair RR, Booth TJ, Jiang D, Schedin F,
Ponomarenko LA, Morozov SV, Gleeson HF, Hill EW, Geim AK, Novoselov KS (2008) Graphene-based liquid crystal device. Nano Lett 8:1704–1708. 2. Bonaccorso F, Sun Z, Hasan T, Ferrari AC (2010) Graphene photonics and
optoelectronics. Nat Photon 4:611–622
3. Wang H, Yang Y, Liang Y, Robinson JT, Li Y, Jackson A, Cui Y, Dai H (2011) Graphene-wrapped sulfur particles as a rechargeable lithium–sulfur battery cathode material with high capacity and cycling stability. Nano Lett 11:2644– 2647.
4. Xiao J, Mei D, Li X, Xu W, Wang D, Graff GL, Bennett WD, Nie Z, Saraf LV, Aksay IA, Liu J, Zhang J-G (2011) Hierarchically porous graphene as a lithium–air battery electrode. Nano Lett 11:5071–5078.
5. Xiang H, Zhang K, Ji G, Lee JY, Zou C, Chen X, Wu J (2011) Graphene/ nanosized silicon composites for lithium battery anodes with improved cycling stability. Carbon 49:1787–1796.
6. Wang JT-W, Ball JM, Barea EM, Abate A, Alexander-Webber JA, Huang J, Saliba M, Mora-Sero I, Bisquert J, Snaith HJ, Nicholas RJ (2013) Low-temperature processed electron collection layers of graphene/TiO2nanocomposites in thin film perovskite solar cells. Nano Lett 14:724–730.
7. Yin Z, Zhu J, He Q, Cao X, Tan C, Chen H, Yan Q, Zhang H (2014) Graphene-based materials for solar cell applications. Adv Energ Mater 4:1300574. 8. Wu J, Becerril HA, Bao Z, Liu Z, Chen Y, Peumans P (2008) Organic solar cells
with solution-processed graphene transparent electrodes. Appl Phys Lett 92:263302
9. Li X, Zhu Y, Cai W, Borysiak M, Han B, Chen D, Piner RD, Colombo L, Ruoff RS (2009) Transfer of large-area graphene films for high-performance transparent conductive electrodes. Nano Lett 9:4359–4363.
10. Meric I, Han MY, Young AF, Ozyilmaz B, Kim P, Shepard KL (2008) Current saturation in zero-bandgap, top-gated graphene field-effect transistors. Nat Nano 3:654–659
11. Xia F, Farmer DB, Lin Y-M, Avouris P (2010) Graphene field-effect transistors with high on/off current ratio and large transport band gap at room temperature. Nano Lett 10:715–718
12. Meyer JC, Geim AK, Katsnelson MI, Novoselov KS, Booth TJ, Roth S (2007) The structure of suspended graphene sheets. Nature 446:60–63 13. Fasolino A, Los JH, Katsnelson MI (2007) Intrinsic ripples in graphene.
Nat Mater 6:858–861
14. Yoon D, Son Y-W, Cheong H (2011) Negative thermal expansion coefficient of graphene measured by Raman spectroscopy. Nano Lett 11:3227–3231 15. Gui G, Jianxin Z, Zhenqiang M (2012) Electronic properties of rippled
graphene. J Phys: Conf Ser 402:012004
16. Bao W, Miao F, Chen Z, Zhang H, Jang W, Dames C, Lau CN (2009) Controlled ripple texturing of suspended graphene and ultrathin graphite membranes. Nat Nano 4:562–566.
17. Lee C, Wei X, Kysar JW, Hone J (2008) Measurement of the elastic properties and intrinsic strength of monolayer graphene. Science 321:385–388 18. Zhang P, Ma L, Fan F, Zeng Z, Peng C, Loya PE, Liu Z, Gong Y, Zhang J,
Zhang X, Ajayan PM, Zhu T, Lou J (2014) Fracture toughness of graphene. Nat Commun 5:3782.
19. Liu F, Ming P, Li J (2007)Ab initiocalculation of ideal strength and phonon instability of graphene under tension. Phys Rev B 76:064120
20. Zhao H, Min K, Aluru NR (2009) Size and chirality dependent elastic properties of graphene nanoribbons under uniaxial tension. Nano Lett 9:3012–3015
21. Zhang H, Duan Z, Zhang X, Liu C, Zhang J, Zhao J (2013) Strength and fracture behavior of graphene grain boundaries: effects of temperature, inflection, and symmetry from molecular dynamics. PCCP 15:11794–11799 22. Grantab R, Shenoy VB, Ruoff RS (2010) Anomalous strength characteristics of
tilt grain boundaries in graphene. Science 330:946–948
23. Wang MC, Yan C, Ma L, Hu N, Chen MW (2012) Effect of defects on fracture strength of graphene sheets. Comput Mater Sci 54:236–239
24. Liu Y, Chen X (2014) Mechanical properties of nanoporous graphene membrane. J Appl Phys 115:034303
25. Mortazavi B, Ahzi S (2013) Thermal conductivity and tensile response of defective graphene: a molecular dynamics study. Carbon 63:460–470 26. Cao A, Qu J (2013) Atomistic simulation study of brittle failure in
nanocrystalline graphene under uniaxial tension. Appl Phys Lett 102:071902 27. Zhang T, Li X, Kadkhodaei S, Gao H (2012) Flaw insensitive fracture in
nanocrystalline graphene. Nano Lett 12:4605–4610
28. Cadelano E, Palla PL, Giordano S, Colombo L (2009) Nonlinear elasticity of monolayer graphene. Phys Rev Lett 102:235502
29. Wei X, Fragneaud B, Marianetti CA, Kysar JW (2009) Nonlinear elastic behavior of graphene:ab initiocalculations to continuum description. Phys Rev B 80:205407
30. Lui CH, Liu L, Mak KF, Flynn GW, Heinz TF (2009) Ultraflat graphene. Nature 462:339–341
31. Steve P (1995) Fast parallel algorithms for short-range molecular dynamics. J Comput Phys 117:1–19
32. Donald WB, Olga AS, Judith AH, Steven JS, Boris N, Susan BS (2002) A second-generation reactive empirical bond order (REBO) potential energy expression for hydrocarbons. J Phys: Condens Matter 14:783 33. Lee S, Park J, Yang J, Lu W (2014) Molecular dynamics simulations of
the traction-separation response at the interface between PVDF binder and graphite in the electrode of Li-ion batteries. J Electrochem Soc 161:A1218–A1223
34. Lee S, Park J, Sastry AM, Lu W (2013) Molecular dynamics simulations of SOC-dependent elasticity of LixMn2O4spinels in Li-ion batteries. J Electrochem Soc 160:A968–A972
35. Ortiz C, Hadziioannou G (1999) Entropic elasticity of single polymer chains of poly(methacrylic acid) measured by atomic force microscopy. Macromolecules 32:780–787
36. Buehler MJ, Wong SY (2007) Entropic elasticity controls nanomechanics of single tropocollagen molecules. Biophys J 93:37–43
38. Jha PK, Soni HR (2014) Strain induced modification in phonon dispersion curves of monolayer boron pnictides. J Appl Phys 115:023509 39. Lindsay L, Broido DA (2010) Optimized Tersoff and Brenner empirical
potential parameters for lattice dynamics and phonon thermal transport in carbon nanotubes and graphene. Phys Rev B 81:205441
40. Bohayra M, Gianaurelio C (2014) Atomistic modeling of mechanical properties of polycrystalline graphene. Nanotechnology 25:215704 41. Monteverde U, Migliorato MA, Pal J, Powell D (2013) Elastic and vibrational
properties of group IV semiconductors in empirical potential modelling. J Phys: Condens Matter 25:425801
42. Monteverde U, Migliorato MA, Powell D (2012) Empirical interatomic potential for the mechanical, vibrational and thermodynamic properties of semiconductors. J Phys: Conf Ser 367:012015
43. Monteverde U, Pal J, Migliorato MA, Missous M, Bangert U, Zan R, Kashtiban R, Powell D (2015) Under pressure: control of strain, phonons and bandgap opening <?show [?A3B2 show $9#?]?>in rippled graphene. Carbon 91:266– 274.
Submit your manuscript to a
journal and benefi t from:
7Convenient online submission 7Rigorous peer review
7Immediate publication on acceptance 7Open access: articles freely available online 7High visibility within the fi eld
7Retaining the copyright to your article