MVC BASED NORMALIZATION TO IMPROVE THE
CONSISTENCY OF EMG SIGNAL
1M.I SABRI, 2M.F MISKON, 3M.R YAACOB,4
ABD SAMAD HASAN BASRI, 5YEWGUAN SOO, 6W.M.BUKHARI
1,2,3,6
Universiti Teknikal Malaysia Melaka, Faculty of Electrical Engineering, Melaka, Malaysia 4
Universiti Teknikal Malaysia Melaka, Faculty of Information and Communication Technology, Melaka,
Malaysia 5
Universiti Teknikal Malaysia Melaka, Faculty of Electronic and Computer Engineering, Melaka, Malaysia
E-mail: [email protected], [email protected], [email protected],
4
[email protected], [email protected] , [email protected]
ABSTRACT
Electromyography (EMG) is a study of muscle function through analysis of electrical activity produced from specific muscle of interest. This electrical activity which is displayed in form of signal as the manifestation of neuromuscular activation associated with muscle contraction. The most well-known technique of EMG signal recording are by using surface (non-invasive) and needle/wire (invasive) electrode. This research focus on surface electromyography (sEMG) signal. During sEMG recording, there are several problems had to be encountered i.e. noise, motion artifact, signal instability, cross talk and signal inconsistency. Inconsistency here refers to the variation of the quantity of EMG features with respect to the quantity of force produce by the muscle. In addition, inconsistency of features to force mapping occurs across different person as well as across different reading of an individual. Inconsistency is due to muscle strength and size, cross talk, signal to noise ratio (SNR), signal bandwidth and fatigue condition. Inconsistency causes nonlinearity or linearity relationship between features to force mapping. Previous method introduce to solve the inconsistency across different reading of an individual but the problem lies on reading across different person. Thus, this paper presents a method to solve the inconsistency of EMG signal across different person by normalizing the EMG based on percentage of maximal voluntary contraction adaptive with muscle endurance (pre-fatigue), %MVCPF. This method is based on a hypothesis that Integrated EMG (IEMG), Mean Absolute Value (MAV), Root Mean Square (RMS), Sum Square Integral (SSI) and standard deviation features are directly proportional to %MVCPF of all person. There are 2 indicator to measure the inconsistency problem which are p-value must be less than 0.05 and the root mean square error of regression must be less than 10%. The results show that p-value of each person signal after normalizing is 0.0126 which is less than 0.05. In addition, the results for root mean square error of regression show IEMG, MAV, RMS, SSI and standard deviation features are less than 10%. These shows the improve normalizing method give the better results to solve inconsistency reading problem across different person. For the conclusion, an objective which is to solve inconsistency features to force mapping issue of different person successful solve.
Keywords: Surface Electromyography (sEMG), Feature Extraction, Nonlinear, ANOVA, MVCPF
1. INTRODUCTION
Electromyography (EMG) is a study of muscle function through analysis of electrical activity produced from specific muscle of interest [1].This electrical activity which is displayed in form of signal is the manifestation of neuromuscular activation associated with muscle contraction. The
Inconsistency here refers to the variation of the quantity of EMG features with respect to the quantity of force produce by the muscle. In addition, inconsistency of features to force mapping occurs across different person as well as across different reading of an individual. Inconsistency is due to muscle strength and size, signal cross talk, biological factor of i.e. muscle fatigue[12], signal bandwidth[13] and signal to noise ratio[14]. Furthermore, inconsistency causes non-linear or linear relationship between features to force of mapping. There are several methods that currently used to solve the inconsistency problem researchers in [4, 15, 16] proposed by using Bayesian function based on separable class to solve inconsistency of features to force relationship but the class conditional probability density should be identified by a large number of experiment toward the same person only. However, work done by An-Chih et al [10] and Sarojin et al [17] proposed support vector machine (SVM) to solve inconsistency of multi-channel features to force relationship and accuracy 93% of EMG features to force relationship. However, SVM is not satisfactory in real time processing which is quadratic programming problem that arises form SVM, mostly relying on heuristic for breaking the problem down into smaller and more-manageable chunks. Researchers [18, 19] proposed Hill based muscle adaptive with neural network and accuracy 90%.However, this method have disadvantage because it is unique for certain condition and situation only which is for same person with same situation only. Work done by[6] and [20] proposed Back propagation Neural network and shown the accuracy of classification 97.5%. However, when using this method need to be select the low suitable number of hidden layer due to delay time issue and need to justify the value of threshold in learning machine. In [2] works proposed by using a novel feature i.e modified mean absolute 1 and modified mean absolute 2 features. For modified mean absolute 1 feature by implement window function to the sEMG signal with normalize the signal amplitude by 1 value when the muscle activity appears and 0.5 value for the antagonist condition. For modified mean absolute 2 feature by implement 3 stage of window function which are activation stage, steady stage and deactivation stage with different normalizing coefficient. This method give the 90% accuracy. However, this method only solve the consistency problem on individual reading. For this reason, SVM, Bayesian, Neural network and Hill
model will not work in situation where the features to force relationship across different person based on the problem address. This paper present a method that by calibrate the EMG to force based percentage of maximal voluntary contraction
adaptive with muscle endurance
(pre-fatigue),%MVCPF to solve the inconsistency problem. This method is based on a hypothesis that IEMG,MAV,RMS,SSI and std features are directly proportional to %MVCPF of a person. This means that, if we can estimate the force applied by specific EMG feature value.
2. DATA ACQUISITION
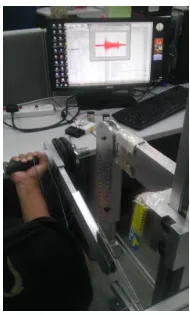
[image:2.595.353.448.563.721.2]In order to validate the hypothesis, an experiment was conducted. The objective of the experiment is to solve the inconsistency of feature to force relationship across different person. The sEMG signal was acquire from the biceps brachii muscle (refer in SENIAM group muscle position) of 6 healthy person which is consist of 4 male and 2 female with an average age of 24.6, average BMI 23.5, and average muscle size 27.4cm by using a Z03-002 EMG Preamplifier gain 300 with consist of medical grade stainless steel surface electrode on the dominant hand [21]. All the person had no history of neuromuscular problem and no experience in weight training. Before the experiment conducted all the persons were asked to take completely rest at least for 12 hours. All the person were asked to fill up a consent form for volunteer before start an experiment. The sEMG data sampling frequency was set at 1kHz using NI-USB-6009, 14 bit, 48k/s multifunction input/output and attach with Z03-002 EMG Preamplifier. Then connect to the PC by using type-B cable as shown in figure 1.
2.1 Skin Preparation
The skin preparation procedure is recommended in order to increase the signal to noise ratio value. This is because the skin surface influence by high noise environment came from man factors like skin impedance (hair and skin dirty / die skin), electrode position, skin sweater and signal cross talk. Thus, the god skin preparation need to be done before acquire the sEMG signal by undergo the specific experimental procedure. Firstly, skin must be cleaned by shaved the hair to reduce impedance on the biceps brachii skin surface. Next, in order to clean up the shaved hair and dirty particle from the skin surface commonly alcohol prep used in this procedure. The last sequence in this procedure is measure the skin impedance by using digital multi meter to check the skin impedance less than 5kΩ for good quality of sEMG signal in term of signal to noise ratio value. If the impedance reading high than 5kΩ, then the skin need to be prepare again until less than 5kΩ.
2.2 Experiment Procedure
[image:3.595.283.510.73.235.2]In this experiement, 6 of healthy subjects were ask to perform the lifting task during flexion-extension of elbow task (muscle isotonic contraction). A range of dynamics contraction was from a full extension ((θe= 0 º, forearm in the vertical position) to a full flexion (approximately θe = 145 º) with 16 second duration of time (4 second full elbow extension position, θe= 0 º , 2 second transition from extension to flexion, θe= 0-145 º, 4 second at full elbow flexion θe= 145 º, 2 second transition from flexion to extension, θe= 145-0 º, 4 second at full elbow extension position, θe= 0º). All the subject ask to done lifting task with descending percentage of Maximum Voluntary contraction (MVC) which is from 100% of MVC until 0% of MVC. In order to avoid the fatigue issue each of repeated task consist of relaxation period about 10- 30 minutes depend on the muscle condition. Each of the percentage sub MVC will be repeated 10 times for ensure the reliable result. The experiment setup shown in figure 2.
Figure 2: Experiment of isokinetic muscle contraction
3. NORMALIZING EMG BASED ON
PERCENTAGE MAXIMUM
VOLUNTARY CONTRACTION OF MUSCLE ADAPTIVE WITH MUSCLE ENDURANCE IN PRE-FATIGUE STAGE
Each of human has a different strength of their muscle, so the problem lies on compare the real strength of their muscle without a same ground truth line which is cause to inconsistency problem of sEMG signal. As stated in the previous section, most of the researchers using maximal/maximum
voluntary contraction of muscle as the
normalization tool but the inconsistency issues across high variation of person remain exist. Thus, this improving idea by using percentage maximal voluntary contraction adaptive with muscle endurance in pre-fatigue stage propose to solve the inconsistency across different person EMG reading.
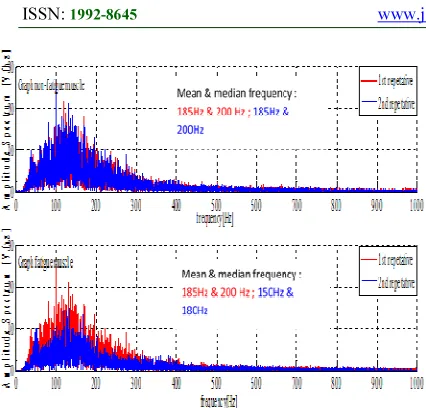
Figure 3: Graph Amplitude Spectrum comparison between non-fatigue and fatigue muscle condition
4. SIGNAL PROCESSING AND FEATURES EXTRACTION
The raw sEMG signal need to be process before correlate the relationship between force to IEMG, MAV, RMS, SSI and standard deviation features. All the raw sEMG signal undergoes the same processing strategy which are filtering using
Butterworth 2nd order bandpass filter 1Hz – 100Hz,
rectify using full-wave rectifier, and last get the “linear envelope” using low pass filter 1Hz subsequently.
From the “linear envelope” shape of sEMG the extraction valuable information (features) take into account i.e integrated EMG (IEMG), mean absolute value (MAV), root mean square (RMS), simple square integral (SSI) and standard deviation in time domain.
Integrated EMG feature is summation of absolute values of the sEMG signal amplitude. Basically, IEMG is act as onset index to detect the muscle activity for control command of assistive device[21]. It is related to the sEMG signal sequence firing point, which can be expressed as : where N stand for length of the signal and xn denotes the sEMG signal in segment
IEMG =
∑
=
N
n n
x
1
(1)
Mean absolute value (MAV) feature is equivalent to average rectified value (ARV). It can
be calculated using the moving average of full-wave rectified EMG. It is an easy way for detection of muscle contraction levels and it is a popular feature used in myoelectric control application[21]. It is represent as:
MAV =
∑
= N
n n
x
N
1
1
(2)
Root mean square (RMS) is model as amplitude modulated Gaussian random process which is related to the constant force and non-fatiguing contraction[21]. It can be define as:
RMS =
∑
=
N
n n
x
N
12
1
(3)
Standard deviation features is generally
represent the confidence interval in statistical data of sEMG signal. A low standard deviation indicate that the data points tend to be very close to mean and vice versa if a high standard deviation value[21].
STD =
∑
=
−
N
n n
x
N
12
1
1
(4)
Simple square integral (SSI) is summation absolute square energy of sEMG signal in time domain. In control prosthetic robot commonly used the energy contain in sEMG signal as one of the features[2].
SSI =
2
1
∑
=
N
n n
x
(5)5. RESULTS AND DISCUSSION
[image:5.595.321.495.142.251.2]
around overall mean. If variation within group are small relative to variations between groups, a difference in group means may be inferred. Hypothesis test are used to quantify decisions. In this experiment, the alpha value sets to be 0.05. If the p-value of each sample is higher than 0.05 thus the null hypothesis is reject which means that the data has significant different as shown in figure 4 (before normalizing). If the p-value of each sample is less than 0.05, thus the null hypothesis is accept which means that the data has not significant different as shown in figure 5 (after normalizing,).
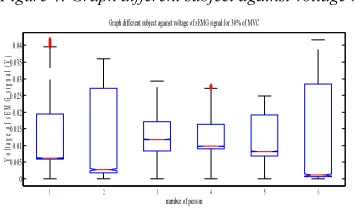
Figure 4: Graph different subject against voltage of
sEMG signal before normalizing using MVCPF
In figure 4 graph, show that variance of data for each person are significant different at the upper boundary of the signal and also the mean of the signal and also the mean of the signal different but p-value between sample subject 1 and 2 is 0.1359. The same relationship apprear which is the variance of data (person 1,2 and 3) are significant different at the upper boundary of the signal and the mean of the signal different but p-value between sample person 1,2, and 3 is 0.0271. The same relationship apprear which is the variance of data (person 1,2,3 and 4) are significant different at the upper boundary of the signal and the mean of the signal different but p-value between sample person 1,2,3 and 4 is 0.0046. The same relationship apprear which is the variance of data (person 1,2,3,4 and 5) are significant different at the upper boundary of the signal and the mean of the signal different but p-value between sample person 1,2,3,4 and 5 is 0.1707. The same relationship apprear which is the variance of data (person 1,2,3,4,5 and 6) are significant different at the upper boundary of the signal and the mean of the signal different but p-value between sample person 1,2,3,4,5 and 6 is 0.0726. For that reason the hypothesis reject because of the value of p-value is 0.0726 higher than 0.05 which is 5% error.
[image:5.595.98.275.291.395.2]
Figure 5: Graph different subject against voltage of sEMG signal after normalizing using MVCPF
In figure 5 graph, show that variance of data each person (person 1 and 2) are significant different at the upper boundary of the signal and also the mean of the signal different but p-value between sample person 1 and 2 is 0.0135. The same relationship apprear which is the variance of data (person 1,2 and 3) are significant different at the upper boundary of the signal and the mean of the signal different but p-value between sample person 1,2, and 3 is 0.0171. The same relationship appear which is the variance of data (person 1,2,3 and 4) are significant different at the upper boundary of the signal and the mean of the signal different but p-value between sample person 1,2,3 and 4 is 0.0146. The same relationship apprear which is the variance of data (person 1,2,3,4 and 5) are significant different at the upper boundary of the signal and the mean of the signal different but p-value between sample person 1,2,3,4 and 5 is 0.018. The same relationship apprear which is the variance of data (person 1,2,3,4,5 and 6) are significant different at the upper boundary of the signal and the mean of the signal different but p-value between sample person 1,2,3,4,5 and 6 is 0.0126. For that reason the hypothesis accept because of the value of p-value is 0.0126 less than 0.05 which is 5% error.This shown that after normlaizing, the sEMG signal show more consistent value compare to before normalizing using MVCPF method.
0 0.005 0.01 0.015 0.02 0.025 0.03 0.035 0.04
1 2 3 4 5 6
number of person
V o lt a g e o f sE M G s ig n a l (V )
Graph different subject against voltage of sEMG signal for 30% of MVC
0 0.005 0.01 0.015 0.02 0.025 0.03 0.035
1 2 3 4 5 6
number of person
V o lt a g e o f sE M G s ig n a l (V )
Root mean square error in regression
Figure 6: Graph rms error of regression for IEMG feature before (blue bar) and after (orange bar)
normalizing across different person
Figure 7: Graph rms error of regression for MAV feature before (blue bar) and after (orange bar) normalizing
across different person
Figure 8: Graph rms error of regression for RMS feature before (blue bar) and after (orange bar) normalizing
across different person
Figure 9: Graph rms error of regression for SSI feature before (blue bar) and after (orange bar) normalizing
across different person
Figure 10: Graph rms error of regression for Standard deviation feature before (blue bar) and after (orange bar)
normalizing across different person
person 1,2,3,4,5 and 6 are from range 23% to 41%. This show that inconsistency problem across different person are high. However, after done calibration method all the rms error of regression show the less than 10% error which is from 8.21% to 8.45%.
6. CONCLUSION
As the conclusion, the objective achieve to solve
the inconsistency issue across different person. The result show that the p-value is less than 0.05 which is there are no significant different after done calibration method. Moreover, the root mean square error of regression of IEMG,MAV,RMS,SSI and standard deviation features show the consistent error value which is from 8.21%-8.45%. This method maybe helpful in force control system for exoskeleton robot and EMG prosthetic robot.
REFRENCES:
[1] Bai, O., M. Nakamura, and H. Shibasaki,
Compensation of hand movement for patients by assistant force: relationship between human hand movement and robot arm motion. IEEE Trans Neural Sys and
Rehab Eng, 2001. 9: p. 302 - 307.
[2] Angkoon Phinyomark, C.L., and Pornchai
Phukpattaranont A Novel Feature Extraction
for
Robust EMG Pattern Recognition.
JOURNAL OF COMPUTING,
DECEMBER 2009. VOLUME 1( ISSUE 1):
p. 71-80.
[3] Soares, A., et al., The development of a
virtual myoelectric prosthesis controlled by an EMG pattern recognition system based on neural networks. Journal of Intelligent Inf
Sys, 2003. 21: p. 127 - 141.
[4] Jie, L. and Z. Ping, A Novel Myoelectric
Pattern Recognition Strategy for Hand Function Restoration After Incomplete Cervical Spinal Cord Injury. Neural Systems
and Rehabilitation Engineering, IEEE
Transactions on, 2013. 21(1): p. 96-103.
[5] Lukai, L., et al. Whitening of the
electromyogram for improved classification accuracy in prosthesis control. in
Engineering in Medicine and Biology Society (EMBC), 2012 Annual International Conference of the IEEE. 2012.
[6] Subasi, A., M. Yilmaz, and H.R. Ozcalik,
Classification of EMG signals using wavelet
neural network. Journal of Neuroscience
Methods, 2006. 156(1–2): p. 360-367.
[7] Chicoine, C.L., A.M. Simon, and L.J.
Hargrove. Prosthesis-guided training of
pattern recognition-controlled myoelectric prosthesis. in Engineering in Medicine and Biology Society (EMBC), 2012 Annual International Conference of the IEEE. 2012.
[8] Lewis, G. and E. Perreault, An assessment of
robot-assisted bimanual movements on upper limb motor coordination following stroke. IEEE Trans Neural Sys and Rehab
Eng, 2009. 17: p. 595 - 604.
[9] Sezgin, N., Analysis of EMG Signals in
Aggressive and Normal Activities by Using Higher-Order Spectra. The Scientific World
Journal, 2012. 2012: p. 5.
[10] An-Chih, T., L. Jer-Junn, and L. Ta-Te. A
modified multi-channel EMG feature for upper limb motion pattern recognition. in
Engineering in Medicine and Biology Society (EMBC), 2012 Annual International Conference of the IEEE. 2012.
[11] Vitiello, N., et al., NEUROExos: A Powered
Elbow Exoskeleton for Physical Rehabilitation. Robotics, IEEE Transactions
on, 2013. 29(1): p. 220-235.
[12] Venugopal, G., M. Navaneethakrishna, and
S. Ramakrishnan, Extraction and analysis of
multiple time window features associated with muscle fatigue conditions using sEMG signals. Expert Systems with Applications,
2014. 41(6): p. 2652-2659.
[13] Shaw, D. and H. Chih Ren. Assessing muscle
fatigue by measuring the EMG of biceps brachii. in Biomedical Engineering and Informatics (BMEI), 2010 3rd International Conference on. 2010.
[14] Clancy, E.A., E.L. Morin, and R. Merletti,
Sampling, noise-reduction and amplitude estimation issues in surface electromyography. Journal of Electromyography and Kinesiology, 2002.
12(1): p. 1-16.
[15] Sahin, U. and F. Sahin. Pattern recognition
with surface EMG signal based wavelet transformation. in Systems, Man, and Cybernetics (SMC), 2012 IEEE International Conference on. 2012.
[16] Sanger, T.D., Bayesian Filtering of
Myoelectric Signals. Journal of
Neurophysiology, 2007. 97(2): p.
1839-1845.
[17] Sarojini, B., N. Ramaraj, and S. Nickolas,
Classifier by Kernel F-Score Feature Selection. Proceedings of the Second International Conference on Contemporary Computing: August 17-19; Noida, India, 2009: p. 533 - 543.
[18] Qichuan, D., et al. A Novel Motion Estimate
Method of Human Joint with EMG-Driven Model. in Bioinformatics and Biomedical Engineering, (iCBBE) 2011 5th International Conference on. 2011.
[19] Hanqing, Z. and X. Guoqiang. The research
on surface electromyography signal effective feature extraction. in Strategic Technology (IFOST), 2011 6th International Forum on. 2011.
[20] Zhizeng, L., W. Fei, and M. Wenjie. Pattern
Classification of Surface Electromyography Based on AR Model and High-order Neural Network. in Mechatronic and Embedded Systems and Applications, Proceedings of the 2nd IEEE/ASME International Conference on. 2006.
[21] Sabri, M.I., M.F. Miskon, and M.R. Yaacob,
Robust Features Of Surface Electromyography Signal. IOP Conference Series: Materials Science and Engineering,