233
SEGMENTATION OF BLOOD VESSELS USING IMPROVED
LINE DETECTION AND ENTROPY BASED THRESHOLDING
1J. SIVA KUMAR, 2 K. CHITRA
1 Research scholar & Associate Professor, 2 Professor
Department of Electronics and Communication Engineering St. Joseph’s College of Engineering, Chennai, Tamilnadu
INDIA
E-mail: 1 [email protected] , 2 [email protected]
ABSTRACT
Segmented blood vessel from the fundus image provides useful clinical information for the diagnosis and monitoring of eye diseases. In this paper, blood vessels from the green channel of the fundus image are enhanced using a two dimensional matched filter which enhances the contrast of the blood vessel against the background. The contrast enhanced blood vessels are then segmented using line detection algorithms which uses four directional filters. The final segmented vasculature is obtained by integrating the outputs from the directional filters. The proposed algorithm is evaluated using the DRIVE database and better performance is obtained. An accuracy of 0.9488 is achieved using the proposed method against Staal et al [7] method with an accuracy of 0.9442. The effectiveness and simplicity of this method can be used to automate screening for early detection of diabetic retinopathy.
Key Words: Matched Filtering, Line Detection, Entropy Thresholding, Retinal Images, Vessel Segmentation.
1. INTRODUCTION
Segmented blood vessels from the retinal images can help doctors in diagnosis of eye related diseases, screening, assessing the severity of the disease and monitoring the progress of the therapy [1]. Analysis of the retinal pattern may lead to the finding of hypertension, diabetes, arteriosclerosis, cardiovascular disease and stroke [2]-[4]. Blood vessels serve as landmarks for image-guided laser treatment of choroidal neovascularization [5]. Blood vessels show measurable changes in diameter, branching angles and length in case of the above said diseases. Frequent checkups help in monitoring the progress of the disease [6]. Thus a reliable method of vessel extraction would be valuable for the early detection and characterization of changes due to such diseases. Manual Segmentation of the blood vessels from the fundus image is time consuming and requires a physician or a skilled technician. Computerized means of segmenting the retinal vasculature provides consistency and reduces the time required by an expert.
2. OVERVIEW
Several approaches for the segmentation of retinal blood vessels have been reported in the literature. These methods can be classified into two groups as pixel processing methods and
tracking based methods and another
classification as reported in [7] are the rule based method and supervised method. In rule based method, vessel tracking starts with an initial set of seed point and traced along the line of vessel based on the information of the neighborhood [8]-[10]. Matched filtering approach as proposed by Chaudhari [11] and Hoover [12] uses a 2-D Gaussian filter as a kernel and is rotated to match the cross section of a blood vessel profile. In
mathematical morphological schemes,
234 the local maxima of the gradient magnitude and the maximum principal curvature of the Hessian matrix to segment the blood vessels using feature and the spatial information. In [19] blood vessels were detected using the Laplacian operator and detected by means normalized gradient vector field. The supervised method of pixel classification identifies a pixel as vessel or non vessel which is based on learning. Gardner et al [20] proposed a back propagation neural network for segmenting blood vessels. Sinthanayothin et al [21] classified each pixel in the image by using the principal component and edge strength with a multilayer perceptron. Niemeijer et al [22] took a feature vector with Gaussian derivatives and used K-Nearest Neighbor (KNN) classifier to segment the blood vessels. In [23] texture based properties is used as feature vectors and Fuzzy C means (FCM) clustering algorithm is used to classify the feature vectors into vessel or non vessel. Marin et al [24] used a feature vector comprising of five gray level features and two moment invariant features. These seven feature vector input is applied to a feed forward neural network to classify a pixel as blood vessel or background.
3. PROPOSED METHOD
The proposed algorithm comprises of four steps, Contrast enhancement through matched filtering where the blood vessels are enhanced generating a matched filter response (MFR) image, next the MFR image is filtered with a set of direction filters and the outputs are combined, followed by a thresholding scheme that segments the vascular tree and finally the misclassified pixels are removed using length filtering. This method has the advantage of achieving improved results than existing methods with increased ability to detect thin blood vessels with better accuracy.
3.1 Matched Filter Response:
The intensity profile of the blood vessel can be approximated by a Gaussian function [11]. The concept of a matched filter is used to detect piecewise linear segments in retinal images. Since blood vessels have poor contrast a two dimensional matched filter is designed to convolve with
the fundus
image in order to
enhance the blood vessels.
A prototype matched filter kernel can be expressed as
f(x, y) = -exp(x2 / 2 σ2) for │y│ ≤ L/2
where L is the length of the vessel segment for
which the vessel is assumed to have a fixed orientation and the direction of the vessel is assumed to be aligned along the Y-axis.
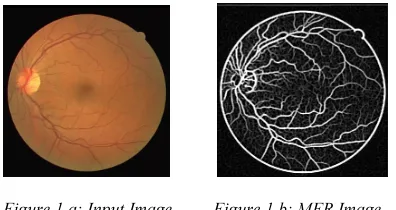
[image:2.595.314.512.404.509.2]A vessel can be oriented in any direction with fixed length and width. The 2-D Gaussian kernel is made to rotate in all possible directions. A kernel of size 16X16 is chosen and is rotated in steps of 15 degrees. The MFR is obtained by taking the maximum value at each pixel from twelve kernels. Thus the retinal image is convolved with 2-D Gaussian kernel rotated in steps and the maximum response of each pixel obtained from the twelve kernels is used to compute the MFR image. For example, the retinal image in Fig. 1(a) with low contrast between blood vessels and background has its MFR version shown in Fig. 1(b), where the blood vessels are significantly enhanced.
Figure 1.a: Input Image Figure 1.b: MFR Image
3.2 Line Detection:
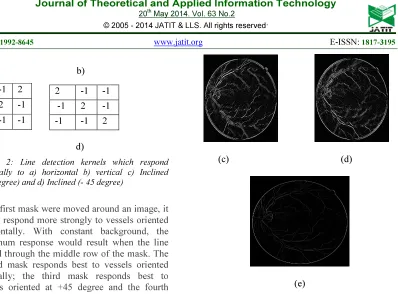
The enhanced blood vessels are oriented in all possible directions. To detect the presence of vessel of a particular width and at a particular orientation we use kernels or masks [25] that would emphasize a certain direction and be less sensitive to other directions. Hence a collection of four such kernels, which respond to lines of single pixel width at the particular orientation, is shown in Fig.2.
-1 -1 -1
2 2 2
-1 -1 -1 -1 2 -1
-1 2 -1
235 a) b)
c) d)
Figure 2: Line detection kernels which respond maximally to a) horizontal b) vertical c) Inclined (+45degree) and d) Inclined (- 45 degree)
If the first mask were moved around an image, it would respond more strongly to vessels oriented horizontally. With constant background, the maximum response would result when the line passed through the middle row of the mask. The second mask responds best to vessels oriented vertically; the third mask responds best to vessels oriented at +45 degree and the fourth mask to vessels aligned in the -45 degree
direction. The MFR image is convolved with the
masks and the results of each mask is shown in Figure 3.(a)-(d). The vessel segments that are extracted from the four directional kernels are joined together following the convolution of the four directional set of vessel segments. These segments that are extracted are joined together to get an image as shown in Fig 3(e)
(a) (b)
(c) (d)
(e)
Figure3: (a)-(d): Output of the MFR image convolved
with Horizontal, Vertical, Inclined (450) and Inclined
(-450) and (e) Combined output of all the kernels.
3.3 Thresholding.
The combined output of the line detection kernels is properly thresholded to remove the vessels from the background. For this a thresholding method based on entropy is used which considers the spatial distribution of grey levels. Hence a local entropy thresholding [26] is used which preserves the spatial structures in the thresholded image. If the correlations among the grey levels are not considered then two different images with an identical image histogram will result in the same threshold value. A way to sort this is to consider the grey-level co-occurrence matrix which contains the information of grey level transitions in an image. The co-occurrence matrix of an image Y is an A X B dimensional
matrix T=[tij] LXL whose elements are specified
by the numbers of transitions between all pairs of grey levels in G ={ 0.1.2…., L-1}. Depending upon the ways in which the grey level follows adjacent pixels, different possible co-occurrence matrices are possible and one co-occurrence matrix is an asymmetric matrix which considers the horizontal right and vertical lower transitions. Thus, ti j is defined as:
-1 -1 2
-1 2 -1
2 -1 -1
2 -1 -1
-1 2 -1
[image:3.595.112.510.73.367.2]236
where if
The probability of co-occurrence of Pi j of grey
levels i and j can therefore be written as
If s, 0 ≤ s ≤ L-1, is a threshold, then s can partition the co-occurrence matrix into four quadrants W, X, Y and Z as shown in Fig.4.
0 S L-1
S
L-1
Figure 4: Quadrants of Co-occurrence matrix
Let us define the following quantities: PW =
P Z =
Normalizing the probabilities such that the sum of the probabilities of each quadrant equals one, the cell probabilities for W and Z is calculated as:
= =
=
for 0 ≤ i ≤ s , 0 ≤ j ≤ s
Likewise,
for s+1 ≤ i ≤ L-1, s+1 ≤ j ≤ L-1
The second order entropy of the object can be defined as
Similarly , the second order entropy of
the background can be written as
Therefore the total second order entropy of the object and the background can be written as
Thus the maximum value of HT (s) gives an
optimum threshold for the grey level to segment the object and background.
3.4 Length Filtering
The image obtained after the thresholding operation contains pixels which are not classified as vessel. In order to produce a clean and complete vessel network these misclassified pixels are removed using length filtering. As in [27] length filtering is used to remove small vessel like structure that are not part of the vascular tree. Connected regions correspond to individual objects that can be removed through length filtering which uses the concept of eight connected neighborhood. Individual objects that resemble vessel like structure but are not part of the vessel are removed. The final segmented image is shown in the Fig.5 and the ground truth image is shown in Fig.6 for the same image
Figure 5: Final Segmented Image
W X
237
Figure 6: Ground Truth Image
4. EXPERIMENTAL RESULTS
The proposed method was implemented in MATLAB version 7.5. The described algorithm was applied step by step to the publicly available DRIVE database containing 40 color images divided into two sets for testing and training. These images are of size 565 X 584 pixels and 8 bits per color channel represented in LZW compressed tiff format. These images were captured from Canon CR5 nonmydriatic CCD
camera at 450 FOV. The database also contains
two manually segmented vessels for each image from two different observers called as ground truth image. Images from the database are preprocessed by taking the green channel from the RGB image since the green channel provides a high contrast between the vessel and the background. The result of our proposed algorithm is compared with ground truth image and the different performance metrics are calculated.
5. PERFORMANCE MEASURES
The segmented image is compared with ground truth image to assess the performance of our algorithm and the performance measures used are True Positive Rate (TPR), False Positive Rate (FPR), Accuracy and Positive Predictive value (PPV). These measures follows from the definitions of parameters like true positive (TP): number of blood vessel pixels correctly detected as blood vessels, true negative (TN): number of background pixels correctly detected as non blood vessels, false positive (FP): number of background pixels wrongly detected as blood vessels and false negative (FN): number of vessel pixels wrongly identified as blood vessels. From these the metrics are defined as:
TPR =
FPR =
PPV = Accuracy =
The performance is computed for the pixels in the FOV and average of all the measures is computed and the results are shown in Table1
Table 1: Segmentation Results
TPR FPR PPV Accuracy
0.7420 0.0209 0.9364 0.9488
6. CONCLUSION
This paper presents a robust and efficient method for detecting blood vessels in retinal images. From [7] the accuracy is 0.9442 and the proposed method provides an accuracy of 0.9488. Our proposed algorithm took less than 20s to process each image in the DRIVE database with a dual core 2GHz and 4GB RAM processor providing a better accuracy. Hence our algorithm is fast compared to neural network approach which consumes around one and half minutes [24] and more suitable for quick vessel detection. Although with comparable accuracy and TPR still these can be improved with better thresholding methods with the detection of fine blood vessels and also to detect blood vessels in pathological images.
REFERENCES:
[1] J. KansKy, Clinical Opthalmology, Butterworh- Heinmann , London, 1994. [2] X. Goa, A. Bharath, A. Stanton, A. Hughes, N.
Chapman, and S. Thom, “A method of vessel tracking for vessel diameter
measurement on retinal images,” in Proc.
ICIP, 2001, pp. 881–884.
[3] M. E. Martinez-Perez, A. D. Hughes, A. V. Stanton, S. A. Thom, N.Chapman, A. A. Bharath, and K. H. Parker, “Retinal vascular
tree morphology: A semiautomatic
quantification,” IEEE Trans. Biomed. Eng.,
vol. 49, no. 8, pp. 912–917, Aug. 2002. [4] J. Lowell, A. Hunter, D. Steel, A. Basu, R.
Ryder, and R. L. Kennedy, “Measurement of retinal vessel widths from fundus images
238
Imag., vol. 23, no. 10, pp.1196–1204, Oct.
2004.
[5] T. Teng, M. Lefley and D. Claremont, “Progress towards automated diabetic ocular screening: A review of image analysis and intelligent systems for diabetic retinopathy,” Med. Biol. Eng. Comp., vol. 40, pp. 2-13, 2002.
[6] M. E. Martnez-Prez, A. D. Hughes, S. A. Thom, A. A. Bharath and K. H. Parker, “Retinal Blood Vessel Segmentation by Means of Scale-Space Analysis and Region Growing”, Medical Image Computing and Computer-Assisted Intervention MICCAI99, pp. 90-97, 1999.
[7] J. Staal, M. D. Abramoff, M. Niemeijer, M. A. Viergever, and B. van Ginneken, “Ridge-based vessel segmentation in color images of the retina,” IEEE Trans. Med. Imag., vol. 23, no. 4, pp. 501–509, Apr. 2004.
[8] O. Chutatape, L. Zheng, and S. Krishman, “Retinal blood vessel detection and tracking by matched Gaussian and Kalman filters,” in Proc. IEEE Int. Conf. Eng. Biol. Soc., 1998, vol. 20, pp. 3144–3149.
[9] Y. A. Tolias and S. M. Panas, “A fuzzy vessel tracking algorithm for retinal images based on fuzzy clustering,” IEEE Trans. Med. Imag., vol. 17, no. 2, pp. 263–273, Apr. 1998.
[10] A. Can, H. Shen, J. N. Turner, H. L. Tanenbaum, and B. Roysam, “Rapid automated tracing and feature extraction from retinal fundus images using direct exploratory algorithms,” IEEE Trans. Inform. Technol. Biomed., vol. 3, no. 2, pp. 125–138, Jun. 1999.
[11] S. Chaudhuri, S. Chateterjee, N. Katz, M. Nelson, and M. Goldbaum, “Detection of blood vessels in retinal images using two-dimensional matched filters,” IEEE Trans. Med. Imag., vol. 8, no. 3, pp. 263–269, Sep. 1989.
[12] A. Hoover, V. Kouznetsova, and M. Goldbaum, “Locating blood vessels in retinal images by piecewise threshold probing of a matched filter response,” IEEE Trans. Med. Imag., vol. 19, no. 3, pp. 203– 210, Mar.2000.
[13] F. Zana and J.C. Klein, “Segmentation of vessel-like patterns using mathematical morphology and curvature evaluation,” IEEE Trans. Med. Imag., vol. 11, no. 7, pp. 1111–1119, Jul. 2001.
[14] A. M. Mendonça and A. Campilho, “Segmentation of retinal blood vessels by combining the detection of centerlines and morphological reconstruction,” IEEE Trans. Med. Imag., vol. 25, no. 9, pp. 1200–1213, Sep. 2006.
[15]T. Walter and J.-C. Klein, “Segmentation of color fundus images of the human retina: Detection of the optic disc and the vascular tree using morphological techniques,” in
Lecture Notes Computer Science. Berlin:
Springer–Verlag, 2001, vol. 2199, pp. 282– 287.
[16] T. McInerney and D. Terzopoulos, “T-snakes: Topology adaptive snakes,” Med. Imag. Anal., vol. 4, pp. 73–91, 2000. [17] L. Espona, M. J.Carreira, M.Ortega, and M.
G. Penedo, “A snake for retinal vessel segmentation,” Pattern Recognition and Image Analysis, vol. 4478, Lecture Notes Comput. Sci., pp. 178–185, 2007.
[18] M. E. Martinez-Perez, A. D. Hughes, S. A. Thom, A. A. Bharath, and K. H. Parker, “Segmentation of blood vessels from red-free and fluorescein retinal images,” Med. Imag. Anal., vol. 11, pp. 47–61, 2007. [19] B. S. Y. Lam and H. Yan, “A novel vessel
segmentation algorithm for pathological retina images based on the divergence of vector fields,” IEEE Trans. Med. Imag., vol. 27, no. 2, pp. 237–246, Feb. 2008.
[20] G. G. Gardner, D. Keating, T. H.Williamson, and A. T. Elliott, “Automatic detection of diabetic retinopathy using an artificial neural network: A screening tool,” Br. J. Ophthalmol., vol. 80, pp. 940–944, 1996. [21] C. Sinthanayothin, J. F. Boyce, H. L. Cook,
and T. H. Williamson “Automated localisation of the optic disc, fovea and retinal blood vessels from digital colour fundus images,” Br. J. Ophtalmol., vol. 83, pp. 902–910, 1999.
[22] M. Niemeijer, J. Staal, B. v. Ginneken, M. Loog, and M. D. Abramoff, J. Fitzpatrick and M. Sonka, Eds., “Comparative study of retinal vessel segmentation methods on a new publicly available database,” in SPIE Med. Imag., 2004, vol. 5370, pp. 648–656. [23] Bhuiyan A., Nath B., Chua J. and Kotagiri
239 [24] Diego Marín, Arturo Aquino, Manuel Emilio
Gegúndez-Arias, and José Manuel Bravo,” A New Supervised Method For Blood Vessel Segmentation In Retinal Images By Using Gray-Level And Moment Invariants-Based Features,” IEEE Transactions On
Medical Imaging,Vol.30,No.1,Pp
146-158,Jan2011.
[25] W. K. Pratt, Digital Image Processing, 3rd
ed. New York: Wiley, 2001.
[26] N. R. Pal and S. K. Pal, .Entropic thresholding,. Signal processing, vol. 16, pp. 97.108, 1989.
[27] Chanwimaluang, T.Guoliang Fan,” An Efficient Blood Vessel Detection Algorithm For Retinal Images Using Local Entropy Thresholding”, Proceedings of the 2003
International Symposium on Circuits and