ANALYSISING OF DNA MICROARRAY DATA USING
PRINCIPLE COMPONENT ANALYSIS (PCA)
BAYAN M. SABBAR1, MENA R. SULYMAN2
Information & Communication Engineering1, Information & Communication Engineering2
College of Information Engineering, Al-Nahrain University Baghdad, Iraq
E-mail: [email protected], [email protected]
ABSTRACT
In DNA analysis, Microarray technology is a new tool that can automate the diagnostic task and improve the accuracy of the traditional diagnostic techniques. With microarrays, it is possible to examine the expression of thousands of genes in the same time. In this paper is used the Principle Component Analysis (PCA) to extract the feature using BAC (Bayan –Anas Criteria) algorithm that reduce the high dimensionality of data without losing the important information that needed to identify Human DNA feature And to Diagnosis specific disease.
Keywords : Principle Component Analysis, DNA ,Diagnosis disease , Microarrays , Feature extraction.
1. INTRODUCTION
The Microarrays are an exhilarating technology that has now become a widely used research tool within the biological sciences. They offer a great means to collect record amounts of gene expression data during a single experiment with low cost and time process, However, they also challenge biologists, statisticians, and computer programs to develop suitable techniques and methods to resolve difficulties of the Human DNA code [1]
Microarrays are one of the latest breakthroughs in experimental molecular biology that allow monitoring of gene expression of tens of thousands of genes in parallel[2]
The DNA microarray is a high-throughput multiplex technology used in molecular biology. It consists of a series array very huge microscopic spots of DNA call DNA features, of which the
result should be analyzed by computational algorithms[2]
Many methods for analysis microarray used, the principle component analysis(PCA) is one of them. Principal component analysis (PCA) is a mathematical algorithm that reduces the high dimensionality of the data while retaining most of the variation in the data set, each sample can be represented by relatively few numbers instead of by values for thousands of variables[3]by generate covariance matrix and find eigenvalue and eigenvector.
2. THE DNA SEQUENSING PROSESS
Deoxyribonucleic acid, or DNA, carries the information necessary for the development, maintenance, and reproduction of all organisms, from bacteria to humans, Chemically, DNA is composed of only four molecules called nucleotides.
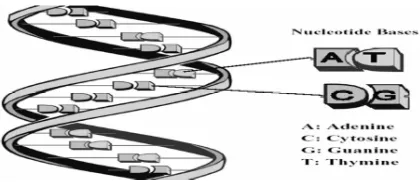
These nucleotides form in two long polymers, with backbones made of sugars and phosphate groups joined by ester bonds in what is now famously known as the double helix shown in Figure (1)
It is the sequence of these four bases along the backbone that encodes information. These 4 bases are adenine, guanine, cytosine and thymine, commonly abbreviated to A, G, C and T respectively.
[image:2.595.79.289.357.454.2]
Figure 1: A schematic of the DNA double helix
As is shown in Figure (1) The bases pair up in a complementary manner. Adenine always pairs with thymine while guanine always pairs with cytosine and each such pairing is known as a base pair (bp) .[4]
The human genome is the DNA in an organism, including its genes. Each genome contains all of the information needed to build and maintain that organism , It is some 3.4 billion bp in length.[4]
The genome is broken down into smaller units known as the chromosomes which are found inside the nucleus in most cell types in the human body.[4]
In human have 46 chromosomes, made up of 23 pairs,44 chromosome is body chromosome and 2 is sex chromosome ,female have 1,2,3,…,XX chromosome and male have 1,2,3,…,XY chromosome. Genes are the functional units of the genome. They are sequences of DNA that provide the template for a protein. [4]
3. MICROARRAY TECHNOLOGY
Within the human body, thousands of genes and their products (i.e., RNA and proteins) function in a complicated web and are orchestrated both temporally and spatially. Due to this complexity, the traditional gene-by-gene approach is not powerful enough to define a global view of cellular function. The microarray technology has been designed to measure the activity of gene expression, from the complete genome in a single experiment.[5]
DNA microarray technology is widely used to studying gene expression in cells for example in the diagnosis of diseases including cancer. Therefore, this technology is a very important and widely used method in research and diagnosis.[6]
This is made possible by spotting (placing) thousands of short DNA sequences on a surface . The data produced by this method is highly dimensional. it could mean tens or tens of thousands of dimensions, depending on the circumstances and experiment setup on which this data is produced.[7]
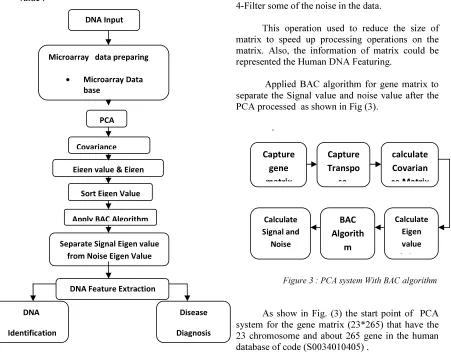
A main issue in microarray studies is how to retrieve valuable information from the enormous amount of generated data. The main processes in the data analysis are extraction of spot signals, filtering, normalization, assessment of differential expression, clustering and classification. In this propose paper, the proposed system in this work is shown in Figure (2).
Each function consists of several operations for example microarray data preparing consist of reading chromosomes data and re-arrange data depend on chromosomes number, then convert data into two dimension array
.
4. MICROARRAY DATA RE-ARRANGING
This high dimensional data is characterized by a very large variable/sample ratio. Typically, they contain a large number (up to tens of thousands) of genes, each expressed as a number. The number of samples, for each of these genes is relatively small (several tens).
The high dimensionality of this data has two main consequences. On the one hand, it makes its analysis challenging. On the other hand, intuitively, it might increase the likelihood that the data will be linearly separable.
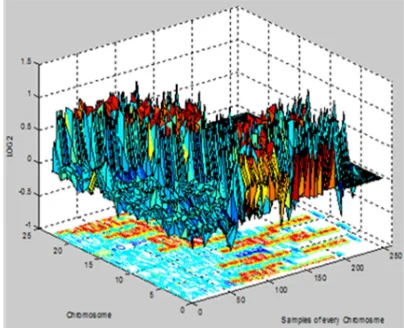
The Data-Base of Human DNA of code (S0034010405)is 2464 log2ratio value. When re-arranging the microarray database it will convert the one dimension matrix (2464) into two dimension matrix called gene matrix (23*256) value .
Figure 2:system Block diagram
5. PRINCIPLE COMPONENT ANALYSIS
(PCA)
A major problem in microarray analysis is the large number of dimensions. In gene expression experiments each gene and each experiment may represent one dimension [2].
PCA is a linear dimensionality reduction method, it work by projecting a number of correlated variables into a (smaller) number of uncorrelated variable called principle component.[5]
There are many application of using PCA for example: [8]
1-Exploratory data analysis.
2-Data preprocessing, dimensionality reduction. 3-Data compression, data reconstruction. 4-Filter some of the noise in the data.
This operation used to reduce the size of matrix to speed up processing operations on the matrix. Also, the information of matrix could be represented the Human DNA Featuring.
Applied BAC algorithm for gene matrix to separate the Signal value and noise value after the PCA processed as shown in Fig (3).
[image:3.595.69.520.363.718.2].
Figure 3 : PCA system With BAC algorithm
As show in Fig. (3) the start point of PCA system for the gene matrix (23*265) that have the 23 chromosome and about 265 gene in the human database of code (S0034010405).
Then we will take the transpose of the gene matrix and multiply it by the gene matrix to
DNA Input
Microarray data preparing
• Microarray Data
base
PCA
Covariance
Eigen value & Eigen
Sort Eigen Value
Apply BAC Algorithm
Separate Signal Eigen value
from Noise Eigen Value
DNA Feature Extraction
DNA
Identification
Disease
Diagnosis
Capture gene
matrix
Capture Transpo
se
calculate Covarian
ce Matrix
Calculate Eigen value
&Eigen BAC
Algorith
m Calculate
Signal and
generate the covariance matrix. as shown in equation (1)
Covariance Matrix = gene matrix * transpose gen matrix (1)
The covariance matrix of size (23*23) is square matrix with dimensions equal to number of chromosomes.
After finding Covariance Matrix, the next step is calculating Eigenvalues then used BAC algorithm to separate data eigenvector from noise eigenvector.
6. BAYAN-ANAS CRETERIA (BAC)
This algorithm used to separate the signal eigenvector from noise eigenvector that help to extract Human DNA featuring and then save it as a new database. This criterion is modified from Akaike Modified Criterion (AMC) that is back to Bayan M. Sabbar.[9]
The BAC algorithm has some steps to find final result (human separation) and these steps as :[10]
1-Sort Eigenvalues in descending order.
2-Calculate Maximum Likelihood (ML) by using Equation (2)
ML ∏
∑
(2)[9]
3-Apply BAC Equation, it represented by Equation (3)
BAC lnML .
(3)
Where: N = number of Eigenvalues m=0, 1,2,3 ...N-1
4-Find the minimum value and location point from BAC curve.
5- Separate Signal Eigenvectors from Noise Eigenvectors, which depend on the minimum point of BAC curve.
6- Multiply Signal Eigenvectors by two dimension gene matrix.[10]
7.
HUMMAN DNA FEATURE EXTRACTIONThe two dimensional gene Log2ratio values of size (23*256) has been reduced to two
dimensional eigenvector (23*m) ( m calculated from BAC algorithm) profiles to a first m principal component PC1, PC2, PC3, .. PCm). this result helped to reduce the size of storage data.
In this work, m eigenvector has been selected to extracted Human DNA featuring and to bulid new database table as shown in Table (1).
8.
DNA IDENTIFICATIONEach chromosome has it's own weight different from other chromosomes , This weights has been visualized each chromosome in the PCA biplot .In this work the new database has been built by calculate 23 chromosome weights.
The chromosomes weight calculate from biplot magnitude and phase of this chromosomes by effect PC1( first principle component) as vas as PC2, PC3..PCm (other principle components).the database table calculate as Equation (4)
Data base table size = (23 * 2*(m-1)) (4)
Where the Magnitude calculate from Equation (5) and Angle caluculate from Equation (6) of principle component m (PCm) compare with
first principle component (PC1) are:
Magnitude m =
ඥሺ
PC12 PC
m 2
ሻ
(5)
Angle =tan1
ቀ
PCmPC1
ቁ
(6)
When using biplot the chromosome will spread on the Four quarters dependent on the weight of them and it's effect of all the DNA . The first quarter have the more active chromosome Than other’s chromosoms .
when chromosome's located in the third quartz it's have negative effect and it will causes the specific disease. As shown in Fig. (8), Fig.(9), Fig.(10) and Fig.(11).
9.
DISEASE DIAGNOSISFrom new data base table magnitudes and angles give the change of chromosome genes according to principle components magnitude and angles.
That has been searched for chromosome that have change in angles ( between 180 to 270 degree) that call Negative Effect Angle (NEA) in the biplot graphs of PCs x axis (from PC1 to PCm ) vas PCs
y axis (from PC1 to PCm ), because that angles implement the disease diagnosis(both PCx axis and
PCy axis have negative direction in specific
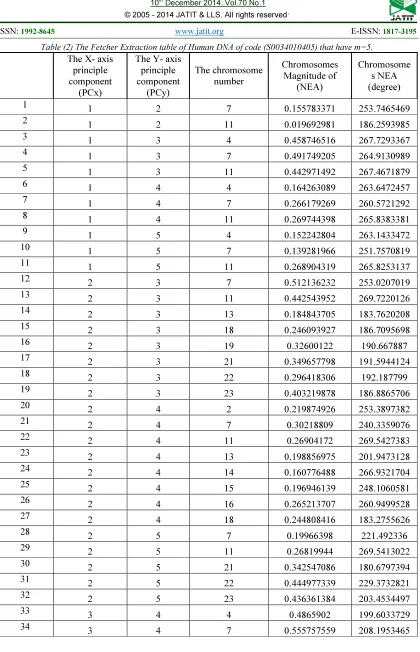
chromosome number). In this works the DNA fetcher extraction for disease diagnostics arrangement in new table call Fetcher Extraction table as shown in table (2) .
The fetcher extraction be :
1. Number of principle component (m)
.
2. The number of PC in x axis and in y axis. 3. The number of NEA in the data base tables.
4. The magnitude of principle components that have NEA.
5. The chromosome that have NEA in specific biplot.
Then dependent on the number of m that result from separate the signal eigenvector from noise eigenvector by BAC algorithm can choose more chromosome repeat that position on the third quarter in biplot than other rest chromosome repeated in the same quarter. This chromosome will causes the specific disease.
As shown in table (2) the chromosome number 7 and chromosome 11 have 10 repeat, chromosome number 4 has 6 repeat in the third quarter (have negative effect). While chromosome number 13, 18, 21, 22 and 23 have three repeat , And the other rest chromosome have only one repeat in the same quarter. In this human DNA database of code (S0034010405) the m is equal 5 that mean the chromosome 7 , 11, 4 will choose it , And remain two chromosome will choice it from chromosome 13, 18, 21, 22 and 23 And because those chromosome have the same number of repeated in this case Which chromosome has highest magnitude will choice it. The magnitude of chromosome 13, 18, 21, 22 and 23 is 0.198857, 0.246094, 0.349658, 0.444977 and 0.436361 respectively, that mean the other two chromosome number is 22 and 23.
The chromosome number 7 , 11, 4, 22, 23 have negative effect and Probably cause of a specific disease.
10.RESULT
In this section we will take the Human DNA of code (S0034010405) as the example to procseed it and when applied PCA and BAC algorithem obtained m (number of cutoff) is equal 5.
Figure 4: Microarray data classified depend on chromosome number, every subplot have Log2ratio samples value vas Gene position
[image:5.595.306.508.454.618.2]Figure 6 : PCA Eigenvalues, Sort in deseeding order eigenvalue
Figure 7: BAC algorithm (m=5)
Figure 8: biplot PC1 vas PC2
[image:6.595.72.522.73.710.2]Figure 9: biplot PC1 vas PC5
Figure 10: biplot PC2 vas PC4
[image:6.595.83.514.76.316.2]
Table 1: The Data-Base table of Human DNA of code (S0034010405) that have m=5. The table total size = (23*2*(5-1)) = 184 values
Chromos omes
PC1 Vas PC2 PC1 Vas PC3 PC1 Vas PC4 PC1 Vas PC5
Magnitu de
Phase (degree)
Magnitu de
Phase (degree)
Magnitu de
Phase (degree)
Magnitu de
Phase (degree)
Chro-1 0.36 43.51 0.371 45.34 0.338 39.4 0.405 49.95
Chro-2 0.272 283.4 0.265 273.5 0.338 308.5 0.371 44.56
Chro-3 0.292 19.36 0.282 282.4 0.284 283.8 0.36 310.2
Chro-4 0.043 154.9 0.459 177.7 0.164 263.6 0.152 263.1
Chro-5 0.316 53.08 0.192 9.529 0.324 54.14 0.202 289.8
Chro-6 0.297 29.07 0.268 284.7 0.301 300.6 0.309 302.9
Chro-7 0.156 253.7 0.492 174.9 0.266 260.6 0.139 251.8
Chro-8 0.123 81.84 0.418 87.62 0.114 81.25 0.19 84.75
Chro-9 0.337 62.65 0.158 11.72 0.293 58.19 0.157 280.5
Chro-10 0.235 75.54 0.268 77.31 0.383 81.17 0.228 75.03
Chro-11 0.02 186.3 0.443 177.5 0.27 265.8 0.269 265.8
Chro-12 0.323 40.13 0.257 285.8 0.249 276.8 0.387 320.3
Chro-13 0.307 306.9 0.246 2.823 0.257 286.8 0.288 31.39
Chro-14 0.272 271.8 0.273 276.4 0.316 300.6 0.283 16.11
Chro-15 0.281 285.2 0.272 273.9 0.327 304 0.339 36.91
Chro-16 0.27 278.9 0.268 276.3 0.374 314.5 0.412 49.72
Chro-17 0.315 35.79 0.263 283.9 0.255 272 0.398 320.1
Chro-18 0.323 319.1 0.214 7.735 0.212 273.8 0.233 24.78
Chro-19 0.351 336 0.155 22.98 0.253 55.78 0.152 20.55
Chro-20 0.294 27.49 0.269 283.8 0.274 287.4 0.335 308.8
Chro-21 0.368 338.5 0.152 27.52 0.293 62.55 0.135 271.7
Chro-22 0.296 348.1 0.087 45.77 0.383 80.86 0.343 349.8
Chro-XX 0.503 322.8 0.308 9.042 0.351 30 0.35 299.8
Table (2) The Fetcher Extraction table of Human DNA of code (S0034010405) that have m=5.
The X- axis principle component
(PCx)
The Y- axis principle component
(PCy)
The chromosome number
Chromosomes Magnitude of
(NEA)
Chromosome s NEA (degree)
1 1 2 7 0.155783371 253.7465469
2 1 2 11 0.019692981 186.2593985
3 1 3 4 0.458746516 267.7293367
4 1 3 7 0.491749205 264.9130989
5 1 3 11 0.442971492 267.4671879
6 1 4 4 0.164263089 263.6472457
7 1 4 7 0.266179269 260.5721292
8 1 4 11 0.269744398 265.8383381
9 1 5 4 0.152242804 263.1433472
10 1 5 7 0.139281966 251.7570819
11 1 5 11 0.268904319 265.8253137
12 2 3 7 0.512136232 253.0207019
13 2 3 11 0.442543952 269.7220126
14 2 3 13 0.184843705 183.7620208
15 2 3 18 0.246093927 186.7095698
16 2 3 19 0.32600122 190.667887
17 2 3 21 0.349657798 191.5944124
18 2 3 22 0.296418306 192.187799
19 2 3 23 0.403219878 186.8865706
20 2 4 2 0.219874926 253.3897382
21 2 4 7 0.30218809 240.3359076
22 2 4 11 0.26904172 269.5427383
23 2 4 13 0.198856975 201.9473128
24 2 4 14 0.160776488 266.9321704
25 2 4 15 0.196946139 248.1060581
26 2 4 16 0.265213707 260.9499528
27 2 4 18 0.244808416 183.2755626
28 2 5 7 0.19966398 221.492336
29 2 5 11 0.26819944 269.5413022
30 2 5 21 0.342547086 180.6797394
31 2 5 22 0.444977339 229.3732821
32 2 5 23 0.436361384 203.4534497
33 3 4 4 0.4865902 199.6033729
[image:8.595.91.511.85.737.2]The X- axis principle component
(PCx)
The Y- axis principle component
(PCy)
The chromosome number
Chromosomes Magnitude of
(NEA)
Chromosome s NEA (degree)
35 3 4 11 0.517899002 211.2967273
36 3 4 13 0.075306578 260.732207
37 3 4 18 0.031974745 205.9424177
38 3 5 4 0.48266503 198.2500921
39 3 5 5 0.075547755 245.0551696
40 3 5 7 0.507360352 195.1130649
41 3 5 9 0.043044761 221.804056
42 3 5 11 0.517461949 211.2170341
43 3 5 21 0.070392459 183.309542
44 3 5 22 0.343472332 259.5023786
45 3 5 23 0.180277548 254.4437075
46 4 5 3 0.241917659 253.8217755
47 4 5 4 0.222484893 222.7959742
48 4 5 6 0.227612175 227.6434491
49 4 5 7 0.294021512 206.7375026
50 4 5 11 0.379875198 224.9101667
51 4 5 12 0.299421925 264.3105754
52 4 5 17 0.305195699 268.2974362
53 4 5 20 0.225568768 248.6888052
11.CONCLUSION
The propose system to analysis the microarray data used PCA method with BAC algorithm have been represented, the microarray data of 2642 log2ratio Gen ratio for 23 chromosomes.
The featuring has been used for DNA identification and dices diagnostic. The main results drawn from this study are:
1. A major problem in microarray analysis is the large number of samples and unordered samples, the PCA method introduces a very good compress data.
2. The BAC algorithm has a very good capability in separating signal eigenvalues from noise eigenvalues.
3. The number of eigenvectors cutting (m) by using BAC algorithm is very efficient to extract the microarray data feature.
4. The Data-Base table is very small data size. It identifies the analysis microarray data from any microarray data by success and easy method.
5. The Fetcher Extraction table has been built by effect of NEA that gives the indication of disease in microarray data and shows the chromosomes cause it.
12. FUTURE WORK
The work in this paper can be extended in the future to address the following issues:
1. To investigate the use of experiment system Neural network to build expert system to identify the disease.
2. Built huge data base data to identify the human microarray data depend on the little storage data size of Data-Base table.
3. Improve the propose system by implementing a hybrid system, it do by using discreet Fourier transform, discreet cosine transform, or discreet wavelet transform at data before analysis by new propose system to remove redundancy of the large microarray data.
REFERENCE
[1] J. Reno, D. Marcus, and J. E. Samuels “The Future of Forensic DNA Testing predication of the Development Working Group” U.S Department of Justice Office of Justice Programs, 2000.
[2] P. Hickey, “X Chromosome Association Testing in Genome-Wide Association Studies”, Ph.D thesis Department of Mathematics and Statistics, The University of Melbourne, 2009.
[3] MarkusRingnér ,"What is principal component analysis? ",March 2008, Volume 26, No 3; pp 303 - 304.
[4] Peter Hickey," X Chromosome Association Testing in Genome-Wide Association Studies", University of Melbourne, November 6, 2009.
[5] Prof. dr. S.W.J. Lamberts," Microarray Bioinformatics and Applications in Oncology,2008.
[6] Peter Bajcsy1, Lei Liu2 and Mark Band," DNA MICROARRAY IMAGE PROCESSING", 1National Center for Supercomputing Applications (NCSA), University of Illinois at Urbana-Champaign (UIUC) 2The W. M. Keck Center for Comparative and Functional Genomics, University of Illinois at Urbana-Champaign (UIUC).
[7] David A. Elizondo, Benjamin N. Passow, Ralph Birkenhead, and Andreas Huemer," Dimensionality Reduction and Microarray
data", Centre for Computational Intelligence, School of Computing, Faculty of Computing Sciences and Engineering, De Montfort University, Leicester,UK,
{elizondo,passow,rab,ahuemer}@dmu.ac.uk.
[8]Rezarta Islamaj Dogan
http://www.cs.umd.edu/~samir/498/PCA.pdf [9] High Resolution Array Signal Processing
by Bayan Mahdi Sabbar 1987.