Smart City Visualization Tool for the Open Data Georeferenced Analysis
Utilizing Machine Learning
Elsa Estrada
1, Rocío Maciel
1, Alberto Ochoa
2, Beatriz Bernabe-Loranca
3,
Diego Oliva
4& Víctor Larios
11
CUCEA, Universidad de Guadalajara, México.
2
Juarez City University, Mexico.
3
Benemérita Universidad Autónoma de Puebla, Mexico.
4
CUCEI, Universidad de Guadalajara, Mexico.
[email protected]
Abstract. In Smart cities it is essential the development of information systems that collaborate in the measurement of the urban surroundings towards the cities’ sustainability. In this research, for the key performance indicators it is proposed a pattern’s visualization of efficiency metrics tool, utilizing the auto learning techniques “machine learning”. The objective is to give support to the decision making throughout the georeferenced analysis exploiting the Open Data. The research was applied to the primary public schools data study case, including four stages: the study of metrics, the search of the data model, the test of territorial dependency, and the development of the tool that applies the grouping techniques or clustering to compare the development and school resources by zone. In the tool, the kmeans algorithm is implemented with label as validation method to select the more relevant centroids to display on a map. Keywords: Smart City tools, Clustering for the georeferenced analysis of the Open Data, Smart City Metrics for the Education Sustainability.
1
INTRODUCTION
Sustainability and fairness are some of the challenges that big cities face due to the constant addition of the vicinity population, implying new ways to supply services, management, and resources such as energy, drinking water, transportation, education and natural environment among others. In this view, the smart cities emerge as a strategy of management of urban performance [1], that is supported by the monitoring of events as an effective way to measure efficiency. For this process, it is recognized the need to analyze a huge amount of parameters involved, therefore, it is referred as a complex model system [2]. Such activity is possible due to the information technologies and communication (TIC’s). This is a key instrument to facilitate the acquisition, processing, and the information’s interpretation [3].
Under this perspective, it has been proposed Smart Cities tools dedicated to the monitoring and analysis of diverse parameters data that assist in the daily operations, for instance, the Smart tracking ones [4], for tracking and detection of events, Smart Citizen [5] for citizens’ participation, and Smart Visualization to support the interpretation of contamination phenomenon, traffic, and consumption of resources [6].
Even though Geographic Information System (GIS), exists for the analysis of territories, these are utilized preferably by expert researchers on some disciplines with advanced knowledge in statistics and georeferenciation, or by authorities with decision power, therefore decreasing the practice of the analysis and monitoring of cities to those that have command in result interpretation and together with the training that imply the management of functionalities of these platforms. As for the access to the data files, the majority are of private use, or have a price tag, for example, commerce topics, business and marketing. Even though the population strategies are of public domain, it is frequently known that data which originated such decisions are unknown, limiting the citizen participation in the continuous monitoring, and governance.
for the exploitation of the Open Data to identify deficiencies in marginalized areas, and in that way, to impact the improvement of the economy, social and environment conditions due to the awareness of the deficiencies.
The tool was programmed in java, javascript, webservice, with a connection to mongodb for the management of collections in json format.
The research was applied to primary school’s indicators in Guadalajara city study case. It was developed in four stages that comprise: the selection of kpi (key performance indicator) Smart City to determine the metrics for the subject of study. The second, the search of the model over OpenData by the exploration of the method of analysis to explain the quality levels and school deficiencies, and the third, the proof of the territorial dependency, in which technics of auto learning are applied particularly group algorithms or clustering with the objective of proving the use of the georeferenced school visualization and its tendency to acquire similar metrics according to the zone or economic division to where they belong and the fourth the development of the tool.
As a result, it is observed that the clustering techniques not supervised are adjusted to the schools' data for the 5 economic zones territorial division, and a tool that implements an algorithm kmeans is developed for the visualization of the groups and centroides,making a validation with tags.
The article is structured as follows: Section 2 shows the Smart Cities as a strategy for the quality of life for the use of the information technologies for the urban efficiency evaluation. Section 3 exhibits the problem and the research question, Section 4 the method. Section 5 shows the results of the design and development of information technology, as well as the findings of the clusters and their impact on Smart City Education metrics.
2 SMART CITIES’ TOOLS FOR THE SMART PEOPLE
The way of operation in the communities in the Smart Cities not only i is defined for the TIC’s, but for the inhabitants that “participate in their citie’s daily governance, are concerned about increasing the quality of life of their fellow-citizens” [7] too. They are Smart People, changing agents that cause not only economic progress but also sociocultural progress when the use of means such as the internet “makes us more informed, we are in turn making better informed decisions”[8].
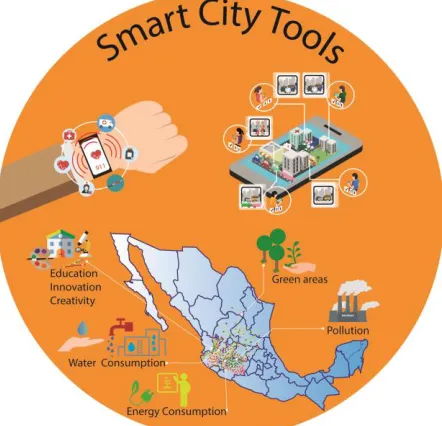
Because of that there have been produced tools dedicated to the single and collective monitoring, that assists in the daily operations that focus in different indicators to simplify the decision making towards the self and collective wellbeing. Figure 1 shows the tools identified in writing as Smart City.
[image:2.612.196.417.482.695.2]Smart Tracking Tools
The type Smart tracking tools are oriented to the detection events’ monitoring, they frequently are integrated by autonomous sensors systems in Smart City Home Environment [9] implementations to detect persons’ events in their home, or the dedicated to the prevention by the general health monitoring [10]. Another form are the applications for the tracing of the activities of the users that generate new events in calendars according to a behavior pattern recognized by the location of a mobile device [11].
Smart Citizens Tools
Citizen Science and crowdsensing are the tools oriented to the citizen’s participation, and its objective is to involve the citizen in the data analysis to promote the sense of collective wellbeing. In the citizen science technologies, the user collaborates in the scientific analysis tied to the culture of environment conservation and sustainability [12]. In crowdsensing applications, a network of smart phones users collects information about a service offering a benefit for the same consumers, the information based on the public transportation services is an example of it [13].
Smart Visualization Tools
This type is oriented to the visual interpretation, and its characteristic is the geographical specification of the monitoring of the equity indicators and sustainability results. As platforms for the monitoring of energy consumption of each building of a community [14], or the ThingFul.net [15] that concentrates indicators coming from the tracking of the Internet of Things of the planet mechanisms, extracting environment, energy, and transportation in real time measurements and displaying them in a satellite georeferenced map. Open government is another platform that tend to collect diverse city kpi’s banks, and in some cases with georeferenciada visualization who provides information to download and free usage and incorporating the Open Data philosophy.
3 THE PROBLEM AND RESEARCH QUESTION
Even though the majority of Visualization Smart Cities’ tools give us an outlook of what happens in places, the tendencies of marginalization, the differences or the divisions between territories are not obvious. Even though the Open Data is a way to evaluate the cities, it hasn’t been exploited to its best, because we observe the absence of the assiduous practice of the extraction of indicators for its processing, and the file download sites are frequently unknown, or the data is fragmented in topics tha t prevent the knowledge to know if the variables/indicators have been extracted in its whole, preventing the abilities of a global interpretation.
The resources demand problem has been the world focus of attention, some of the projects have been casted with the objective of securing the sustainability trough the cities’ evaluation. This labor is complex and requires hard work because it demands a large number of indicator sets, given the countless variables that must be observed. That is how models and reference standards used as tools for the decision making turn up, for example, the ecological foot print, or the human development index (HDI), or the own Smart Cities indexes. The ecological footprint is the planet biocapacity indicator to provide the resources to the population, measuring the required hectares per person to produce the goods that are consumed, and it is combined with the HDI to provide measurements of the same conditions for a “globally sustainable human development” [16]. The Smart City indexes go beyond these indicators, covering other aspects as well like the citizen's participation. But so far, the ecological footprints as well as the indexes are analyzed by tools as geographic information systems (SGI).
In this type of frame research projects as much for science as for the government are frequently consolidated, whereby it is important to count with multidisciplinary groups that are experts in cartography themes, data bases, scientific analysis, and administration that comprehend the results to transcend them to the implementation of policies and public guidelines.
In a SIG, the result is visualized on a map that integrated various aspects or layers (infrastructure, services, enterprises, education, for example), observing the population nucleus, that spectral difference analyses conduct the user to make inferences of the observed image. But such visualization turns unclear when the number of variables is increased; a phenomenon that according to the Smart Cities must be tackled by the TI gave the tendency to the global monitoring that intensifies with the release of the Internet of Things (IoT). Another characteristic of these tools is that it is possible to show the level of development accomplished by some variable over the territories, because allows associating ranges to mature levels with the implementation of the calculus of the distance with respect to the mean, or with respect to the standard deviation, and what’s more, these are capable of recognizing the geoespatial differences due to the great colour management offered. But involves that the user has previous knowledge to make sure the data belongs to a normal population, and that has and know the variable that determines the maturity level of an urban cluster. Therefore, the population is restricted with the opportunity to build their own strategies; the benefit of the practice of the use of the SIG is received by a small sector of society.
In the ICT2015 conference, the benefit of the accessibility of the grate data explosion was explored when they were made public, “the increasingly open access to research and public data” [19], this fact has motivated governments to promote its use to increase development.
The National Mexican Digital Strategy [20] postulate in the 2013-2018 plan actions to the Governmental Transformation, the Digital Economy, the Quality Education, and the Citizen Security, but it is considered that Information Technologies (TI) is the driving force towards an Information and Knowledge Mexican Society.
Therefore, visualization georeferenced trend tools that are at the reach of the commun citizen are foremost immediate needed, that exploit the Open Data resources supporting a great amount of indicators with algorithms that adjust to the treatment of any type of population data sample.
The research question is; how to develop a Smart City Visualization tool with georeferenciated analysis that exploits the Open Data of any kpi? Other derived questions are what is the entry data format? How to deal with a large volume of indicators? And because it is expected to find dependencies of territorial zones’ data, what is the grouping method to be implemented to compare and to identify tendencies among zones?
4 METHOD
The research method includes three stages (see figure 2), the first, the selection of kpi of the Smart City, for which, we study the different metrica’s models, and a single factor or kpi is selected to configure the model. According to the revised bibliography in eight are the factors that are included in the smart cities framework: management and organization, technology, governance, policy, people and communities, the economy, built infrastructure, and the natural environment.
[21].
In the second stage, an Exploration of the data Model is performed. To do this a preliminary Data Mining that encompasses the JOIN activities to unite the tables and files that are scattered is performed FILTERING and CLEANING. After that analysis tests are performed to find out the function that describes the relationship between the data variables, during this stage, posgresql and mathlab was used.
In the third stage, In the Territorial dependency test for the trends’ observations, a plan of tests was created on which learning cluster techniques that are autonomous for a different number of zones, variables, and schools.
Fig. 2Research method in four stages
It means that it must have a header with names of the attributes and variables to evaluate. The attributes with fixed names are Code (primary desirable key), latitude, longitude and zone. The indicators that are the variables may have arbitrary names. There may be an unlimited amount of variables whose names must be unique to identify with accuracy the causes of the differences among territorial zones. And a set of 5 to n number of data or records associated to the attributes and variables. Since the public sources sum of the data is subject to increase by the capture frequency, MongoDB is chosen to process the json documents.
4 RESULTS
Stage 1: Education the basis for the development of people and communities
Searching for the parameters and for more important efficient metrics, the starting point was the eight factors of the Smart Cities framework, and “People and communities” is found among them and according to the study it is encompassed in five components: digital divide, Information and community gatekeepers, participation and partnership, communication, education, quality of life and accessibility.
The “World education Forum 2015” [22], emphasize education as the heart of the factors to reach in 2030 sustainable development.
When comparing these studies in the Human Development Index (HDI), introduced by the Human Development Reports of the United Nations Development Program, one of the three dimensions employed to evaluate the human development is the knowledge that is equivalent to the education factor, is measured by mean??? years of schooling and expected years of schooling, the other two are healthy life, and to achieve a decent standard of living and though, this work is still expanding towards the impact on the improvement of the well-being and to guarantee an equitable and sustainable planet [16].
[image:5.612.155.463.80.317.2]indicators of Percentage of students completing secondary education: survival rate and Number of higher education degrees per 100 000 population, kpis adopted from ISO37120 standard [24]. Consequently, the elected kpi is Education.
Secondary education typically takes place after six years of primary education, therefore, it is essential to first locate the schools in which the research is desired. We know that that the secondary education depends on the efficiency of the primary education, for this reason, the chosen subject of study is: “the evaluation of primary education schools”, in Guadalajara, Mexico.
Their model of indicators are subjected to the ones given by the Open data (see Table 1) and those are, Academic Achievement in Schools (ENLACE) [25], PLANEA [26] for Mathematics, Languages and Communication, spanish, civic training and welfare, Coverage: demographic and gender equity indicators, Infrastructure: premises and service conditions, number of spaces and learning equipment.
Stage 2: Data model exploration
The objective of this stage is to confirm dependency of each academic accomplishment variable on the variables that integrate the coverage and the infrastructure (independents) and to find the functions of the model that represents it.
[image:6.612.48.221.254.390.2]Before starting the search for the data model, it was necessary to carry on the activities of filtering and cleaning which took us to discriminate schools that had invalid data or because of the absence of it, decreasing the number (or amount) of schools. Because the source of origin was from different files, when performing the join, the amount of data was reduced 628 schools. Table 2 shows the anticipated tests results of the 628 school data for the search of the behavior of the data model.
TABLE 1
Primary Education Metricas Model retrieved from Opendata
KPI
NUMBER OF VARIABL ES
NUMBER OF SCHOOLS (DATA)
Coverage 7 699
Accomplishment 48
12
691 E
661 P
Infrastructure 113 674
Total of variables found by type of education kpi referring to public, private and federal primary
schools. E= Enlace test
In this table, we observed that there is no dependency of Achievement over Coverage and Infrastructure when using the tree decision tests because it is not possible to explain the 76% of data dependency. The PCA test is successful when the components that describe the 86% of the variability of the Coverage and Infrastructure variables is identified, but when the multiple lineal regression of its components with each of Logro (dependent variables) variables is applied, the R2 is found between 0.038 and 0.222, and is very far from I. Therefore it is concluded that there is no linear relationship for the tested case.
Stage 3: Territorial Dependency Test
In this stage, different tests are carried out using machine learning. The clustering technique is chosen because this is data not supervised because the official classification of each school in each achievement level is unknown. Since it is not accurate classify a school in an EXCELLENT, GOOD, AVERAGE OR LOW because according to the previous tests, a Coverage and Infrastructure dependency function with respect to the Logro variables doesn’t exist, therefore what is expected to find is a profile or prototype of school for each geographical zone (administrative division) in Guadalajara through which weaknesses and strengths inferences to give support to the decision making ways in each zone.
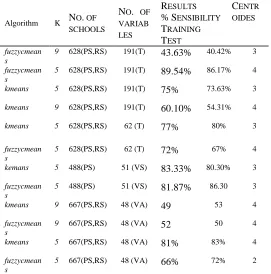
In Guadalajara, there are different kinds of administrative divisions; the most common are 5 and 9. From there it was defined a plan of tests where the kmeans and fuzzycmeans for k=5 and k=9 were executed, involving public and private schools, different kpi’s and for each case the 70% of random schools were assigned to the training group and the 30% for tests, see table 3.
The number of centroids that obtained the most sensibility of grouping were extracted and were calculated by the labeling process consisting in testing the centroids in the training and test group and in accounting by the times these locate the data in the expected territorial zone.
[image:7.612.49.254.106.287.2]
TABLE 2
Analysis techniques applied on school data Analysis
Technique OBJECTIVE
RESULT
Decision Trees
Identification
of the
dependent variable
Percentage of variance not explained for each attribute of achievement 76% (average)
Principal Component Analysis (PCA)
Independence of variables for
Reduction to components
86 % (KMO) 2 C
Multiple Linear Regresion
Proof of a linear function model
2 C (IV) and
With this test, it is finally decided to select the kmeans algorithm for its implementation and k=5. The type of data and the csv entry format is established for which it is determined that it must be in conformity with the model shown in figure 3.
It means that it must have a header with names of the attributes and variables to evaluate. The attributes with fixed names are Code (primary desirable key), latitude, longitude and zone. The indicators that are the variables may have arbitrary names. There may be an unlimited amount of variables whose names must be unique to identify with accuracy the causes of the differences among territorial zones. And a set of 5 to n number of data or records associated to the attributes and variables.
[image:8.612.49.320.107.381.2]Since the public sources sum of the data is subject to increase by the capture frequency, MongoDB is chosen to process the json documents.
TABLE 3
Analysis techniques applyied on school data
Algorithm K NO. OF SCHOOLS
NO. OF VARIAB LES
RESULTS %SENSIBILITY TRAINING TEST CENTR OIDES fuzzycmean s
9 628(PS,RS) 191(T) 43.63% 40.42% 3
fuzzycmean s
5 628(PS,RS) 191(T) 89.54% 86.17% 4
kmeans 5 628(PS,RS) 191(T) 75% 73.63% 3
kmeans 9 628(PS,RS) 191(T) 60.10% 54.31% 4
kmeans 5
628(PS,RS) 62 (T) 77% 80% 3
fuzzycmean s
5 628(PS,RS) 62 (T) 72% 67% 4
kemans 5
488(PS) 51 (VS) 83.33% 80.30% 3
fuzzycmean s
5
488(PS) 51 (VS) 81.87% 86.30 3
kmeans 9 667(PS,RS) 48 (VA) 49 53 4
fuzzycmean s
9 667(PS,RS) 48 (VA) 52 50 4
kmeans 5 667(PS,RS) 48 (VA) 81% 83% 4
fuzzycmean s
5 667(PS,RS) 48 (VA) 66% 72% 2
k=number of clusters
Z9 = Zones (Oblatos, Industrial, Centro, Olímpica, Huentitán, Tetlán, Minerva, Tlaquepaque y Zapopan).
Z5= Zones (Minerva_Zapopan, Olimpica_Tetlán_Tlaquepaque, Industrial, Oblatos_Huentitan, Centro), PS=Public Schools (State and Federal Schools),
RS=Private Schools, VC= Variables Coverage, VA=Variables Achievement,
VI= Infrastructure Variable, T= All variables (VC,VA and VI)
VS= Selected variables since boxplot tests (VC,VA and VI)
Stage 4: Development of the Smart People Visualization Tool for Open Data
Design of software components: DataScience TreeModel and Georeferenced View
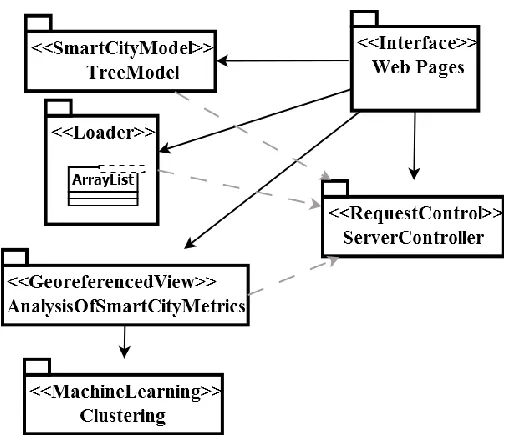
[image:9.612.48.302.249.467.2]The tool is structured mainly by six components programed in java (figure 4), and these are: The package web pages that implement jsp files to navigate over the tool options as well as the connection to MongoDB by means of Request Control package that contains categories for the process of petition-response to the apache tomcat server, to execute json document transference transactions. The package SmartCityModel has the functionality to build the kpis hierarchical tree departing from collections of stored objects by an external system, utilizing TreeBuilder;js de d3.v3min.js. The package Loader designed to request the user the files to upload as well as to to sore, implementing a type ArrayList Template for the conversion to String. Georeferenced View has the task to build the training as well as the proof dataset for the analysis, triggers kmeansL implemented by the package MachineLearning that applies Clustering techniques, calling kmeans labeling to obtain the valid centroids. Returning the data set grouped prepared to later unfold by leaflet.js.
Fig. 4 Diagram of software components
DataScience Implementation: Clustering Algorithm and validation by labeling
The main task of this tool is carried on by the kmeansL type, it applies the scientific analysis to the school documents collection which is the objective of the study. The activities included are divided into two parts, the grouping by kmeans and the validation by labeling.
Fig. 5 Algorithm for the clustering technique for kmeans overOpenData
Validation by labeling is to calculate the percentage of sensibility for both, the training set as well as for the test using the labeling, with the aim to assess the accuracy of the grouping of the centroids obtained by kmeans when identifying the ones with the most number of assignations.
Involve the centroid test activity that consists in the calculation of the the group to which each object of each set in observation (training and test) belong, and then it compares the assigned group with the expected assigned zone, therefore, for a better control, two metrics that store the resulting datasets are designed, and are FullSetTrain and FullSetTest, with the format that is displayed in figure 6.
Fig. 6Format de Layout of matrix content with grouped objects for Training and Test
Where FullSetTrain is n rows quantity that is equivalent to 70% of the population size and FullSetTest to 30%. The columns Varl a VarN are the variables assessed by kmeans; Key (Code), latitude and longitude originate from the downloaded file to associate the data with its georeference. The hypothesis_ZONA_HOPE and ZONE_GroupCalculatekmeans fields are added to be used in the labelling process.
To know the maximum number of times that the same group was assigned, it is declared a structure it is stated a structure as in figure 7. Each row is associated to an expected zone and each column to the calculated zone for each centroid. All the objects of a dataset are processed, and the structure is filled as follows: the assigned group by kmeans of each object is the position of the column that increases by one, in its row that is the zone that this object expected. The last column is reserved to select the centroid that had the majority of assignations. Then the dataset is processed again, and the corresponding label is added according to their particular case.
.
BasicDBObject[] dataSet = getIndicators(CollectionN, variables); BasicDBObject[] coordenatesSet = getIndicators(CollectionN, coordenates);
BasicDBObject[] hypothesisVector = getIndicators(CollectionN, hypothesis);
hypothesisData=toIntegerHypothesisVector (hypothesisVector,hypothesis);
fullSet = new double[dataSet.length][variables.length]; fullSet=toDoubleSetData(dataSet, variables); trainSize= (int) (fullSet.length*70/100);
testSize=fullSet.length-trainSize;
Calculated ZONE kmeans
Schools sum
Label
Hipothesis Hope Zone
1 2 3 4 5 Centroid
with the majority
1 1 3 1 2 9 21 5
2 18 39 13 26 31 129 2
3 7 9 6 8 11 46 5
4 18 26 12 28 26 114 4
[image:11.612.192.425.93.213.2]5 10 11 3 3 21 53 5
Fig. 7 Label matrix for Sensibility estimation obtained from execution for FullSetTrain
In this quadrant, three centroids or predominant groups are observed (2,4 and 5), though 1, 2, 3, 4, and 5 was expected. Since the majority of the schools demonstrate belonging to only three groups. This example is the training group, after processing 342 data, with 51 variables, equivalent to 70% of 488 public schools.
For the sensibility calculation, the successes are taken, in other words when the label coincides with the hypothesis. They are added, and the total is divided between the populations. For this case, the successes are: 284=(9+129+11+114+21) and Sensibility 83.04% = (284/342*100).
The centroids that obtained larger successes numbers or are the most descriptive, 2, 4, and 5 are assigned a random color to prepare the visualization on the map.
Implementación TreeModel: sources management and kpi data loadder
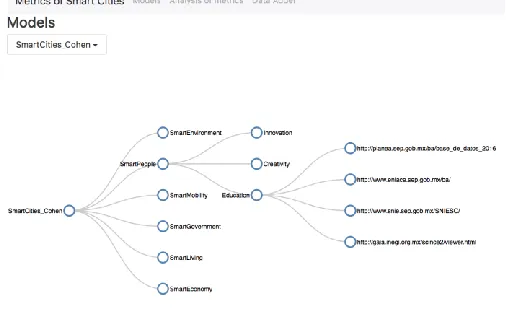
The tool is integrated mainly with two systems, a local and a client server system. The local one was developed for better control of kpis and its sources. Additionally with the future vision to involve autonomous searches of Smart Cities indicators in the web. The client server system gives the user the basic function options for the urban analysis and is comprised by the Visualizer models, the Data Adder and the metrics Analysis.
Because the urban indicators are found disseminated on the internet, it is necessary to maintain them in control to track their sources with sites to which the SmartCity factors are associated. As a result, a program that performs the addition of factors organized in layers was developed, with the hierarchic or nested structure to express grouping level.
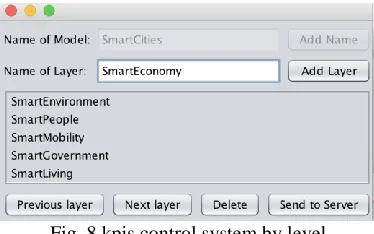
In figure 8, shows the addition of five kpis. The option Send to Server allows the submission of data to the Server. The button Next Layer, allows selecting the kpi to navigate to add a set of nested kpis.
Fig. 8 kpis control system by level
[image:11.612.212.399.536.653.2]hierarchic tree. It has the capacity to extend or shrink on any kpi branch according to the user preferences. En su rama más profunda fueron anexados cuatro direcciones de fuentes de datos de internet para Education
Fig. 9 kpis hierarchic tree with a registry of feeding source for the kpi Smart People, Education branch.
Data Adder allows to attach the csv file via the file browser opening and affix the data to Collections in MongoDB. Figure 10 shows the file download interface.
Fig. 10 Interface for csv file download
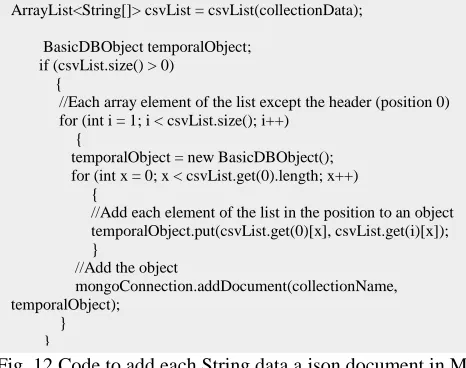
To attach the data, two code blocks were generated, the first is the splitString function that is shown on figure 11, which applies the regex to obtain regular expressions of flow of characters of the entry file and to return a list of tokenized arrangements. The second block as seen in figure 12, implements a cycle to attach each element to the list that has been tokenized to the collection previously created.
private static ArrayList<String[]> csvList(String dataString) {
//The list to add all the data
ArrayList<String[]> temporalData = new ArrayList<>(); //Iterate each string
for (String temporalString :
dataString.split(System.lineSeparator())) {
//Add each data
temporalData.add(splitString(temporalString, ",(?=([^\"]*\"[^\"]*\")*(?![^\"]*\"))"));
}
return temporalData; }
private static String[] splitString(String splitData, String regexString)
{
[image:12.612.104.319.538.728.2]Fig. 12 Code to add each String data a json document in MongoDB
Implementation Georeferenced view
In Analysis of metrics tab, the user can choose the desired collection to analyze. It has two perspectives, the centroids and the map, see figure 13.
Centroids perspective
The prototypes that obtained the majority (the most) of labeling (flagging) are visualized with the purpose to expose differences by the specification of indictors that characterizes each group because of the centroid, Favoring in this manner, a decision making based in metrics.
For the best phenomenon interpretation, it is chosen to enumerate the centroids and subtitle them as “Type”. The names and values of the indicators that confirm them are listed as well.
Map Perspective
The objective is to highlight the limits and scopes of the territories that surround each group and to know the schools that are identified with a given type.
ArrayList<String[]> csvList = csvList(collectionData);
BasicDBObject temporalObject; if (csvList.size() > 0)
{
//Each array element of the list except the header (position 0) for (int i = 1; i < csvList.size(); i++)
{
temporalObject = new BasicDBObject(); for (int x = 0; x < csvList.get(0).length; x++) {
//Add each element of the list in the position to an object temporalObject.put(csvList.get(0)[x], csvList.get(i)[x]); }
//Add the object
mongoConnection.addDocument(collectionName, temporalObject);
Fig. 13 Results’ visualization of the Smart City tool execution, the nearest school to each centroid of each Type is in purple, the tooltip shows the key and domicile if it is prototype, the territorial group to which it belongs and its latitude and longitude
coordinates.
Findings for the development of Smart Cities
As the objective of this study is the primary schools and having obtained the result of the analysis we can observe in the Type 1 execution that the blue color was assigned to schools located in Tlaquepaque, Olimpica, and Tetlan, in Type 2 yellow was assigned to Oblatos and Huentitan, and Type 3 green to La Zona Industrial, Downtown and Zapopan.
In type 2, there is a higher percentage of students achieving excellent achievement in Spanish and Mathematics from 2013 to 6th grade (8.01% and 18.3%), excellent in Mathematics and Civics and ethics from 2013 to 5th grade (18.25% and 3.5%), excellent in Spanish 4th grade (13.35%), Civic and ethical education 3rd grade (9.52%), in 2015 maintains the highest percentage of excellent students in Mathematics for the 6th grade, as well as in language and communication and well-being (associated family resources). In Information Technologies, more computers are in operation with access to the Internet and for educational use and are 9 on average per school. In Coverage you get more students enrolled, more teachers and more groups. An important finding is that this type has an average of 31.76 students per group, unlike type 1 and 3 with 26 and 19 students. This leads us to maintain that the difference in educational achievement is made by Information Technologies.
educational achievement and the successful completion of secondary education, so it is important to promote and increase to achieve a better level of development.
Another important issue is the contribution of Information; the visualization of the volume of each type of schools can be considered an alert on education tendencies that must be taking care of in order to maintain or to change the course.
[image:15.612.182.432.219.413.2]The relevance of this investigation for a Smart City is the design of public policies linked with a planning horizon and considering future indicators from Inegi, as a population spike in 2037 for Guadalajara City, consequently when georeferencing, not only the population and the population growth, the index of human development can be combined and determine the increase in schools with different education level, in accordance with the expected population growth, as it can visualized on figure 14, in the future, a narrative script work it will be pursued, associated with a future setting of a smart city segment. .
Fig. 14 Population growth in Guadalajara’s ZM and the comparison with the kind of inhabitant, together with the Human Development Index to determinate the correct public policies in the area of educational coverage in the future of the Smart City.
5 CONCLUSIONS
In the development of this type of tool it as well as for the use of it, is necessary to fulfill certain requirements of the data entry. The file must be maintained characteristics such as cleaning, format of variables type, and structure among others. This implies hard work that can be decreased by the open data sites when data bases are published without typos, omitted or inconsistencies that maintain a standardized structure to exploit and link several files.
Another important aspect to point out are the machine learning techniques applied to Open Dara, mainly the ones with grouping since they explain better the qualitative divisions among territories, therefore, the kmeans is recommended as well asfuzzycmeans for the development of decision making tools. However, this is only possible using Mongo DB, Data Base handler that has a capacity to store and to manipulate large amounts of data on standard format: “json” since the tendency is the massive monitoring of indicators for the comparison among cities.
The appearance of the Smart Cities tools made available to the citizens and the government convert the society in “Smart People” because are means to accomplish the scientific analysis process in the everyday practice and in the individual and collective awareness process because it involves the use of distribution of resources as well as the results of the efficiency of the services such as Education.
To implement a smart tool for the Decision Making, some aspects must be considerd. It must be a planning horizon that is capable of proposing public policies linked with the significant improvements of the population, in our case, it must be considered a priority area such as the educational coverage which is a UNICEF indicator that states that no child should live more than 10 km away from the school because it would generate a low performance due to travel time that must be done every day and the stress that is considered associated with the travel combined to the high cost to their family from the economic point of view and the time invested in the transportation.
References
[1] A. M. Towsend, Smart Cities, First. New York, pp. 111–114.
[2] A. C. Michalos, Ed., Encyclopedia of Quality of Life and Well-Being Research. Dordrecht: Springer Netherlands, 2014.
[3] F. Bifulco, M. Tregua, C. C. Amitrano, and A. D'Auria, “ICT and sustainability in smart cities management,” International Journal of Public Sector Management, vol. 29, no. 2, pp. 132–147, Mar. 2016.
[4] M. Daher, A. Diab, M. El Badaoui El Najjar, M. Ali Khalil, and F. Charpillet, “Elder Tracking and Fall Detection System Using Smart Tiles,” IEEE Sensors J., vol. 17, no. 2, pp. 469–479, Dec. 2016. [5] M. Pouryazdan and B. Kantarci, “The Smart Citizen Factor in Trustworthy Smart City
Crowdsensing,” IEEE Computer Society, pp. 1–8, Jul. 2016.
[6] I. Jablonski, “Smart Transducer Interface—From Networked On-Site Optimization of Energy Balance in Research-Demonstrative Office Building to Smart City Conception,” IEEE Sensors J., vol. 15, no. 5, pp. 2468–2478, Mar. 2015.
[7] G. Mulhern, “Citizen Science and Smart Cities,” Jun. 2014. [8] Ericsson, “Smart Citizens,” pp. 1–8, Oct. 2014.
[9] I. Al-Naimi and C. B. Wong, “Indoor human detection and tracking using advanced smart floor,” presented at the 2017 8th International Conference on Information and Communication Systems (ICICS), Irbid, Jordan, 2017, pp. 34–39.
[10] V. Vippalapalli and S. Ananthula, “Internet of things (IoT) based smart health care system,” presented at the 2016 International conference on Signal Processing, Communication, Power and Embedded System (SCOPES), Paralakhemundi, India, 2016, pp. 1229–1233.
[11] I. Yoon, G. Ng, Xuejing Dong, Haichuan Duan, A. Aggarwal, R. Shah, and G. Ku, “SuperCaly: Smart life assistance by integrating a calendar app with location tracking, media organization and social connection,” presented at the 2017 IEEE 7th Annual Computing and Communication Workshop and Conference (CCWC), Las Vegas, NV, USA, 2016, pp. 1–7.
[12] N. S. Panchariya, A. J. DeStefano, V. Nimbagal, R. Ragupathy, S. Yavuz, K. G. Herbert, E. Hill, and J. A. Fails, “Current Developments in Big Data and Sustainability Sciences in Mobile Citizen Science Applications,” presented at the 2015 IEEE First International Conference on Big Data Computing Service and Applications (BigDataService), 2015, pp. 202–212.
[13] K. Farkas, G. Feher, A. Benczur, and C. Sidló, “Crowdsending based public transport information service in smart cities,” IEEE Communications Magazine, vol. 53, no. 8, pp. 158–165, Aug. 2015. [14] L. Hui, W. Gui-rong, W. Jian-ping, and D. Peiyong, “Monitoring Platform of Energy Management
System for Smart Community,” presented at the Control And Decision Conference CCDC, th Chines, Chongqing, China, China, 2017, pp. 1–5.
[15] “Thing ful.”
[16] J. Selim, “Human Development Report 2016: Human Development for Everyone,” pp. 1–286, Mar. 2017.