I UNIVERSITY OF TWENTE
Performance of corporate bond indices – an approach inspired by
Merton’s model
Master thesis
Niek van Breukelen
N. van Breukelen
Studentnumber : s0069973
University of Twente
IEM: Financial Engineering and Management
Supervisors Dr. B. Roorda Dr. R.A.M.G. Joosten
Company Supervisors B. Bos B. Heenk
Table of content
Management Summary ... I Preface ... III
1. Introduction ... 1
2. Problem motivation ... 3
3. Aims and contribution of this research ... 6
4. Basic concepts and literature research ... 7
4.1. Characteristics of corporate bonds ... 7
4.2. Credit Risk ... 9
4.3. Credit risk modeling ... 11
4.5. Determining risk measures ... 13
5. Proposed model ... 15
5.1. Modeling of investment grade corporate bonds ... 18
5.2. Modeling of collateralized corporate bonds ... 20
5.3. Modeling of high yield corporate bonds ... 22
6. Description of data ... 25
6.1. Bond indices ... 25
6.2. Interest rates ... 27
6.3. Equity market ... 28
6.4. Implied volatility ... 28
7. In Sample test ... 30
7.1. Testing methodology ... 30
7.2. Proposed model with use of market implied volatilities ... 31
7.3. Proposed model with fixed implied volatility ... 39
8. Out of Sample test ... 46
8.1. Proposed model with actual market implied volatility ... 47
8.2. Proposed model with fixed implied volatility ... 49
9. Conclusions and recommendations ... 51
9.1. In-Sample results ... 51
9.2. Out of Sample results ... 53
9.3. Value-at-Risk ... 54
9.4. Proposed model against current ALM models ... 54
9.5. Recommendations... 55
I
Management Summary
This thesis explores the application of using option pricing methodology in a firm value model in the evaluation of several different corporate bond types. More specifically, the aim of this thesis is to evaluate whether the application of market implied volatilities in a generalization of the Merton model results in a useful risk management tool for financial institutions. The corporate bonds returns have been obtained by modeling the corporate bonds as a nominal risk free corporate bond and equity derivatives. In order to capture the characteristics of the different types of corporate bonds put and call options have been used. The three types of bonds which have been modeled are investment grade, collateralized and high yield corporate bonds.
Currently used models require a lot of factors which are not directly observable in the financial markets and therefore need to be estimated. The proposed model requires none of these factors and still tries to capture the main characteristics of the risk distribution of corporate bonds by extending the Merton model. This extension involves a risk free component, a nominal bond, and a combination of equity derivatives for modeling the three different types of corporate bonds. As these three types of corporate bonds have different characteristics it is required to model each corporate bond with different equity derivatives. We have tested the proposed model to three corporate bond benchmarks for portfolios of institutional investors. The three IBoxx benchmarks are a good representation of the complete spectrum of available bonds. The three types range from risky high yield bonds, investment grade bonds to low risk bonds protected by high quality collateral. An In-Sample test has been performed over the period 2006-2010 in order to evaluate the proposed model used for capturing the risk distribution of the three types of corporate bonds.
III
Preface
This thesis serves as the final assignment for the master Financial Engineering and Management at the Universiteit Twente. After finishing my bachelor Industrial Engineering and Management, I continued studying at the University of Twente but also started working for two days a week at Cardano. This allowed me to see how I could use the knowledge from my studies and get relevant work experience. Although there were a lot of benefits, I also sometimes struggled in the balance study versus work.
Although I am already working at Cardano for a number of years, I am glad to finish my masters and with this my student life. Without the support from my family and girlfriend this would not have been possible. Therefore, I would like to thank my parents, Jeroen and Marga, and my girlfriend Sanne de Wit. I am really grateful for the patience and never ending support you gave me.
Furthermore, I would like to thank my company supervisors and colleagues Bart Bos and Bart Heenk at Cardano for supporting me writing this master thesis. Your feedback was always positive and this greatly helped me in finishing this assignment.
Lastly, I would like to thank Dr. B. Roorda and Dr. R.A.M.G. Joosten for their supervision and the support during my assignment. Completely finishing this thesis took quite a while and I am grateful for the patience and support they gave me.
Niek van Breukelen
1
1. Introduction
In the world of finance many decisions are based upon a tradeoff between risk and return. As quantifying risk is important when deciding in which asset to invest in, econometrical analysis of risk therefore plays a large role. Current markets are under stress which also makes that the focus on risk management becomes stronger than ever. The primary focus of risk management within financial institutions has shifted from the traditional risk management but rather on the occurrence of extreme events, as Duffie and Singleton acknowledged (Duffie & Singleton, 2003).
Financial institutions, like pension funds or insurance companies, are managing large portfolios of assets. Many of these financial institutions have obligations to their stakeholders. In order to meet these obligations financial institutions need to diversify risk by investing in different assets. These portfolios consist of several different asset classes like equity, commodities, hedge funds, fixed income and derivatives. The choice of investing in a particular asset class also affects the expected return and the amount of risk of the portfolio.
For a financial institution the funding ratio or solvency ratio is one of the key financial indicators. The level of the funding ratio of pension funds influences the investment decisions. For example the Dutch regulator imposes in the FTK guidelines a minimum funding ratio of 105% to pension funds (De Nederlandsche Bank, 2007). If the funding ratio drops below this level then the pension funds are obligated to come up with a contingency plan in which they state how they will get a higher funding ratio in the next 5 years. The level of inflation indexing for pensions is often also related to the funding ratio and in insurmountable deficit pension funds have no choice but to cut promised pension.
Some of these financial institutions therefore invest a large part of their portfolio in well-diversified low risk investments. The rationale behind this strategy is that the minimum of the promised obligations is always covered. The most used low risk investments are high rated government bonds, which provide a natural hedge against the interest rate risk on their liabilities. The effect of a change in the level of interest rates on the price of a bond is exactly opposite to that of the price of the liabilities a financial institution is facing.
2 on the expected return. The nominal yield on a government bond is lower than for example a company which has a higher probability of default.
3
2. Problem motivation
The most used alternative for investing in government bonds are corporate bonds, which will generally give a higher return. The higher return is a compensation for the fact that the risk of investing in corporate bonds is higher than that of bonds issued by a government. The financial crisis of the last few years showed that actual default rates of corporates are higher and defaults occur more clustered than predicted the models. As a result investors are measuring and managing risks from credit exposures more frequently and are more interested in the risk on a portfolio level.
The most frequently used approach to indicate the risks of holding an investment like corporate bonds is to measure the volatility of the bond price. A higher volatility makes an investment more risky because large price fluctuations are more likely to occur. Although the volatility of the investment is a convenient measure of risk it does not explain why a certain price has changed or which underlying factors are responsible for this price change. A common approach is to determine and estimate risk factors which will capture the risks that are driving the price change. The weight of the factor indicates the contribution of the factor to the total risk.
As each asset class endures different types and sizes of risk, the mapping of these asset classes to the risk factors is a challenging topic. Each risk factor represents a different kind of risk, e.g. interest rate risk, counterparty default risk. The total risk of the assets is determined by both the volatility of the factor and the weight of the factor in the model. A commonly used measure to analyzing these factors is through Factor Analysis. This method describes the observed types of risk in terms of market factors.
In finance most factor models are using a beta weighted linear combination of market risk factors. These underlying factors which are determining the price are unambiguously mapped to readily observable indices in the market, such as an equity beta to a market index or an interest exposure to swap rates.
But there are bond types for which the mapping to market factors is not straightforward like collateralized debt or high yield debt. For these asset classes mapping to risk factors is complex and tedious. Another data problem which often occurs is that asset managers are not willing to disclose exactly which assets they are holding. Financial institutions invest in a fund managed by an asset manager and get merely an indication of the exposure to some betas.
4 underlying risk factors will change as the underlying factors will change. These second order effects may become larger as the movements are larger. Also specific risks of a portfolio are not captured by these models.
Financial institutions often make use of third party software for their Asset Liability Management (‘ALM’) studies. Based on the outcome of the ALM studies, investment decisions will be made. Some of the models, like CAPM or Factor models, used in these software systems are making use of model assumptions and have limitations with respect to the use of these software systems. These limitations together with the described data problems cause for a need to investigate if there is a better way of looking at certain asset classes in ALM. One of the asset classes which are often confronted with data problem are corporate bonds. In this study the modeling of these corporate bonds for ALM studies is investigated.
The value of corporate bonds depends mainly on three drivers: the rate of return on risk free debt, additional security like collateral pledged and thirdly on the estimated probability of default. The return on riskless debt can found by looking to perceived risk free government bond and calculating its value with the interest curve of that particular moment. The terms agreed upon on the issuance of the corporate debt are available through the prospectus of the issued corporate bond. Estimating the probability of default imposes more difficulty. The exact moment of default and recovery rate of a corporate bond is upfront never known and therefore has to be estimated. Estimation and modeling of the expected probability of default imposes difficulties as it is a low frequency event and therefore the estimation is often based on a small number of observations. Many models like reduced form and firm value models which are made of capturing the behavior of corporate bonds struggle with determining the correct risk premium of a corporate bond due to the fact that the above probability of default is not known and has to be estimated.
5 factors are used to describe an economic environment and therefore it reduces the correlation or covariance matrix.
Within the financial market a lot of different types of corporate bonds exist. The scope of this research will be limited to the following asset classes; investment grade bonds, collateralized bonds and high yield bonds. These three types of corporate bonds are researched as they reflect three different but often used types of corporate bonds used by financial institutions and span the universe of this asset class.
The problem statement of this research is:
Develop a model for capturing the behavior of portfolios of corporate bonds in an Asset-Liability-Management context by making use of a risk free nominal bond and equity derivatives, in particular for high yield, investment grade and collateralized corporate bonds.
The research question is split up in smaller investigative questions to answer the research question. A common way to research the problem statement is dividing the research question in smaller investigative questions (Cooper & Schindler, 2008). This makes sure that all the information is found in order to answer the research question.
In order to develop a model which better captures the behavior of investment grade, collateralized and distressed debt the current methodologies will be researched what the strengths and weaknesses are and which methodologies are commonly used to model corporate bonds and measure the amount of risk. In this thesis we will apply the model to three portfolios represented by the well-known iBoxx benchmarks for the three debt types. An analysis of the most used theoretical models frequently used to model corporate bonds will be commented on its usage and limitations.
These questions resulted in the following investigative questions:
- Does using actual market implied volatility provide a better fit than using a longer term average implied volatility?
- Do the asset classes tested with the model capture the behavior of the corporate bond indices with all levels of equity returns?
6
3. Aims and contribution of this research
The aim of this research is to develop an alternative way of looking at corporate bonds used in Asset Liability Management (ALM) studies. In this study two main objectives are researched. The first objective is to develop a new, more intuitive approach to model corporate bonds by making use of a risk free bond and equity derivatives based on observables market factors and to comment on the usage of existing models in an ALM context in order to compare the outcome of the proposed modeling approach. The proposed model for capturing the behavior corporate bonds is described and compared against the outcomes of actual corporate bond indices used as a benchmark.
The second objective of this study is to establish whether the risk distribution that is derived from modeling the corporate bond returns with the proposed model can be used for risk management purposes. Therefore traditional approaches to map the asset classes into risk factors are examined and compared against the factors and other risk measures. The comparison of the models is made on the basis of the several ways to measure and comment on the risk arising from holding such an asset in a portfolio. The results of the new proposed model are examined on the fit of the total distribution and in tail measures.
7
4. Basic concepts and literature research
In order to develop a model which captures the behavior of corporate bonds the most important characteristics of these corporate bonds had to be identified. Also an overview of the different approaches to model credits and determining of risk factors has to be researched.
Financial risks are the risks investors are facing in the financial markets by investing in products. These risks vary from fluctuations of interest rates, changes in credit rating or unexpected default. Credit risk is one of the most important risks investors are facing. The literature on the area of modeling credit risk can be divided in two main approaches structural models and reduced form models. Research on defining the risk measures of an asset show that a lot of effort has been made to understand which factors are driving the price of an asset.
4.1.Characteristics of corporate bonds
Before going in to more detail which type of data is used it is important to better understand the specifics of the bond types in the three IBoxx benchmarks. Therefore a short description of what a (corporate) bond is and which kinds of bonds are present in the market is given below.
4.1.1. Bonds
Bonds represent by far the most used fixed income instrument as an investment and are also the most liquid of the fixed income securities. A bond is an obligation by the issuer to pay money to the bond holder according to rules specified in the contact when the bond is issued. The bond normally pays out its face or par value at maturity. In addition most bonds pay out a periodic coupon payment. The coupon represents always a percentage of the notional of the bond. For example if a bond has a notional of €10,000, and with a 6% coupon, will pay out €600 as coupon.
4.1.2. Bond ratings
Although bonds will pay out a fixed coupon and face value, they are subject to default if the issuer is unable to meet his financial obligation or goes into bankruptcy. Rating agencies will therefore analyze and rate the issuer of the bond to reflect the probability of default. The two largest rating agencies in the world are Moody’s and S&P1. The system of ratings is designed to allow investors make decisions and compare risk through a simple system of gradation. The assignment of a rating to a bond by one of the rating agencies is made largely on the financial status of the issuer. Next to the financial status, measured by financial ratios, do also other, more subjective variables could play a role. The table below shows the rating classifications of Moody’s and S&P.
8 Rating Moody Rating S&P Definition
Investment Grade
Aaa AAA Highest credit rating
Aa2 AA High grade
A2 A Medium grade
Baa2 BBB low medium grade
Speculative Grade Ba2 BB
non-investment grade speculative
B2 B Highly speculative
Distressed
Caa2 CCC Extremely speculative
C D In default
Table 1. Classification of Moody's and Standard & Poor’s long-term rating
4.1.3. Investment Grade Debt
As shown in the table 1 debt of an issuer of corporate debt could be considered ‘investment grade’ if a credit rating company, like Moody’s or S&P, assigns a rating which is BBB / Baa or higher. The rating reflects the likelihood that an issuer of the bond will be able to meet the payment obligations to the investor. A higher credit rating indicates that a company or government has a lower risk on defaulting within a certain period.
Because investment grade debt is comprised out of the bonds with the highest ratings these bonds are often used for a low risk investment with fixed pay-off. As mentioned before the probability of meeting the financial obligations determines the interest rate spread on top of the risk free rate, therefore the fixed rate of these investment grade bonds will be lower than on speculative of distressed bonds.
4.1.4. Collateralized Debt
9
4.1.5. High yield Debt
High yield debt is debt from which the issuer is already in default or highly likely that it will end up in that situation. Rating agencies often rate this kind of debt as CCC/Caa2 or lower. A common way of obtaining distressed debt is to buy them from their existing owners. These original investors often sell off their investments to others when a company enters in financial distress. The original investors are not willing to take the chance that they will end up with nothing and choose for the option of selling it for a lower amount to a new investor. The last few year hedge funds have been the largest buyers of such debt and skilled themselves in the packaging and restructuring of this type of debt.
In the years before the financial crisis in 2008 investors struggled with the fact that lending to normal corporates was no longer profitable enough. For the better part of the twentieth century companies were able to lend money directly to private investors via bonds or packages of bonds which resulted in a larger market with lower returns. Competition has caused that the return on corporate bonds is so low that a lot of investors argued that the price did not reflect the correct risk.
With the packaging of debt and sharing the individual risks a new investment opportunity arose. Hedge funds and other opportunists made it possible for a larger group of investors to invest in distressed debt. Normally the risk in investing in individual distressed debt was too large and only speculative investors are interested in this type of debt. The repackaging of this kind of debt meant that a new group of investors also was interested in investing and the size of the distressed market increased with a lot of secondary selling of these packages and distressed funds in which investors could invest.
4.2.Credit Risk
According to Giesecke’s definition: Credit risk is the distribution of financial losses due to unexpected changes in the credit quality of a counterparty in a financial agreement (Giesecke, 2004).
Bond issuers may default on their financial obligations to the bond holders. Therefore bondholders demand extra compensation in the form of credit premium for the amount of credit risk they are facing.
Credit risk is believed to comprise out of two different components for a company, systematic risk and idiosyncratic risk. Systematic risk comes from common factors in the market and idiosyncratic risk is from specific factors of a company itself.
10
4.2.1. Probability of default premium
The probability of default premium is the premium which is required for compensation for the fact that the issuer of the bond may default. This premium consists of the probability of default of a bond, the probability of a rating change of a bond, the uncertainty in case of default how large the exposure and recovery of the bond is. The loss one expects over the lifetime of a bond, which is calculated as (Duffie & Singleton, 2003):
Where PD= default probability and LGD = Loss given default
Probability of default is reflected in the credit rating that a company or an individual bond receives from a rating agency. These credit ratings are provided by rating agencies like Standard & Poor’s, Moody’s and Fitch. The highest credit rating (AAA) reflects that a company is less likely to default than a lower rated company (like BBB). The table below shows that a firm is more likely to default on the longer term than within a shorter period.
Table 2. Average cumulative default probabilities of different rating classes (in %) 1981-2009. Standard and Poor’s, 2009
Years 1 2 3 4 5 10 AAA 0.00 0.03 0.14 0.26 0.39 0.82
AA 0.02 0.07 0.14 0.24 0.33 0.74 A 0.08 0.21 0.35 0.53 0.72 1.97 BBB 0.26 0.72 1.23 1.86 2.53 5.60 BB 0.97 2.94 5.27 7.49 9.51 17.45
B 4.93 10.76 15.65 19.46 22.30 30.82 CCC 27.98 36.95 42.40 45.57 48.05 53.41
4.2.2. Liquidity risk premium
Liquidity risk is the risk that if an investor faces if he wants to sell an asset that at that point in time no or limited buying or selling possibilities are available in the market. Liquidity and the price of a financial instrument have a negative relation. Instruments which are illiquid always trade at discounted prices, according to Bongaerts et al (Bongaerts, et al., 2009). Because of this risk investors demand a liquidity premium in order to receive compensation for running this risk.
4.2.3. Premium for additional risks
11
4.3. Credit risk modeling
Many models have been developed in order to develop the best model for modeling the probability of default. There are many variations and extensions on theories and models which comment on the way probability of default should be determined and measured, but there are two main approaches in order to determine the default process, reduced-form models and structural models.
Merton composed a model based on the capital structure of a firm. This approach is considered the basis of the structural approach models. In this approach it is assumed that a company defaults at the bond at maturity time T if its assets value falls below the value of its debt or a specified value, both at time T. In this approach the equity of the firm becomes a contingent claim of the assets of the firm’s assets value (Merton, 1974). Black and Cox extended this model by generalizing Merton’s method into the first passage approach. In their model the firm defaults when the first time that the assets drop to a sufficiently low default boundary, regardless of this occurs at maturity time T.
Reduced form approach is set out by (Artzner & Delbaen, 1995), (Jarrow & Turnbull, 1995) and (Duffie & Singleton, 1999). Reduced-form credit models are models in which the default of a company is set by a default-intensity process. The most basic model states that the default intensity process is governed by the first arrival time of default τ of a Poisson distributed process with a constant mean arrival rate of λ. More advanced models incorporate the company’s credit rating or other drivers of default to model the default intensity process more accurately. In these models the probability of default is set by looking at historical data and calibrating the model so it will reflect the right probability of default or intensity process. This implies that that the credits modeled should reflect the same type of debt as the used historical data.
One of the first reduced form models makes use of a Vector Auto Regression model. The Vector Auto Regression model is an econometric model which is often used to predict various types of variables. The VAR models are a generalization of the AR and ARMA models. Vector Autoregressive Models have been used for generating the economic scenarios and have been used in macro-economics since 1980. All the variables in a VAR are treated similarly by including for each variable an equation explaining its evolution based on its own lags and the lags of all the other variables in the model.
12
4.4.Structural or firm value credit models
Structural models try to model the inability of the issuer to repay the loan. Companies are in default when they cannot meet their financial obligations. The value of the company’s assets and debt are used in order to determine if a company is in default. Black and Scholes (Black & Scholes, 1973) and Robert Merton (Merton, 1974) proposed a structural model for modeling corporate liabilities and the probability of default. In this model the liabilities are determined as the initial market price of assets less the initial market value of the equity. The default of a company occurs when, at the maturity of the debt (T), the issuer’s assets at maturity (T) are less than the face value of the debt at that moment.
In the structural model of default probability of Black and Scholes is asset value of a firm (V) described as a stochastic process under which:
Where µ is the mean rate of return on assets and is the proportional cash payout rate, is the assets volatility and B(t) is a Standard Brownian motion with a unit variance parameter and a constant drift.
Let’s set τ as the Default time. The firm is assumed to default at the bond with maturity date T, if the total market value of the firm is lower than the total amount of debt. Thus the default time τ is a discrete random variable given by
{
Where D is the total amount of debt.
Figure 1 shows that the probability of default is the part of the distribution of the assets value which falls below the value of the liabilities.
Figure 1. The Black-Scholes-Merton structural model of default (Duffie & Singleton, 2003)
13 that the value of the debt a company is not in immediate default. Only when a company is unable to meet the promised financial obligations one can state that it is in default. Therefore Black and Cox (1976) proposed to a company is only in default when the assets drop below a certain set boundary.
The classic Merton model (Merton, 1974) predicts a positive correlation between corporate bond credit spread and stock return volatility. Many studies have empirically identified this link at both the aggregate and firm level. But for some stocks the positive correlation is far from perfect.
As the new model will be used to capture the behavior of three different types of corporate bonds it needs to be clear on which measures the new model will be tested. The next paragraph describes the risk measures on which the proposed model will be evaluated for three iBoxx corporate bond indices.
4.5. Determining risk measures
For determining if the proposed model adequately captures the behavior of the corporate bond types it is needed to look if the risk measures which are derived from the return distribution are in line with the risk measures derived from the traditional distribution risk measures. Therefor it is needed that the corporate bond returns from the proposed model are tested for their risk measures and could perform well. The proposed model needs to be tested if it shows the same level of variance and if the overall return distribution follows the same shape as the realized returns of the iBoxx benchmarks.
In order to comment on the risk measures of the proposed model a better understanding of these risk measures is needed. The proposed model provides good risk measures if the returns out of the model capture the behavior of the corporate bonds. For looking at the degree of risk in corporate bonds often is made use of the volatility of the price of an asset as the main indicator of the risk of an asset. This volatility is defined as the conditional standard deviation of the financial time series of (log-)returns. If the volatility of an assets return is high, the possible losses (or gains) are also high. In the past a lot of effort has been put in to understand which factors are driving the price of an asset. If these driving factors are known they can be used describing the risks of a corporate bond.
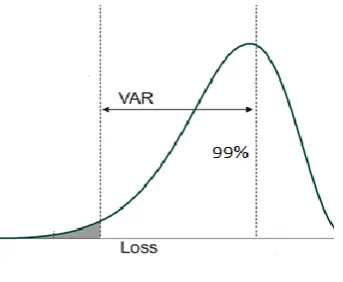
14 Value-at-Risk at time t and at level of significance 1-α is defined by the following expression.
[image:20.595.214.386.241.382.2]
If a level of 99% confidence is taken the VaR can be determined by:
Figure 2. VaR model
Some of the VaR models used in ALM software assumes that returns are Normally distributed with N(µ,σ2). Here also lies its weakness, as recent financial crises have shown, financial returns do not have to be Normally distributed. Duffie & Singleton state that whether or not the VaR of a portfolio is a relevant risk measure over a short time period depends on the liquidity of the portfolio and the risk of adverse extreme events which will result in net cash outflows or of severe disruptions in market liquidity (Duffie & Singleton, 2003). For this research we will therefor refer to historical simulation in order to comment on the VaR of the portfolios of corporate bonds.
15
5. Proposed model
This chapter will describe the how the three corporate bond types will be set up in the proposed model. Before describing each of the three corporate bond types separately a more high level description will be given.
The proposed model starts with a firm value model approach to model corporate bonds which is in line with the structural model as comprised by Merton, to model a corporate bond as a nominal risk free bond plus derivatives on the company’s equity. For each of the three different types of corporate bonds a different set of equity derivatives will be used. By making use of actual market implied volatilities provided by major investment banks the proposed model does not have to estimate this parameter and next to setting the correct option strike no parameters have to be estimated. Because of the fact that no parameters have to be estimated this approach could intuitively provide a better fit than the mentioned reduced-form models which often make use of VAR and GARCH models to estimate the used parameters. The proposed model will be a non-linear factor model in terms of market factors because the proposed model contains equity options for which the return varies non-linearly with the value of the underlying. The proposed model splits the three corporate bond types in a two parts, namely (1) a risk free bond and (2) a set of equity derivatives depended on the characteristics of the corporate bond. The model will therefor take the following form for each of the type of corporate bonds modeled:
(1) In each of three types of corporate bonds the value of the risk free bond is calculated by:
( )
∑
( )
Where:
= current price of the bond (t=0) c = annualized coupon
v = annual frequency of coupon payments N= notional of the bond
= maturity of the bond (in years)
= the spot-interest rate for a payment due at (with in years)
(2) The value of the equity derivatives used for determining the value the three corporate bonds are calculated by making use of the Black-Scholes option pricing formula for
determining the value of the used call and put options:
16 And
With
√
√ √
Where
Call= European call option price Put= European put option price
= stock price at t=0
T= time to maturity of option σ= stock price volatility
r = continuous compounded risk free rate K= strike price
N = the cumulative probability distribution function for a standardized normal distribution The classic Merton model assumes that the value of a corporate bond depends on the value of the assets of the company. The proposed model does recognize this relationship as well, but assumes that this relationship is not straightforward if for example collateral is taken into account. By modeling the risk premium of a corporate bond with equity derivatives, the delta of these derivatives will vary as the value of the underlying company will change. The most prominent effect therefore is the fact that the corporate bond will be more sensitive to equity returns in a prolonged equity crisis, as the delta of the put option will be higher after a downturn of the equity markets.
The Merton model assumes that the volatility of the value of the assets of company ( ), is comprised out of the volatility of the equity of the firm ( ) and the leverage in the company ( ).
17 able to improve the ability to capture the behavior of the corporate bond returns. The proposed model takes of the following functional form:
)
Here W denotes the value of the corporate bond and where the inputs are the risk free interest rate, S is the spot equity price, is the implied volatility. The model is furthermore defined by the parameters set for the equity instruments, namely the number and nature of the instruments, the maturity of each instrument and the strike of each instrument.
Herewith we replace the value of the assets of the company and the leverage factor with the market valuation of the package consisting of these assets and the financing by the equity price (E) and the implied volatility ( ). The risk free interest rate (rf) is for ease of
implementation taken as the swap rates instead of government bonds. The market factors are now completely observable and therefor there is no need to have a further complexity added to the economic model.
This proposed model is not an entirely new approach for modeling corporate bonds. Previous attempts of using this approach estimated the volatility of the returns of the corporate bonds indices (Hull, et al., 2004) (Haesen & Houweling, 2011). This implied volatility is needed for valuing the equity options used in the model. This estimation of the implied volatility caused an additional variable which should be estimated and therefore further complicated the use of the model in economic scenario generation. This research uses the actual market implied volatility used by investment banks to trade their equity options. The market implied volatilities are obtained by averaging the implied volatility of major investment banks in Europe.2 The data reflects the implied volatility used for pricing OTC derivatives on the Euro Stoxx 50. The range of the market implied volatilities at certain strikes provided by the investment banks consist of strikes between 70% - 130% as no the market outside this range is too small for investment banks to give quotes where parties can trade on. The fact that derivatives are bought and sold based on these implied volatilities ensures the correctness.
The way corporate bonds are modeled in the proposed model depends, in addition to the standard Merton model, on the characteristics of the type of corporate bonds. The asset classes which are going to be examined are investment grade corporate bonds, collateralized corporate bonds and high yield corporate bonds. These three asset classes are chosen as these are the most common in the portfolios of many large financial institutions. In the next paragraphs the three corporate bond models which require different derivatives are described.
2
18
5.1. Modeling of investment grade corporate bonds
Investment grade corporate bonds are modeled in the proposed model as a risk free nominal bond and a sold put option. This approach is in line with the standard Merton model. If the value of the company decreases the value of the bond also will decrease. If the value of the company rises above the face value plus the coupon the corporate bond should not increase in value anymore. The sold put makes sure that if the company’s value decreases also the value of the corporate bond will decrease.
For the modeling investment grade corporate bonds a risk free bond has been modeled with the duration equal to the average constituting bonds of the iBoxx euro investment grade corporate index plus a sold put option on the Euro Stoxx 50. In order to adequately reflect the index a series of 5 put options have been modeled each with a different maturity, e.g. 1 till 5 years. The received premium and the payoff of the put options are added to the return of the risk free bond.
The strike of the put option has been set at 70%. There is no specific reasoning for setting the 70%, other than that the 70% is the lowest strike available in the provided market data by the investment banks. The strike at 70% can be interpreted as the point from which the risk premium is no longer sufficient to cover the loss. Below the 70% the put option will mimic the loss an investor would make when a corporate bond will go into default. The options are modeled using a Black-Scholes model with the interest rate given by the market interest rates and the volatility used is the corresponding volatility for valuing an equity option on the Euro Stoxx 50 with a strike at 70%.
The proposed model for an investment grade corporate bond index can therefore be described by:
In a formulaic form (for the complete definition of the functions P and Put, see above):
∑
The volatility used as earlier mentioned is the actual implied volatility used in pricing the Euro Stoxx options by major investment banks in Europe. Because this implied volatility is given there is no need to estimate this parameter.
19 has been set for the investment grade bond index at a strike of 70%, which is the lowest strike provided by the investment banks. The market for lower strikes is not big and liquid enough to obtain tradable quotes which could be used in this model. The level of 70% does not imply a 30% solvency of the average company, but the drop in the equity index value when actual defaults will start to take place. The pay-off profile of an investment grade corporate bond is shown in the below graph.
Figure 3. Value of corporate loan
As the corporate bond index comprises out of several bonds it is assumed that the actual payoff structure will be more smoothened. Generally speaking not all bonds will default at exactly the same time. The payoff structure is capped to the notional plus the interest. The part of the payoff above 100 reflects the risk free rate plus the risk premium which is received for being exposed to several risks.
Hence the below payoff structure shows how the proposed model with 5 put options with different maturities will look. The volatility is kept constant at 25% and risk free interest rate at 1.5%. Using the Black-Scholes option pricing formula it shows the payoff profile of a corporate investment grade bond index approximated by a staggered set of sold put options plus a risk free bond.
0 20 40 60 80 100 120
10 20 30 40 50 60 70 80 90 100 110 120 130
p
ay
o
ff
o
f c
o
rp
o
rate
b
o
n
d
Equity price
20
Figure 4. Investment grade corporate bond with different maturities.
5.2. Modeling of collateralized corporate bonds
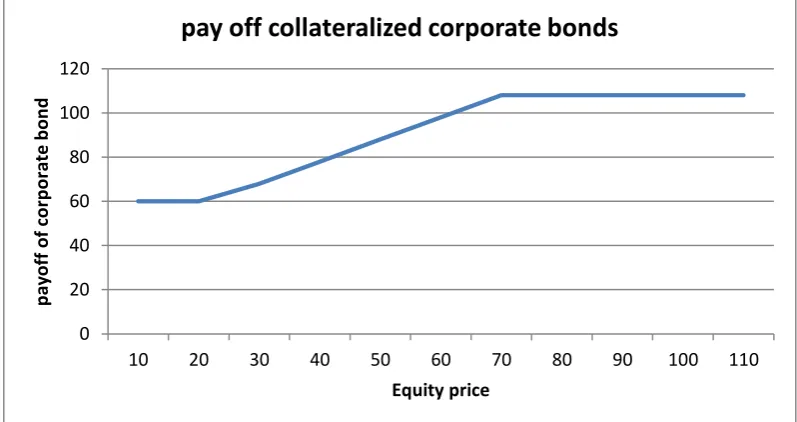
Collateralized corporate bonds are modeled in the proposed model as a nominal risk free bond, a sold put option on the equity index and a bought put option on the underlying equity index. The nominal risk free bond and the sold put option make sure that if the value of the companies in the index decreases the value of the corporate bond also decreases. The minimum value of a collateralized bond will be the value of the collateral which has been pledged by the issuer. If the issuer is not able to meet his financial obligations, the holder of the loan may sell the collateral pledged and recover part of his loss. To reflect this corporate bond a bought put option makes sure the value of the corporate loan will never drop below the value of the collateral pledged. The below graph shows the payoff profile of the collateralized corporate bond.
For the proposed model a nominal bond has been modeled with the duration equal to the average constituting bonds of the iBoxx euro collateralized AAA corporate index, a sold put option on the Euro Stoxx 50 and a bought put option at a lower strike. The bought put option reflects the collateral which is posted for the corporate bonds. In order to reflect the index a series of 5 put options have been modeled each with a different maturity, e.g. 1 till 5 years. The received premium and the payoff of the put options are invested in the risk free bond. The strike of the sold option has been set at 70% and the bought put options have a strike at 30%. There is no specific reasoning for setting the 70%, other than that the 70% is the lowest strike available in the provided market data by the investment banks. Setting the strike of the bought put options at 30% is in line with common market practices for collateralized corporate bonds. The 70% can be interpreted as the point in which a company will be in default. The volatility used is the corresponding volatility for valuing an equity option on the Euro Stoxx 50 with a strike at 70%.
0 20 40 60 80 100 120
10 20 30 40 50 60 70 80 90 100110120130140150160
p
ay
o
ff
Equity price
Investment grade corporate bond
1 year
2 year
3 year
4 year
21 The proposed model for a collateralized bond index can therefore be described by:
In a formulaic form (for the complete definition of the functions P and Put, see above):
∑
∑
[image:27.595.115.514.388.599.2]
The payoff of the collateralized corporate bonds as modeled in the proposed model is shown in the below graph as an example of how these corporate bonds will be modeled.
Figure 5. Pay off structure collateralized corporate bond.
If we look at different maturities for the two put options, keeping volatility (25%) and risk free interest rate (1.5%) the constant, the payoff of a corporate collateralized bond is more smoothened. The payoff is calculated using the Black-Scholes option pricing formula.
0 20 40 60 80 100 120
10 20 30 40 50 60 70 80 90 100 110
p
ay
o
ff
o
f c
o
rp
o
rate
b
o
n
d
Equity price
22
Figure 6. Pay off collateralized corporate bond throughout time.
5.3. Modeling of high yield corporate bonds
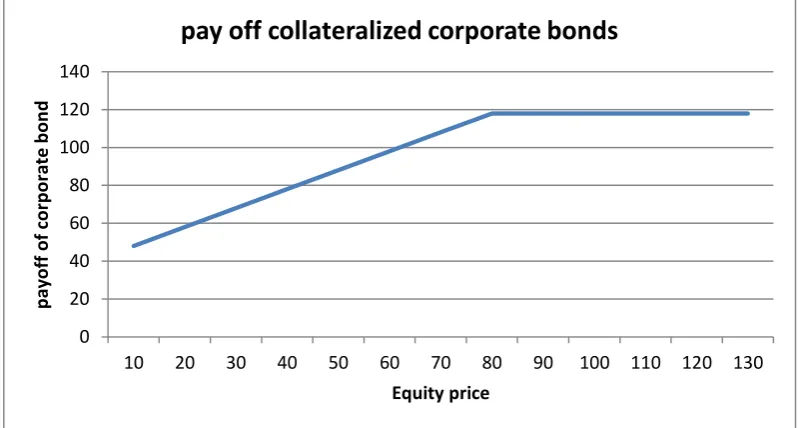
High yield corporate bonds are modeled in the proposed model as a nominal interest rate bond, sold put option and a bought call spread. The nominal risk free bond and the sold put option again make sure that if the value of the companies in the index decreases the value of the corporate bond also decreases. The fact that this is a high yield corporate debt means that the addition of the call spread reflects the additional return that may be made if the company recovers. This additional payoff compared to an investment grade corporate bond is shown by the fact that in this example the maximum payoff of 118 is possible, whereas the maximum return on an investment grade corporate bond is 108.
The proposed model is set up by making use of equity options which together will have the same payoff of that of high yield corporate bond returns. A sold put option with a strike of 70% will make sure that when the underlying value of the Euro Stoxx index will decrease the value of the corporate bonds will also decrease. In order to reflect the index a series of 5 put options have been modeled each with a different maturity, e.g. 1 till 5 years. The fact that high yield bonds in the actual market will sell below the clean market value is realized by a call spread. This call spread consists of a bought call with a strike at 70% and a sold call with a strike at 100%. There is no specific reasoning for setting the 70%, other than that the 70% is the lowest strike available in the provided market data by the investment banks. The strike at 70% can be interpreted as the point from which the risk premium is no longer sufficient to cover the loss. Below the 70% the put option will mimic the loss an investor would make when a corporate bond will go into default.
The proposed model for a high yield index can therefore be described by:
0 20 40 60 80 100 120
10 20 30 40 50 60 70 80 90 100 110 120 130 140 150 160
p
ay
-o
ff
Equity price
collateralised corporate bond
1 year
2 year
3 year
4 year
23 In a formulaic form (for the complete definition of the functions P, Put and Call, see above):
∑
∑
∑
[image:29.595.97.500.327.541.2]
The payoff of these high yield corporate bonds is shown in the below graph as an example of how these corporate bonds will be modeled.
Figure 7. Pay off high yield corporate bond throughout time.
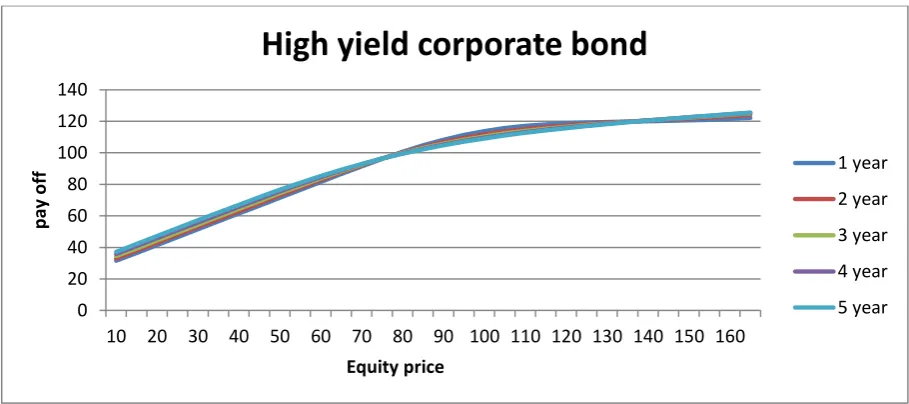
When buying distressed or high yield corporate bonds the extra return in comparison with a nominal bond is made by the fact that these bonds will sell at a lower bond price in comparison to other investment grade investments.
Keeping volatility (25%) and risk free interest rate (1.5%) constant the payoff of a high yield corporate bond using the Black-Scholes option pricing formula is shown below for the total portfolio of equity derivatives plus the risk free bond.
0 20 40 60 80 100 120 140
10 20 30 40 50 60 70 80 90 100 110 120 130
p
ay
o
ff
o
f c
o
rp
o
rate
b
o
n
d
Equity price
24
Figure 8. Pay off high yield corporate bond with different maturities. 0
20 40 60 80 100 120 140
10 20 30 40 50 60 70 80 90 100 110 120 130 140 150 160
p
ay
o
ff
Equity price
High yield corporate bond
1 year
2 year
3 year
4 year
25
6. Description of data
This chapter describes the data which will be used in the next chapter for researching the working and effectiveness of the proposed model. The only uncertain parameter in the proposed model will be the strike of the equity options, therefor the description of the used data will be the actual data used for testing the proposed model. The monthly corporate bond index returns are obtained from observable market corporate bond indices. As corporate bond index the Markit iBoxx indices are used. These indices are maintained by Markit. The iBoxx indices are the market leading fixed income benchmark indices. These indices are available for Euro, Sterling, USD and Asia. The indices used for this research are Euro indices comprised out of investment grade, collateralized and high yield corporate bonds.
For modeling the corporate bond returns and comparing them against actual market returns several sources of data have been used. For modeling the corporate bond returns risk free market interest rates, an equity index and its corresponding implied volatility have been used. These modeled returns are compared against actual corporate bond index returns.
6.1. Bond indices
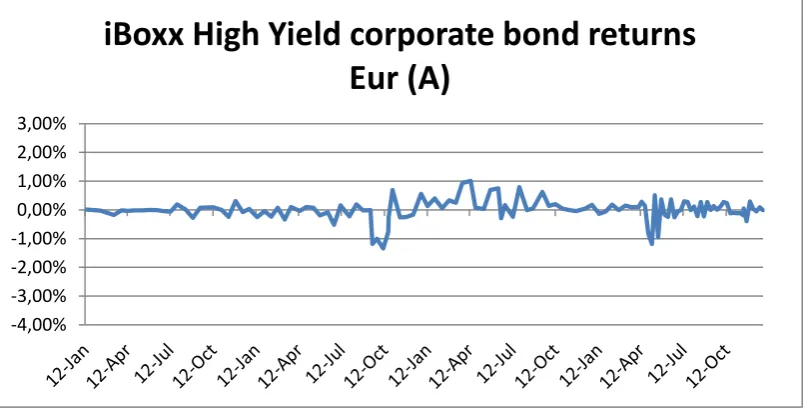
[image:31.595.107.489.498.700.2]As already stated we will apply the proposed model to three different types of corporate bonds. We have chosen for three indices from the iBoxx family, each representing the universe of this bond type. These indices comprise out of corporate loans which are based in the Euro zone. The historical monthly returns of these indices have been calculated from January 2007 till the end of 2011. Below graph describes the characteristics of the historical returns of the three indices.
Figure 9. iBoxx investment grade corporate bond returns
For comparing the investment grade corporate bond returns the ‘iBoxx investment grade corporate bonds (A)’ is used. The returns in the graph above show that the returns made on
-4% -3% -2% -1% 0% 1% 2% 3%
26 the corporate bond index shows large movements in the period between August 2008 and December 2010. These euro corporate bonds also have an average maturity of 5 years with a rating of A.
[image:32.595.111.484.243.465.2]For the modeling of the euro collateralized bonds, corporate bonds with an average maturity of 5 years and a rating AAA have been used. The reason why AAA bonds have been chosen is that with AAA bonds we now that the change in collateral value will be minimal as in this research the change in value of the underlying company will be tested. The iBoxx collateralized AAA index has been used, which comprises of corporate loans with a fixed coupon and which are secured by high quality been collateral.
Figure 10. iBoxx collateralized corporate bond index returns
For the modeling of high yield corporate bonds, the ‘iBoxx euro high yield A’ has been used. This index comprises of high yield corporate bonds with an average maturity of 5 years and a rating B. For these types of bonds the ‘iBoxx Euro High Yield’ index has been used. This index comprises of corporate loans with a fixed coupon which a high risk and hence a high yield.
-4,00% -3,00% -2,00% -1,00% 0,00% 1,00% 2,00% 3,00%
27
Figure 11. iBoxx high yield corporate bond index returns
6.2. Interest rates
The interest rates used in the model in order to price the nominal bonds and derivatives are the swap rates. This curve is commonly used in the market to fair value derivatives and risk free nominal bonds. Swap rates are the risk free interest rates which make the market value of the underlying swap at inception zero. Swap rates are viewed equal to the risk free rate, because these rates only apply to interest rate swaps which are collateralized and therefore are stripped of any other risk than the interest rate risk.
[image:33.595.97.501.73.278.2]For euro denominated derivatives one should use the euro swap rates. As the used euro corporate bond indices is comprised out of corporate bonds with an average maturity of 5 years. The bonds and derivatives are modeled in such a way that the average maturity and duration equal that of the iBoxx bond indices. Therefore no swap rates are used beyond the 5 year point
Figure 12. Euro swaprates -4,00%
-3,00% -2,00% -1,00% 0,00% 1,00% 2,00% 3,00%
iBoxx High Yield corporate bond returns
Eur (A)
0,00% 1,00% 2,00% 3,00% 4,00% 5,00% 6,00%
Euro swap rates
1y
2y
3y
4y
28 The interest rates show that up until the crises of 2008 the spread between the different tenors was not more than a few basis points. After the crisis the spread diverged as much as 2% between the 1 year and 5 year risk free swap rate.
6.3. Equity market
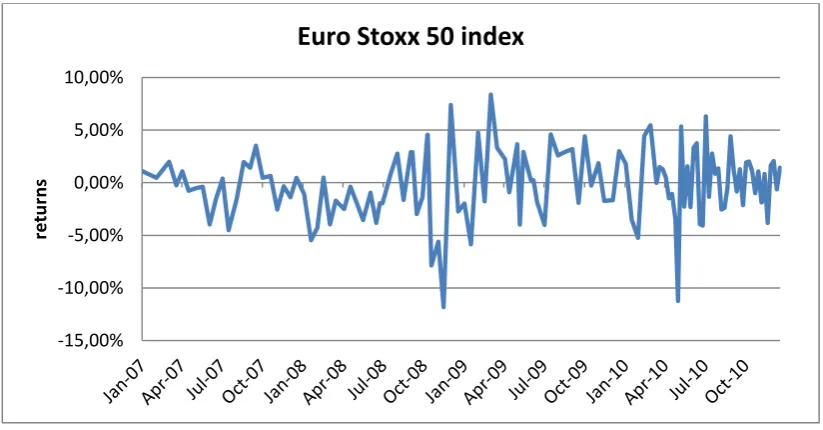
[image:34.595.91.503.267.482.2]For modeling the corporate bonds derivatives are being used which have as underlying an equity index. Because the corporate bonds are bonds which are issued by European the companies’ equity index used is the Euro Stoxx 50 index. This index is an often used benchmark for European equity. This index covers 50 stocks from several countries in Europe, such as Austria, Belgium, Germany, France and the Netherlands.
Figure 13. Euro Stoxx 50 index returns
The graph above shows that whereas corporate bond indices moved as much as -3% or +2%, the Euro Stoxx 50 index is showing -12% and +9%. This means that the equity index is more volatile than the iBoxx bond indices.
6.4. Implied volatility
The original Merton model and other asset value models in general assume that the debt and the assets are being modeled. The asset value of a company should therefore be used to model the corporate bonds with derivatives. The problem is that the asset value of a company is not observable in the market and therefore also not the volatility of the asset value ( The stock market shows equity values of a company and therefore also the equity volatility (
Nickell, Perraudin and Varotto (2000) state that the asset value may be derived from the equity values by making use of the book value of the firm’s liabilities (Nickell, et al., 2000). This is not public information for all the companies in the Euro Stoxx 50 index and if found this data is not published at a daily or weekly frequency. Bluhm, Overbeck and Wagner
-15,00% -10,00% -5,00% 0,00% 5,00% 10,00%
re
tu
rn
s
29 (2003) also make reference in their approach where the equity value process is transformed into an asset value process by making use of Itô Calculus (Bluhm, et al., 2003). Hull, Nelken and White (2004) also showed that
Where E is defined as the value of the firm’s equity and A the value of its assets, and are the values at time zero and and are the instantaneous volatility of the company’s equity and asset value at time zero (Hull, et al., 2004).
Both the approaches of (Bluhm, et al., 2003) and (Hull, et al., 2004) require additional modeling of the volatility or the volatility skews and the starting point of the proposed model was to try and avoid this complexity in the model.
The implied volatility used for valuing the options on the Euro Stoxx 50 index is shown in the below figure.
Figure 14. Implied volatility of Euro Stoxx 50 index with different strikes
The figure shows that in the period of the crisis the implied volatility has increased greatly. In august of 2008 the implied volatilities has risen by more than 40% to a level of more than 60%. After which markets did not return to the levels before the crisis. The average implied volatility in the below graph is approximately 25%.
0,0% 10,0% 20,0% 30,0% 40,0% 50,0% 60,0% 70,0%
Implied volatility Euro Stoxx 50 index
30
7. In Sample test
In order to test if the proposed model captures the behavior of the corporate bonds the model is tested on the aforementioned iBoxx corporate bond indices. The risk measures derived from both the proposed model and the indices will be compared to be able to conclude this is the case. The hypothesis which is going to be tested is that modeling the three types of corporate bonds with the proposed model will capture the behavior of the corporate bonds.
H0: Xmodel = Xindices
HA: Xmodel ≠ Xindices
Where X is the return distribution.
The above stated hypothesis looks if the proposed model adequately captures the behavior of the different kind of corporate bonds. Note that because of the very irregular probability distribution, it is not possible to use statistical tests for rejecting the null hypothesis.
Firstly an in-Sample test will be performed which will test the fit of the proposed model with the implied volatility obtained from major investment banks in Europe against the iBoxx returns. The strikes of the put and call options used in the model are calibrated to maximize the explained variance (R2). This calibration showed that setting the strike at 70% for all three types of corporate bonds showed the best result. The In Sample test will be performed of the period 2006-2010.
The calibrated models will be compared to the iBoxx indices. In the next chapter an out-of-Sample test will be performed with the calibrated strikes over the year 2011 in order to see whether the model will provide good outcomes when it has been calibrated.
7.1.Testing methodology
A lot of literature has been written on describing the behavior of interest rates (Illmanen, 1995), equity markets (e.g. (Welch & Goyal, 2008)) and other studies on the predictability of corporate bonds (e.g. (King & Fuller, 1994)). The new proposed model will be tested by making use of linear regressions. Equal to the studies on interest rates, equity markets and other corporate bonds a least squares regression using end of month returns rt on values of
K explanatory variables X1, t…,XK,t.
31 As shown by Ben Dor et al. (2007), the volatility of corporate bonds' excess returns over Treasury is not constant over time. They provide strong evidence that excess return volatility is higher when spreads are higher.
In chapter 8 we describe the In-sample tests will be performed by running the regression in month t. The obtained in-sample R2 shows for each type of corporate bond how much of the variation in returns over the past t months could be explained by variation in the explanatory variables.
The use of implied volatility plays a large role in proposed model as one of the main advantages is that this parameter does not have to be estimated. In order to determine whether the use of the actual market implied volatility the outcome of the proposed model improves the model will also be run with a constant average implied volatility. The analysis of the actual market implied volatilities showed that for the Euro Stoxx 50 this equals approximately 25%, hence this figure will be used as a constant.
7.2. Proposed model with use of market implied volatilities
The three types of corporate bonds will be tested in the next sub chapters. The results of the model with the actual market implied volatilities are described by determining the R squared and is based on descriptive statistics like mean, standard deviation, kurtosis and skewness.
7.2.1. Investment grade corporate bonds
[image:37.595.79.517.516.731.2]To compare the test results of the euro investment grade corporate bonds index the proposed model has been tested against the iBoxx euro investment grade bond index. As mentioned earlier the period which the In-Sample test will be performed is 1, January of 2006 until 31st of December 2010. The figure below shows iBoxx euro investment grade corporate index and the proposed model returns.
Figure 15. Proposed model and iBoxx investment grade corporate bond returns -4,00%
-3,00% -2,00% -1,00% 0,00% 1,00% 2,00% 3,00%
Proposed model and iBoxx investment grade corporate bond returns
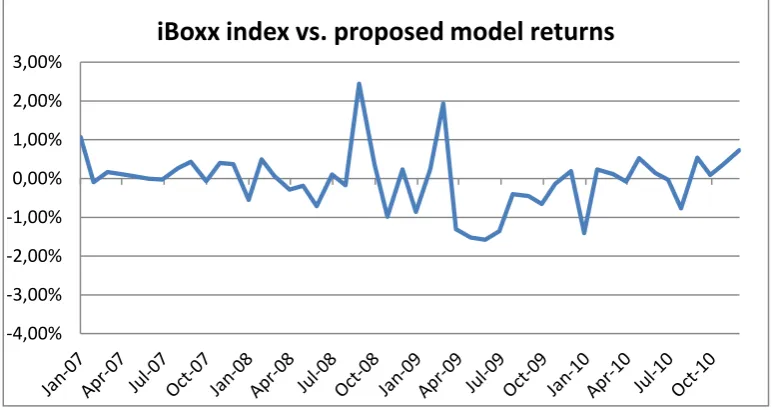
32 The below graph show the differences between the iBoxx investment grade corporate bond index and the investment grade corporate bond returns from the proposed model.
Figure 16. The difference between the iBoxx investment grade corporate bond index and the proposed model returns
If we compare the returns of the proposed model to the iBoxx investment grade index returns differences between 2% and -2% are observed. The largest differences occur in the months September 2008 and March 2009. The positive differences indicate that the proposed model shows higher returns than the iBoxx index returns. The period after March 2009 shows slightly negative differences.
[image:38.595.104.491.138.343.2]Below the descriptive statistics are given for the both the iBoxx investment grade corporate bond index and the proposed model for investment grade corporate bonds with actual market implied volatility.
Table 3. Descriptive statistics iBoxx investment grade index and proposed model returns
Proposed model with implied vol Iboxx Euro investment grade
Mean -0,12% Mean -0,01%
Standard Error 0,003 Standard Error 0,0014
Median 0,0005 Median -0,0013
Standard Deviation 0,02 Standard Deviation 0,01
Kurtosis 8,9 Kurtosis 1,7
Skewness -2,2 Skewness -0,3
As seen both means are close to 0. The proposed model does show a higher volatility, as reflected by a higher standard deviation. The kurtosis of the proposed model is 8.9 which compared to the 1.7 of the iBoxx returns is higher.
-4,00% -3,00% -2,00% -1,00% 0,00% 1,00% 2,00% 3,00%
33 A linear regression on both series of returns shows that the R2 is 0.33. This R square shows that the explained portion of the variance is in line with expectations.
Table 4. Regression statistics iBoxx investment grade index and proposed model returns
Regression Statistics
Multiple R 0,57
R Square 0,33
Adjusted R Square 0,3
Standard Error 0,008
If we compare both time series we see that the sign test shows that in 60% of all cases the proposed model shows the correct sign.
The statistics of the regression show that it is also interesting from a risk management perspective to look at the distribution of both series. The frequency table below shows the iBoxx investment grade corporate bond index returns and the proposed model returns for investment grade corporate bonds in the same period.
Figure 17. Frequency table iBoxx investment grade index and proposed model returns
The frequency table clearly shows that the proposed model is more evenly distributed. The weight of the distribution does not center as much around the mean as seen by the iBoxx investment grade corporate bond returns. This observation is backed by the higher standard deviation of the proposed model.
0 1 2 3 4 5 6 7 8 9
34
7.2.2. Collateralized corporate bonds
[image:40.595.94.502.197.417.2]The collateralized corporate bonds are in a similar manner as the investment grade bonds tested against a benchmark. The collateralized corporate bonds in the proposed model are tested against the iBoxx euro collateralized AAA bond index. Again the period which the In-Sample test will be performed is 1, January of 2006 until 31st of December 2010. The figure below shows the returns of the iBoxx collateralized AAA index and the proposed model returns for collateralized corporate bonds.
Figure 18. iBoxx and proposed model collateralized corporate bonds returns
The below graph show the differences between the iBoxx collateralized corporate bond index and the investment grade corporate bond returns from the proposed model.
Figure 19. iBoxx collateralized corporate bond index versus proposed model returns -6,00%
-4,00% -2,00% 0,00% 2,00% 4,00% 6,00% 8,00%
iBoxx and proposed model collateralized corporate bond returns
iBoxx Proposed model
-8,00% -6,00% -4,00% -2,00% 0,00% 2,00% 4,00% 6,00%
iBoxx collateralized corporate bond returns vs. proposed model
[image:40.595.118.478.495.715.2]35 The returns of the iBoxx Collateralized AAA index show a less volatile pattern compared against the investment grade corporate bond returns. This is also expected due to the characteristics of the collateralized corporate bonds. The fact that they are collateralized means that in case of default the collateral may be sold by the bondholder in order to cover some of the losses.
The difference between the proposed model and the iBoxx collateralized index returns show a more volatile pattern than the proposed model compared to the investment grade corporate bond returns. The proposed model for collateralized corporate bonds seems to be unable to capture the behavior of the collateralized corporate bond index.
Below the descriptive statistics are given for the both the iBoxx index and the proposed model with the corresponding actual market implied volatilities.
Table 5. Descriptive statistics proposed model and iBoxx index returns
Proposed model collateralized
corporate bonds iBoxx Euro collateralized AAA
Mean -0,001 Mean 0,00002
Standard Error 0,003 Standard Error 0,002
Median -0,001 Median -0,001
Standard Deviation 0,02 Standard Deviation 0,095 Sample Variance 0,0004 Sample Variance 0,0001
Kurtosis 4,1 Kurtosis 0,09
Skewness 0,96 Skewness 0,56
36
Figure 20. Frequency table proposed model with fixed implied volatility and iBoxx collateralized index returns
The frequency table shows that the proposed model seems to be more skewed than the actual iBoxx collateralized index returns. Both means seems to be of the same size and the volatility of both time series also are of the same magnitude.
[image:42.595.72.539.71.332.2]Performing a linear regression on both time series shows that the R2 of the proposed model with the implied volatility from the market is 0.5%. This R2 is close to 0 which indicates that there is a lot of unexplained variance. The proposed model seems to be unable to capture the behavior of the collateralized corporate bonds.
Table 6. Regression statistics proposed model with fixed implied volatility and iBoxx index returns
Regression Statistics collateralized bonds with market implied volatility
Multiple R 0,07
R Square 0,00
Adjusted R Square -0,017
Standard Error 0,02
7.2.3. High yield corporate bonds
The high yield corporate bonds are compared against the iBoxx high yield corporate bond index. The period which the In-Sample test will be performed is 1, January of 2006 until 31st of December 2010. The figure below shows the returns of the iBoxx High Yield Euro corporate bond index and the proposed model returns for high yield corporate bonds.
0 1 2 3 4 5 6 7