ORIGINAL RESEARCH
ADULT BRAIN
MR Imaging–Based Analysis of Glioblastoma Multiforme:
Estimation of
IDH1
Mutation Status
X K. Yamashita,XA. Hiwatashi,XO. Togao,XK. Kikuchi, R. Hatae, K. Yoshimoto, M. Mizoguchi, S.O. Suzuki, T. Yoshiura, and X H. Honda
ABSTRACT
BACKGROUND AND PURPOSE: Glioblastoma multiforme is highly aggressive and the most common type of primary malignant brain tumor in adults. Imaging biomarkers may provide prognostic information for patients with this condition. Patients with glioma with isocitrate dehydrogenase 1(IDH1) mutations have a better clinical outcome than those without such mutations. Our purpose was to investigate whether theIDH1mutation status in glioblastoma multiforme can be predicted by using MR imaging.
MATERIALS AND METHODS: We retrospectively studied 55 patients with glioblastoma multiforme with wild typeIDH1and 11 patients with mutantIDH1. Absolute tumor blood flow and relative tumor blood flow within the enhancing portion of each tumor were measured by using arterial spin-labeling data. In addition, the maximum necrosis area, the percentage of cross-sectional necrosis area inside the enhancing lesions, and the minimum and mean apparent diffusion coefficients were obtained from contrast-enhanced T1-weighted images and diffusion-weighted imaging data. Each of the 6 parameters was compared between patients with wild typeIDH1and mutantIDH1by using the Mann-WhitneyUtest. The performance in discriminating between the 2 entities was evaluated by using receiver operating characteristic analysis.
RESULTS: Absolute tumor blood flow, relative tumor blood flow, necrosis area, and percentage of cross-sectional necrosis area inside the enhancing lesion were significantly higher in patients with wild typeIDH1than in those with mutantIDH1(P⬍.05 each). In contrast, no significant difference was found in the ADCminimumand ADCmean. The area under the curve for absolute tumor blood flow, relative tumor blood flow, percentage of cross-sectional necrosis area inside the enhancing lesion, and necrosis area were 0.850, 0.873, 0.739, and 0.772, respectively.
CONCLUSIONS: Tumor blood flow and necrosis area calculated from MR imaging are useful for predicting theIDH1mutation status.
ABBREVIATIONS:ASL⫽arterial spin-labeling; aTBF⫽absolute tumor blood flow; AUC⫽area under the curve; GBM⫽glioblastoma multiforme;IDH1⫽isocitrate dehydrogenase 1;IDH1m⫽mutantIDH1;IDH1w⫽wild typeIDH1;MGMT⫽O6
-methylguanine-DNA methyltransferase; %NEC⫽percentage of cross-sectional necrosis area inside the enhancing lesion; NECarea⫽necrosis area; rTBF⫽relative tumor blood flow; TBF⫽tumor blood flow
G
lioblastoma multiforme (GBM) is highly aggressive and the most common type of primary malignant brain tumor in adults. The characteristic histologic appearance of GBM includes hypercellularity, nuclear polymorphism, high mitotic activity,prominent microvascular proliferation, and/or necrosis. MR im-aging is the main noninvasive technique for diagnosing GBM. Conventional MR imaging techniques including pre- and post-contrast T1WI show precise anatomic localization and/or cen-trally nonenhancing regions, which are typically related histolog-ically to necrotic areas. Diehn et al1provided evidence that the
amount of necrosis correlated with outcome in patients with GBM. In addition, correlations were recently identified between the prognosis of patients with GBM and several functional imag-ing parameters, includimag-ing ADC derived from DWI, tumor blood volume calculated from DSC, and tumor blood flow (TBF) calcu-lated from arterial spin-labeling (ASL) perfusion MR imaging.2-7
ASL is a recently developed MR perfusion imaging technique that has advantages of being noninvasive, not requiring an extrinsic tracer, and allowing reliable absolute quantification, which is not affected by a disrupted blood-brain barrier.8ASL is increasingly Received March 19, 2015; accepted after revision May 22.
From the Departments of Clinical Radiology (K.Yamashita, A.H., O.T., K.K., T.Y., H.H.), Neurosurgery (R.H., K.Yoshimoto., M.M.), and Neuropathology (S.O.S.), Grad-uate School of Medical Sciences, Kyushu University, Fukuoka, Japan; and Depart-ment of Radiology (T.Y.), Kagoshima University Graduate School of Medical and Dental Sciences, Kagoshima, Japan.
This work was supported by Japan Society for the Promotion of Science KAKENHI (grant No. 26461828).
Please address correspondence to Akio Hiwatashi, MD, PhD, Department of Clini-cal Radiology, Graduate School of MediClini-cal Sciences, Kyushu University, 3-1-1 Maid-ashi, Higashi-ku, Fukuoka 812-8582, Japan; e-mail: [email protected]
Indicates open access to non-subscribers at www.ajnr.org
recognized as a noninvasive method for quantitative CBF mea-surement for assessing stroke, neurodegenerative diseases, and brain tumors.8-14ADC measurement is a widely used method.
Good correlations have been reported between ADC and tumor cellularity, and its utility for application in glioma grading has been addressed in many studies.15-19
GBMs are classified into primary and secondary GBMs. Pri-mary GBMs develop rapidly de novo, without clinical or histo-logic evidence of a less malignant precursor lesion.20In contrast,
secondary GBMs develop by progressing from a low-grade diffuse astrocytoma or anaplastic astrocytoma.20These GBM subtypes
are usually indistinguishable histologically. However, genetic evidence suggests that mutations in isocitrate dehydrogenase (IDH1) can be used to identify most secondary GBMs. TheIDH1
mutation status is an independent prognostic factor in patients with gliomas.21-23In previous reports, patients with gliomas with IDH1mutations had a better clinical outcome (median overall survival⫽2.0 –3.8 years) than those without such mutations (me-dian overall survival⫽0.8 –1.1 years).24,25In addition, a specific
compound impairs the growth of mutantIDH1but not wild type
IDH1glioma cells.26These approaches may offer new possibilities
for targeted therapy. The status ofO6-methylguanine-DNA meth-yltransferase(MGMT) promotor methylation is also an important factor for the prognosis of patients with GBM. Patients with GBM withMGMTpromotor methylation are more responsive to temo-zolomide therapy and have better clinical outcome than those without it.27-29Therefore, the detection ofIDH1mutations and MGMTpromotor methylation is of great importance for patients with GBM. Carrillo et al29suggested that patients with mutant IDH1have low vascular endothelial growth factor levels, which are associated with contrast enhancement. These findings led to the hypothesis that measurement of tumor vascularity and the necrosis area would be helpful to differentiate IDH1mutation status.
Our purpose was to investigate whether theIDH1mutation andMGMTmethylation status in GBM can be predicted by using MR imaging.
MATERIALS AND METHODS
This study was approved by the institutional review board of Ky-ushu University Hospital. Informed consent for study participa-tion was waived due to the retrospective nature of this study.
MR imaging data of consecutive patients between May 2007 and August 2013 were obtained and retrospectively analyzed. Considering the effect of perfusion parameters, we excluded en-rolled patients who received bevacizumab. Consequently, we ex-amined data for 55 patients with GBM (54 primary and 1 recur-rent) with wild typeIDH1(IDH1w: mean age, 54.8⫾18.6 years; range, 5– 83 years) and 11 patients with GBM (5 primary and 6 recurrent) with mutantIDH1(IDH1m: mean age, 39.9⫾11.8 years; range, 26 – 62 years). Among them, ASL was performed in 61.8% (34/55) of patients withIDH1wand 81.8% (9/11) of those withIDH1m. DWI was performed in 98.1% (54/55) of those with
IDH1w and 100% (11/11) of those withIDH1m, and conven-tional MR imaging was performed in 100% (55/55) of those with
IDH1wand 100% (11/11) of those withIDH1m. All primary and recurrent GBMs were histopathologically diagnosed by
board-certified neuropathologists. The average interval between MR im-aging and the operation was 7.1 days (range, 0 –15 days).
MR Imaging
All images were obtained by using a 3T MR imaging unit (Achieva 3T TX; Philips Healthcare, Best, the Netherlands) and an 8-chan-nel head array receiving coil for sensitivity encoding parallel imaging.
ASL
ASL was performed by using quantitative signal targeting with alternating radiofrequency labeling of the arterial region, a pulsed ASL technique developed by Petersen et al.30 The
details of the sequence have been described elsewhere.7 Our
quantitative signal targeting with alternating radiofrequency la-beling of the arterial region protocol consisted of 84 dynamic or 42 pairs of labeled and nonlabeled image acquisitions. Of these, 24 pairs were acquired with crusher gradients (velocity-encoding threshold⫽4 cm/s) and 12 pairs were acquired without crushers. These 36 pairs were acquired at a flip angle of 35°. An additional 6 pairs were acquired at a lower flip angle (11.7°) without crushers to estimate the actual flip angle that might vary across the brain due to inhomogeneity of B1. Other imaging parameters were as follows: labeling slab thickness⫽150 mm, gap between the label-ing and imaglabel-ing slabs⫽15 mm, sensitivity encoding factor⫽2.5, TR/TE⫽4000/ 22 ms, sampling interval⫽300 ms, sampling time points⫽13, FOV⫽240 mm, matrix size⫽64⫻64, imaging time⫽5 minutes 52 seconds. Seven 6-mm-thick transverse sec-tions (gap⫽2 mm) were placed to cover the tumor.
DWI
DWI was performed by using a single-shot spin-echo echo-planar sequence with the following parameters: TR/TE⫽3421/62 ms, 90° flip angle, NEX⫽1, 22 transverse sections, sensitivity encod-ing factor⫽2.5, section thickness/gap⫽5/1 mm, FOV⫽230 mm, 126⫻160 matrix, imaging time⫽44.5 seconds. Diffusion sensitizing gradients were applied sequentially in the x, y, and z directions with b factors of 0 and 1000 s/mm2.
Conventional MR Imaging
Postcontrast transverse T1-weighted spin-echo images (TR/TE⫽ 400/10 ms, flip angle⫽75°, NEX⫽1, 22 sections, section thick-ness/gap⫽5/1 mm, FOV⫽230 mm, 256⫻173 matrix, imaging time⫽2 minutes 43 seconds) were obtained. A standard dose (0.1 mmol/kg body weight) of a gadolinium-based contrast agent, gadopentate dimeglumine (Magnevist; Bayer HealthCare Phar-maceuticals, Wayne, New Jersey), gadoteridol (ProHance; Bracco Diagnostics, Princeton, New Jersey), or gadodiamide (Omniscan; GE Healthcare, Piscataway, New Jersey) was injected intrave-nously. Precontrast T1-weighted spin-echo, T2-weighted turbo spin-echo, and fluid-attenuated inversion recovery images were also obtained.
Detection ofIDH1Mutations andMGMTPromotor Methylation in Glioblastoma Tissues
snap-frozen in liquid nitrogen and stored at⫺80°C. Tumor DNA was isolated from the frozen blocks by using a QIAamp DNA Blood Mini Kit (QIAGEN, Tokyo, Japan). A 129-bp fragment spanning the catalytic domain ofIDH1including codon 132 was amplified by using the sense primer IDH1f 5⬘ -CGGTCTTCAGAGAAGC-CATT-3⬘ and the antisense primer IDH1r 5⬘ -GCAAAATC-ACATTATTGCCAAC-3⬘, as described previously.31,32
Se-quences were determined by using an ABI 3100 Genetic Analyzer (Applied Biosystems, Foster City, California).
DNA methylation status of theMGMTpromotor was deter-mined by bisulfite modification and subsequent methylation-spe-cific polymerase chain reactions. Methylation-spemethylation-spe-cific polymer-ase chain reactions were performed by using the primers previously reported by Esteller et al33and 50-ng
bisulfite-modi-fied tumor DNA, in addition to both methylated and unmethyl-ated control samples (CpGenome Universal Methylunmethyl-ated and Un-methylated DNA; EMD Millipore, Billerica, Massachusetts). The polymerase chain reaction conditions included 35 cycles of 30
seconds each at 95°C, 60°C, and 72°C. The polymerase chain re-action products were electrophoresed on 3% agarose gels. The method has been described in detail before.34
Image Analysis
[image:3.594.53.527.45.428.2]Bland-Altman analysis, the intraclass correlation coefficient, and the Spearman rank correlation coefficient.
Maps of ADC were calculated by using the following formula: ln(S/S0)⫽ ⫺b⫻ADC, whereS0andSare the signal intensities
when thebvalues are 0 and 1000 s/mm2, respectively, andbitself
is 1000 s/mm2. For ADC measurements, 1 author (K. Yamashita
performed the ROI analysis by using a PACS system. Four or more circular ROIs (area,ⱖ10 mm2) were placed on ADC maps
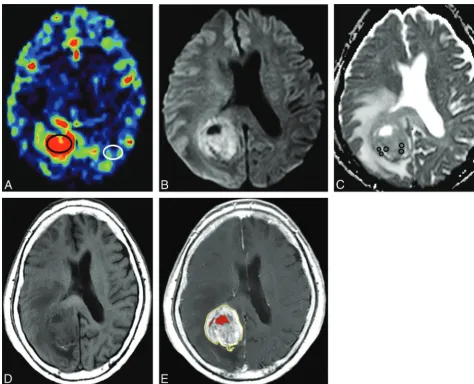
within the area that corresponded to the enhancing area on post-contrast T1WI, and the mean ADC value was obtained for each ROI (Fig 1B,-C).4,19,39Regions with relatively low ADC were
targeted, whereas blood vessels, calcifications, necrosis, and hem-orrhages were strictly avoided for ROI placement. The lowest and the average mean ADC values within all ROIs were determined as the minimum ADC and the mean ADC.
In addition, the largest cross-sectional necrosis area (NECarea)
and the percentage of nonenhancing area inside the largest cross-sectional enhancing lesion (%NEC) were identified by manually outlining both the inside and outside enhancing contour to de-termine the necrosis area. The enhancing area was carefully deter-mined with reference to both pre- and postcontrast T1WI (Fig 1D,-E). These determinations were performed by 1 author (K. Yamashita), followed by visual inspection by another neuroradi-ologist (O.T.). When multifocal lesions were noted, the maxi-mum enhancing lesion was targeted.
Each of the 6 parameters (aTBF, rTBF, ADCminimum, ADCmean, NECarea,
and %NEC) was compared between pa-tients with IDH1w and IDH1m and between patients with a methylated
MGMTpromoter and those with an un-methylated MGMTpromoter by using the Studentttest. APvalue⬍.05 was statistically significant. The perfor-mance in discriminating between pa-tients withIDH1wandIDH1mwas eval-uated by using receiver operating characteristic analysis. Area under the curve (AUC) values for the discrimina-tion were calculated for parameters that were statistically significant. Multivari-ate logistic regression analysis was per-formed to evaluate the combination of the parameters. AUC values were com-pared with each other by using a non-parametric approach.40 All statistical
analyses were performed by using JMP 11 Pro software (SAS Institute, Cary, North Carolina).
RESULTS
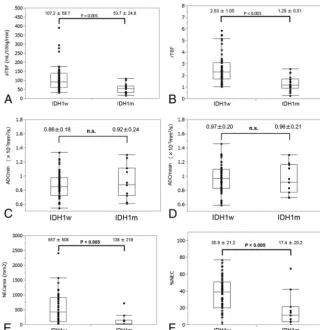
aTBF, rTBF, NECarea, and %NEC were
significantly higher in patients with
IDH1w (mean aTBF ⫽ 107.2 ⫾ 58.7 mL/100 g/min, mean rTBF ⫽ 2.53⫾ 1.05, mean NECarea⫽557⫾508 mm2,
and mean %NEC ⫽35.9% ⫾21.2%) than in those withIDHm(mean aTBF⫽ 53.7⫾24.8 mL/100 g/min, mean rTBF⫽1.29⫾0.51, mean NECarea⫽138⫾218 mm2, and mean %NEC⫽17.4%⫾20.2%)
(P⬍.05 each,Fig 2). In contrast, no significant differences were found in ADCminimum (ADCminimum ⫽ 0.86 ⫾ 0.18 ⫻
10⫺3mm2/s; range, 0.54 –1.33⫻10⫺3mm2/s inIDH1w, 0.92⫾
0.24⫻10⫺3mm2/s; range, 0.61–1.30⫻10⫺3mm2/s inIDH1m)
and ADCmean(ADCmean⫽0.97⫾0.20⫻10⫺
3mm2/s; range,
0.59 –1.46⫻10⫺3mm2/s inIDH1w, 0.96⫾0.21⫻10⫺3mm2/s;
range, 0.69 –1.30⫻10⫺3mm2/s inIDH1m) (P⬎.05 each).
No significant differences were observed in any parameters between patients with a methylatedMGMTpromoter and those with an unmethylatedMGMTpromoter (Table).
The optimal cutoff value was 70.0 mL/100 g/min for aTBF with 76.5% sensitivity, 88.9% specificity, and 79.1% accuracy. For rTBF, the optimal cutoff value was 1.55 with 88.2% sensitivity, 77.8% specificity, and 86.0% accuracy. For %NEC, the optimal cutoff value was 22.5 with 72.7% sensitivity, 81.8% specificity, and 74.2% accuracy. For NECarea, the optimal cutoff value was
151 mm2with 72.7% sensitivity, 81.8% specificity, and 74.2%
accuracy. The AUCs for aTBF, rTBF, %NEC, and NECareawere
0.850, 0.873, 0.739, and 0.772, respectively (Fig 3). No significant difference in AUC values was found among aTBF, rTBF, %NEC, and NECarea. The combination of the 4 parameters increased the
diagnostic performance (AUC⫽0.915). The AUC value was
[image:4.594.54.375.45.375.2]nificantly higher with the combination of all parameters than with NECareaor %NEC alone (P⬍.05).
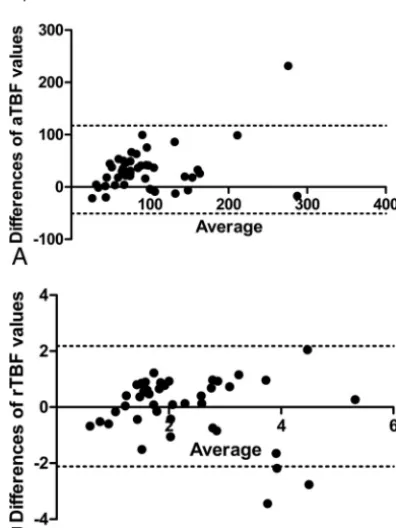
Bland-Altman analysis resulted in a mean bias of 33.4 with 95% limits of agreement in differences versus the average of the aTBF values, which ranged from⫺50.7 to 117.6, and 0.03 with
95% limits of agreement in differences versus the average of the rTBF values, which ranged from⫺2.12 to 2.18 (Fig 4). The intraclass correlation coefficient was 0.861 (95% confidence interval, 0.743– 0.925) for aTBF and 0.745 (95% confidence interval, 0.530 – 0.862) for rTBF, which indicated a high correla-tion. For the Spearman rank correlation coefficient, good correlation was shown for both aTBF (⫽0.774,
P⬍.01) and rTBF (⫽0.709,P⬍.01) for the values between the 2 neuroradiologists.
Figures 5 and 6 show representative cases of IDH1w and
IDH1m, respectively.
DISCUSSION
Our study demonstrated that both aTBF and rTBF were signifi-cantly higher in patients withIDH1wthan in those withIDH1m. Microvascular proliferation is induced by the vascular endothelial growth factor, which shows markedly higher expression in pri-mary than secondary GBMs.41Diehn et al1suggested that
vascu-lar endothelial growth factor production is associated with angio-genesis and contrast enhancement. The relationship between vascular endothelial growth factor andIDH1remains uncertain. However, these results suggested that a correlation may exist be-tween tumor vascularity andIDH1mutation status. In addition, a previous study by using ASL showed that high TBF in GBM is associated with poor overall survival.42ASL measurements may
provide additional prognostic information.
In this study, both NECarea and %NEC were significantly
higher in patients withIDH1w than in those withIDH1m. In GBM, hypoxia-mediated activation of the coagulation system causes intravascular thrombosis, which further increases intratu-moral hypoxia and leads to abnormal endothelial cell prolifera-tion and tumor necrosis.43Previous studies demonstrated that
large areas of ischemic and/or pseudopalisading necrosis are more frequent in primary than in secondary GBMs,44and in patients
withIDH1wthan in those withIDH1m.25Carlson et al45
indi-cated that necrosis is associated with higher levels of vascular en-dothelial growth factor. Our results are in line with these previous reports.
We found that both TBF and the necrosis area in patients with
IDH1wwere significantly higher than in those withIDH1m. The AUC value was significantly higher with the combination of all 4 parameters (aTBF, rTBF, NECarea, and %NEC) than with NECarea
or %NEC alone. This is the first report to compare the perfor-mance of ASL, DWI, and gadolinium T1WI for predicting the
IDH1mutation status in GBM, to our knowledge. Our results suggested that the combination of TBF derived from ASL and measurement of the necrosis area may be a surrogate marker for predicting theIDH1mutation status. Noninvasive estimates of tumor vascularity (aTBF, rTBF) and necrosis (NECarea, %NEC)
may be useful for evaluating the prognosis of patients with GBM and theirIDH1mutation status. Patients withIDH1wandIDH1m
follow different clinical courses, and GBMs with these mutations are considered to be 2 distinct disease entities.46TBF and tumor
necrosis area measurements play supportive roles as predictors of
FIG 3. Receiver operating characteristic curves for discrimination be-tween patients withIDH1wand those withIDH1mwith the parameters aTBF, rTBF, NECarea, and %NEC. The AUC was significantly higher with the combination of all parameters than with NECareaor %NEC alone (P⬍.05).
FIG 4. Bland-Altman plots showing the interobserver variability of the differences versus average of aTBF (A) and rTBF (B) values.Dashed linesrepresent the 95% limits of agreement.
Comparison between 6 parameters andMGMTmethylation status
Methylated Unmethylated PValue aTBF (mL/100 g/min) 100.4⫾1.13 (n⫽19) 99.4⫾55.4 (n⫽15) .96
rTBF 2.54⫾1.31 (n⫽19) 2.35⫾0.81 (n⫽15) .62
ADCminimum(⫻103mm2/s) 0.88⫾0.19 (n⫽24) 0.84⫾0.20 (n⫽21) .57 ADCmean(⫻103mm2/s) 0.97⫾0.19 (n⫽24) 0.96⫾0.21 (n⫽21) .92
NECarea(mm2) 503⫾424 (n⫽25) 621⫾430 (n⫽21) .36
[image:5.594.70.268.357.621.2]the response to current treatment and tumor aggressiveness. These measurements may provide important information for se-lecting more or less intensive treatment.
With ADC measurement, no significant difference was found between patients with IDH1w and those with IDH1m in our study. Lee et al47showed that the mean ADC value in patients with IDH1mwas significantly higher than that in those withIDH1w. This difference may be attributed to patient selection. TheIDH1m
group had a significantly higher proportion of anaplastic astrocy-toma than theIDH1wgroup in their study. In our study, only patients with GBM were included. Lazovic et al48found no
signif-icant differences in ADC in nonnecrotic tumor regions between patients withIDH1wand those withIDH1m. On the basis of a radiologic-pathologic correlation study, no significant correla-tion between the Ki-67 labeling index and minimum ADC was noted for the GBM group.19Our results are consistent with those
in the literature.
IDH1mandMGMTpromotor methylation are related to a better clinical prognosis.21-23,27-29A selective inhibitor of mutant
IDH1has been proved to delay glioma growth.26Patients with
GBM withMGMTpromotor methylation are more sensitive to temozolomide therapy and are associated with a favorable out-come.27-29 Noninvasive prediction of IDH1 mutation and MGMTpromotor methylation could contribute to the develop-ment of treatdevelop-ment strategies such as further targeted therapy. No significant differences were observed in any parameters derived from MR imaging between patients with a methylatedMGMT
promoter and those with an unmethylatedMGMT promoter. Carrillo et al29indicated that the methylation status does not
cor-relate with any imaging features (size, enhancement, noncontrast enhancing tumor, necrosis, edema, cysts, and location). The group of patients with an unmethylated MGMT promoter showed a significant difference in mean rCBV between pseudo-progression and real pseudo-progression, though the group with a meth-ylatedMGMTpromoter showed no significant difference in an-other study.49 These results suggest that predicting MGMT
promoter methylation status from MR imaging may be challenging.29
FIG 5. Contrast-enhanced T1WI (A), ADC map derived from DWI (B), and TBF map derived from ASL (C) of a 73-year-old woman withIDH1w. High aTBF (96.2 mL/100 g/min) and rTBF (2.78) were demonstrated in the enhancing tumor. The tumor also showed a high NECarea(518 mm
2
) and %NEC (44.2).
[image:6.594.54.530.47.225.2] [image:6.594.53.531.272.456.2]Our study has some limitations. First, as mentioned earlier, not all patients were studied with all 3 imaging modalities (ASL, DWI, and postcontrast T1WI). Some recurrent cases ofIDH1w
andIDH1mwere included in our study. The tumor sample was not acquired stereotactically before resection. However, a 3D MR image overlay navigation system and 5-aminolevulinic acid fluo-rescence-guided surgery were used to avoid necrotic or nonen-hancing tumor regions when obtaining the GBM sample. Finally, automated MR imaging volumetric quantification of tumor ne-crosis was not applied because we believe that both pre- and post-contrast T1WI are required to correctly determine the enhancing area.
CONCLUSIONS
Our results suggested that TBF calculated from ASL and tumor necrosis area derived from conventional MR imaging are useful for predicting theIDH1mutation status.
Disclosures: Koji Yamashita—RELATED:Grant: Japan Society for the Promotion of Science (Japanese grant) KAKENHI 26461828.* Akio Hiwatashi—UNRELATED:
Grants/Grants Pending: Japan Society for the Promotion of Science KAKENHI for MRI. *Money paid to the institution.
REFERENCES
1. Diehn M, Nardini C, Wang DS, et al.Identification of noninvasive imaging surrogates for brain tumor gene-expression modules.Proc Natl Acad Sci U S A2008;105:5213–18CrossRef Medline
2. Henson JW, Gaviani P, Gonzalez RG.MRI in treatment of adult gliomas.Lancet Oncol2005;6:167–75CrossRef Medline
3. Hakyemez B, Erdogan C, Bolca N, et al.Evaluation of different cere-bral mass lesions by perfusion-weighted MR imaging.J Magn Reson Imaging2006;24:817–24CrossRef Medline
4. Calli C, Kitis O, Yunten N, et al.Perfusion and diffusion MR imaging in enhancing malignant cerebral tumors.Eur J Radiol2006;58:394 – 403CrossRef Medline
5. Yamasaki F, Kurisu K, Satoh K, et al.Apparent diffusion coefficient of human brain tumors at MR imaging.Radiology2005;235:985–91
CrossRef Medline
6. Weber MA, Zoubaa S, Schlieter M, et al.Diagnostic performance of spectroscopic and perfusion MRI for distinction of brain tumors.
Neurology2006;66:1899 –906CrossRef Medline
7. Yamashita K, Yoshiura T, Hiwatashi A, et al.Differentiating primary CNS lymphoma from glioblastoma multiforme: assessment using arterial spin labeling, diffusion-weighted imaging, and18 F-fluoro-deoxyglucose positron emission tomography.Neuroradiology2013; 55:135– 43CrossRef Medline
8. Warmuth C, Gunther M, Zimmer C.Quantification of blood flow in brain tumors: comparison of arterial spin labeling and dynamic susceptibility-weighted contrast-enhanced MR imaging.Radiology
2003;228:523–32CrossRef Medline
9. Alsop DC, Detre JA, Grossman M.Assessment of cerebral blood flow in Alzheimer’s disease by spin-labeled magnetic resonance im-aging.Ann Neurol2000;47:93–100CrossRef Medline
10. Chalela JA, Alsop DC, Gonzalez-Atavales JB, et al.Magnetic reso-nance perfusion imaging in acute ischemic stroke using continuous arterial spin labeling.Stroke2000;31:680 – 87CrossRef Medline
11. Detre JA, Alsop DC, Vives LR, et al.Noninvasive MRI evaluation of cerebral blood flow in cerebrovascular disease.Neurology1998;50: 633– 41CrossRef Medline
12. Noguchi T, Yoshiura T, Hiwatashi A, et al.Perfusion imaging of brain tumors using arterial spin-labeling: correlation with histo-pathologic vascular density.AJNR Am J Neuroradiol2008;29:688 –93
CrossRef Medline
13. Yoshiura T, Hiwatashi A, Noguchi T, et al.Arterial spin labelling at
3-T MR imaging for detection of individuals with Alzheimer’s dis-ease.Eur Radiol2009;19:2819 –25CrossRef Medline
14. Tourdias T, Rodrigo S, Oppenheim C, et al.Pulsed arterial spin la-beling applications in brain tumors: practical review.J Neuroradiol
2008;35:79 – 89CrossRef Medline
15. Kim HS, Kim SY.A prospective study on the added value of pulsed arterial spin-labeling and apparent diffusion coefficients in the grading of gliomas. AJNR Am J Neuroradiol 2007;28:1693–99
CrossRef Medline
16. Kono K, Inoue Y, Nakayama K, et al.The role of diffusion-weighted imaging in patients with brain tumors.AJNR Am J Neuroradiol
2001;22:1081– 88Medline
17. Provenzale JM, Mukundan S, Barboriak DP.Diffusion-weighted and perfusion MR imaging for brain tumor characterization and assess-ment of treatassess-ment response.Radiology2006;239:632– 49CrossRef Medline
18. Tien RD, Felsberg GJ, Friedman H, et al.MR imaging of high-grade cerebral gliomas: value of diffusion-weighted echoplanar pulse se-quences.AJR Am J Roentgenol1994;162:671–77CrossRef Medline
19. Higano S, Yun X, Kumabe T, et al.Malignant astrocytic tumors: clinical importance of apparent diffusion coefficient in prediction of grade and prognosis. Radiology 2006;241:839 – 46 CrossRef Medline
20. Ohgaki H, Kleihues P.Genetic pathways to primary and secondary glioblastoma.Am J Pathol2007;170:1445–53CrossRef Medline
21. Ichimura K, Pearson DM, Kocialkowski S, et al.IDH1 mutations are present in the majority of common adult gliomas but rare in pri-mary glioblastomas.Neuro Oncol2009;11:341– 47CrossRef Medline
22. Myung JK, Cho HJ, Park CK, et al.IDH1 mutation of gliomas with long-term survival analysis.Oncol Rep2012;28:1639 – 44Medline
23. Ducray F, Marie Y, Sanson M.IDH1 and IDH2 mutations in glio-mas.N Engl J Med2009;360:2248 – 49; author reply 2249Medline
24. Parsons DW, Jones S, Zhang X, et al.An integrated genomic analysis of human glioblastoma multiforme. Science 2008;321:1807–12
CrossRef Medline
25. Nobusawa S, Watanabe T, Kleihues P, et al.IDH1 mutations as mo-lecular signature and predictive factor of secondary glioblastomas.
Clin Cancer Res2009;15:6002– 07CrossRef Medline
26. Rohle D, Popovici-Muller J, Palaskas N, et al.An inhibitor of mutant IDH1 delays growth and promotes differentiation of glioma cells.
Science2013;340:626 –30CrossRef Medline
27. Kreth S, Thon N, Eigenbrod S, et al.O-methylguanine-DNA meth-yltransferase (MGMT) mRNA expression predicts outcome in ma-lignant glioma independent of MGMT promoter methylation.PLoS One2011;6:e17156CrossRef Medline
28. Hegi ME, Liu L, Herman JG, et al.Correlation of O6-methylguanine methyltransferase (MGMT) promoter methylation with clinical outcomes in glioblastoma and clinical strategies to modulate MGMT activity.J Clin Oncol2008;26:4189 –99CrossRef Medline
29. Carrillo JA, Lai A, Nghiemphu PL, et al.Relationship between tumor enhancement, edema, IDH1 mutational status, MGMT promoter methylation, and survival in glioblastoma.AJNR Am J Neuroradiol
2012;33:1349 –55CrossRef Medline
30. Petersen ET, Lim T, Golay X.Model-free arterial spin labeling quan-tification approach for perfusion MRI.Magn Reson Med2006;55: 219 –32CrossRef Medline
31. Ma X, Yoshimoto K, Guan Y, et al.Associations between microRNA expression and mesenchymal marker gene expression in glioblas-toma.Neuro Oncol2012;14:1153– 62CrossRef Medline
32. Fuller GN, Hess KR, Rhee CH, et al.Molecular classification of hu-man diffuse gliomas by multidimensional scaling analysis of gene expression profiles parallels morphology-based classification, cor-relates with survival, and reveals clinically-relevant novel glioma subsets.Brain Pathol2002;12:108 –16CrossRef Medline
33. Esteller M, Garcia-Foncillas J, Andion E, et al.Inactivation of the DNA-repair gene MGMT and the clinical response of gliomas to alkylating agents.N Engl J Med2000;343:1350 –54CrossRef Medline
as-sessment of MGMT immunohistochemical expression in glioblas-toma tissue.Brain Tumor Pathol2011;28:25–31CrossRef Medline
35. Yamashita K, Yoshiura T, Hiwatashi A, et al.Arterial spin labeling of hemangioblastoma: differentiation from metastatic brain tumors based on quantitative blood flow measurement.Neuroradiology
2012;54:809 –13CrossRef Medline
36. Lehmann P, Monet P, de Marco G, et al.A comparative study of perfusion measurement in brain tumours at 3 Tesla MR: arterial spin labeling versus dynamic susceptibility contrast-enhanced MRI.Eur Neurol2010;64:21–26CrossRef Medline
37. Lo¨bel U, Sedlacik J, Reddick WE, et al.Quantitative diffusion-weighted and dynamic susceptibility-diffusion-weighted contrast-enhanced perfusion MR imaging analysis of T2 hypointense lesion compo-nents in pediatric diffuse intrinsic pontine glioma.AJNR Am J Neu-roradiol2011;32:315–22CrossRef Medline
38. Loeber RT, Sherwood AR, Renshaw PF, et al.Differences in cerebel-lar blood volume in schizophrenia and bipocerebel-lar disorder.Schizophr Res1999;37:81– 89CrossRef Medline
39. Sugahara T, Korogi Y, Kochi M, et al.Usefulness of diffusion-weighted MRI with echo-planar technique in the evaluation of cellularity in gliomas.J Magn Reson Imaging1999;9:53– 60Medline
40. DeLong ER, DeLong DM, Clarke-Pearson DL.Comparing the areas under two or more correlated receiver operating characteristic curves: a nonparametric approach. Biometrics 1988;44:837– 45
CrossRef Medline
41. Godard S, Getz G, Delorenzi M, et al.Classification of human astro-cytic gliomas on the basis of gene expression: a correlated group of genes with angiogenic activity emerges as a strong predictor of sub-types.Cancer Res2003;63:6613–25Medline
42. Farace P, Amelio D, Ricciardi GK, et al.Early MRI changes in glio-blastoma in the period between surgery and adjuvant therapy.
J Neurooncol2013;111:177– 85CrossRef Medline
43. Ohgaki H, Kleihues P.The definition of primary and secondary gli-oblastoma.Clin Cancer Res2013;19:764 –72CrossRef Medline
44. Homma T, Fukushima T, Vaccarella S, et al.Correlation among pa-thology, genotype, and patient outcomes in glioblastoma.J Neuro-pathol Exp Neurol2006;65:846 –54CrossRef Medline
45. Carlson MR, Pope WB, Horvath S, et al.Relationship between sur-vival and edema in malignant gliomas: role of vascular endothelial growth factor and neuronal pentraxin 2.Clin Cancer Res2007;13: 2592–98CrossRef Medline
46. Lai A, Kharbanda S, Pope WB, et al.Evidence for sequenced molec-ular evolution of IDH1 mutant glioblastoma from a distinct cell of origin.J Clin Oncol2011;29:4482–90CrossRef Medline
47. Lee S, Choi SH, Ryoo I, et al.Evaluation of the microenvironmental heterogeneity in high-grade gliomas with IDH1/2 gene mutation using histogram analysis of diffusion-weighted imaging and dy-namic-susceptibility contrast perfusion imaging. J Neurooncol
2015;121:141–50CrossRef Medline
48. Lazovic J, Soto H, Piccioni D, et al.Detection of 2-hydroxyglutaric acid in vivo by proton magnetic resonance spectroscopy in U87 gli-oma cells overexpressing isocitrate dehydrogenase-1 mutation.
Neuro Oncol2012;14:1465–72CrossRef Medline

![Di μ chloro bis[bis(ethane 1,2 diamine κ2N,N′)manganese(II)] dichloride](data:image/gif;base64,R0lGODlhAQABAIAAAP///wAAACH5BAEAAAAALAAAAAABAAEAAAICRAEAOw==)