cosc
460Honours Project Report
Department of Computer Science University of Canterbury
ECSTASY
An Object Oriented Graphics System
l.
2.
3.
4.
Table of Contents
Introduction • . 1
3
5 5 7 8 Hardware . .
Class Plot environment . . . • . . . .
3.1 The Bit Map. • • • • . • . . . .
3.1.1 Internal Bit Map Representation . . . .
3.1.2 Storage Limitations • . . .
3.1.3 Implementation Overheads • • • 9
3.2 Drawing Routines. . . • . . • . . . . • . 10
3.2.1 Bit Map Manipulation. . . . . . • • . 11
3.2.2 T e x t . . . . . . . . . . 12
Class Animation . • .
. . .
. . . 14. . . 14 4.1
4.2
4.3
Geometric Transformations .
4.1.1 Rotation . . . .
4 .1. 2 4 .1. 3
Translation • .
Scaling. . . .
Picture Representation . .
4.2.1 Drawing . • . . .
4.2.2 Geometric Transformations . .
Picture Elements . . . • . .
4.3.1 Circles. • .
Drawing .
Scaling.
. . 15
. . . 15
. . 16 • • • • 1 7 • • • • 19 . • 19 • 20 . . . 21 . . . . 21
Rotation and Translation • .
4.3.2
4.3.1.1
4.3.1.2
4.3.1.3
Points .
. . .
.
.
.
. . .
• 22
. 22
. 23
4.3.3 Polygons . • . . . . • • . . . 24
4.3.3.1 Drawing . . • . . . . 26
Appendix I
-
ECSTASY System Users Guide.Appendix II - ECSTASY System Source Code Listing.
Appendix III
-
Display Routines.Appendix IV - Character Codes.
l. Introduction
The purpose of this report is to describe the design and
implementation of a simple two dimensional drawing system for
use from within the Computer Science Department's DG SIMULA
implementation. This includes a description of the
capabilities provided by the system, its limitations and
scope for future development. Appropriate user documentation,
source code listings and graphics examples are given as
appendices. They provide a users as well as a designers
perspective on the graphics package and these will be
referenced throughout. The system described in this report
has been dubbed the ECSTASY Graphics System and shall be
referred to as such from here onwards.
The main tasks of a graphics system such as this are to
provide facilities for the construction of object
representations and the generation of pictures from their
descriptions. This also includes the ability to transform and
manipulate such objects and the pictures which they form. The
major design decisions thus centre around the internal
representation of the graphics objects in the computer system
and the transformation of that data into a corresponding
picture on a display surface.
Section 2 gives a brief description of the hardware that
was available for the development of the ECSTASY system.
Section 3 centres on the class plot_environment (see the
The remainder of the ECSTASY software is to be found in
class animation (see appendix II) which is discussed in
section 4. This class contains the facilities which enable a
user to define and manipulate graphics objects at an abstract
level so leaving the details of internal object
representation, manipulation and picture construction to the
system. It is the design decisions involved in these areas
which are discussed in this section.
A discussion on the concerns involved in the production of
the final picture displays via device dependent display
routines is given in section 5. This is followed by a summary
and conclusion, after which it is hoped the reader will have
a genuine understanding of the underlying ideas embodied in
2. Hardware
The Computer Science Department's SIMULA implementation is
on a DG Eclipse S/130 Computer. The peripheral devices
connected to this machine include a Televideo 920 terminal, a
DG Dasher printer and a nine track tape drive.
Neither the printer nor the terminal are suitable for high
quality graphics display and this prevents any adequate
development of an interactive graphics environment.
None-the-less, the ECSTASY graphics system described here has
been designed with an interactive application in mind in
anticipation of the availability of a graphics terminal at
some stage in the future. It should be easily interfaced into
a complete, interactive graphics environment with a minimum
of difficulty.
The only readily accessible, good quality plotter
available during the course of this project was the Computer
Centre's Printronix printer. When in plot mode this printer
has a resolution of 792 by 792 overlapping dots per page and
is consequently the device around which this project has been built.
Due to the nature of the Printronix the orientation with
respect to picture production has centred on the construction
of a bit map to represent dot matrix devices. Another example
of this is the Televideo terminal which has been used as a 79
by 21 sized dot matrix (the number of columns by the number
The characteristics of the
Printronix
are such that eachline of characters sent to the printer is treated on a dot
row basis if the plot mode code (005 base 8) is sent either
preceeding or following the string of plot data characters.
Line feed commands associated with such rows will only
advance the paper a single dot row space. Unfortunately, the
printer cannot mix normal characters with plot data in the
same line so making it necessary to print them under software
control, hence the provision of the text facility discussed
in section 3.2.2.
The low order six bits of every character sent on a plot
data line represent six horizontal dots of the Printronix's
matrix. It must be remembered, though, that the dots are
printed in reverse order of this bit string representation, a
fact reflected in the display routine for the Printronix (see
3. Class Plot Environment
The declarations and routines within this class constitute
the basic kernel of drawing routines for the ECSTASY system.
They are based on the specifications provided by the Core
Graphics System (see reference [21) with appropriate
additions and alterations.
3.1 The Bit Map
The type of output devices towards which the ECSTASY
graphics system is oriented are those that have a dot matrix
representation. This design decision is naturally influenced
by the properties of the mairi device available for use with
the system, namely, the Printronix printer. Also, it is
probable that this will be the predominant technology in
future display devices and should thus be catered for.
In order to produce plot files for dot matrix oriented
devices it makes sense, then, to have some internal
representation for this matrix within the computer1 an
application for which a bit map is ideally suited. Each bit
in the map can then have an 'on' and an 'off' representation,
the status of which depends on whether the corresponding
point on the display surface of the output device is to be
made visible or not. The system drawing routines need only
It is, of course, desirable for any graphics system to be
entirely device independent and to this end any dot matrix
device can be made known to the system in order to have
output produced for it. By knowing the size of each device,
SIMULA's dynamic array declaration facility can then be used
to declare a bit map of the appropriate size.
A minor problem was encountered in using this facility as
an array declaration could not be made after a call to the
initialisation procedure get_device. This procedure queries
the user about the output device so that its size can be be
determined. The problem was overcome by using a call to
function y_dev_sze as the upper bound of the first subscript
in the array declaration. Besides calling procedure
get_device and returning the device size, this function also
sets the default 'window', '~iewport' and character size
settings for the system (see appendix I). This eliminates any
need for an action section in class plot environment apart
3.1.1 Internal Bit Map Representation
In theory, the most desirable implementation of a bit map
would be a "packed array of boolean", but in SIMULA this is
unfortunately not possible. The obvious space savings
associated with such a representation should, however, be
attempted to be emulated, especially when the small (64 KB)
address space available to an ECLIPSE user is considered. It
is for this reason that the bit map associated with the
ECSTASY system is represented by a two dimensional array of
integers, where the low order thirty bits of each integer
represent thirty horizontal points of the dot matrix. The
number of integers then needed to represent a horizontal row
of the dot matrix is:
number of dots per row - l ) div 30 + 1,
although it must be remembered that all the thirty bits in
the last integer for the row may not be used.
The characteristics of the Printronix printer require the
extraction of information from the bit map in six bit units
(see section 2). This task is greatly simplified when a
multiple of six bits per integer is used, hence the value
thirty; the largest such multiple less than the total number of bits per integer.
While this decision was made with device characteristics
in mind, little extra space is needed and calculation is made
3.1.2 Storage Limitations
The Printronix printer needs a 792 by 792 bit map which,
using the representation described above, requires 85536
bytes of storage. As a SIMULA user is restricted to a 64 KB
address space it is obviously infeasible to represent this
internally. Two solutions were considered for getting around
this difficulty. The first was to store the bit map
externally on disc, using a direct (random access} file,
rather than in memory. However, the speed at which such a
system would run would be unduly slow.
The only remaining option, then, was to decrease the size
of the bit map and this is the course that has been taken.
The smallest plottable unit is thus considered to consist of
a two by two square of plottable Printronix points. The
amount of storage required is immediately cut down to 21384
bytes, which is still large but certainly not unreasonable.
It should be noted that the size of the bit map for the
Printronix has been further reduced from this 396 by 396
representation to one of 390 by 360 points, although it is
for purely aesthetic reasons associated with the alignment of
paper in the printer.
The design decisions associated with the need to extract
information from the bit map in six bit units (discussed in
section 3.1.1} must now, of course, hold for three bit units.
Fortunately they do and no alterations need to be made,
although the form of the display routine for the Printronix
will be significantly different from what it otherwise would
3.1.3 Implementation Overheads
Considerable extra overheads are involved with the bit map
representation just described compared with, say, a "packed array of boolean" representation. This is made even more so
with the lack of any logical 'oring' and 'anding' facilities
on bit strings from within SIMULA.
In order to turn a particular bit 'on', the integer in
which it is located must first be identified. Its position in
this integer must then be checked to ensure that it is not
already 'on', by a process of integer and modulo division,
before the appropriate power of two can be added to the
integer to effect the switching on of the bit. Similar
manipulation of the integers is required by the display
routines, discussed in section 5, when they interprete the
3.2 Drawing Routines
To facilitate the drawing of pictures via the construction
of a bit map a subset of the Core Graphics System developed
by the ACM/SIGGRAPH Graphics Standards Planning Committee has
been implemented. Functional descriptions of the implemented
routines can be found in appendix I The ECSTASY System
Users Guide - as they are available to the user to construct
pictures directly, without using the animation system
facilities discussed in section 4. Extensive documentation of the Core Graphics System can also be found in reference [2],
eliminating the need to discuss the routines in any more
detail here other than to state what is provided:
( i) window
(ii) view_port
(iii) line abs
(iv) line rel
(v) mark abs
(vi) mark rel
(vii) move abs
(viii) move rel
( ix) reset
(x) send
The reset and send routines are not specific Core routines
but are necessary for this application and are among those
callable by the user.
The Core System also provides facilities for text
production and the routines provided for this by the ECSTASY
system are outlined in the Users Guide. Section 3.2.2 of
this report is, however, also devoted to this subject because
3.2.1 Bit Map Manipulation
Additional to the Core System routines are those that are
invoked by them to perform the actual bit map manipulation.
These routines are at a lower level than the Core routines
and are not callable by the user.
At the user level, all pictures are defined within a world
coordinate domain and this must eventually be mapped to the
device domain. The procedure map_to_device performs this
function for a point. It takes the x and y coordinates of the
point in the world domain as parameters, performs the
necessary windowing and viewport transformations, and returns
the device domain coordinates, albeit still in real units.
The drawing of lines at the device coordinate level is
performed by the procedure join which in turn calls the
lowest level routine in the system, procedure plot. This
last routine truncates the real device coordinates given to
it and turns on the appropriate bit in the map.
The truncation of the real device coordinates means that
any device coordinate lying in the range [1, device_size+l)
will be plotted. No action is taken for points outside this
domain, which are suppressed. This windowing on a point
basis has been chosen for its sheer simplicity and yet equal
3.2.2 Text
Because text and graphics cannot be adequately mixed on
the Printronix printer there is a need to provide a text
facility along the lines of that outlined in the Core
Graphics System. The facility provided by the ECSTASY system
is oriented towards the Printronix and provides facilities
for text scaling and various directions of writing for all
the printable characters. The ECSTASY System Users Guide
(Appendix I) outlines these capabilities in greater detail.
Each character is represented by a sequence of drawing and
moving instructions stored in the direct file charcodes (see
appendix IV). An associated program getchar (listed in
appendix IV) is used to input these instructions for each
character. The use of this program and the meanings of the
character codes are outlined in appendix I. It should be
pointed out, however, that the character drawing instructions
are in terms of Printronix device coordinates and so may not
be applicable for other devices. This is especially true for
those with a much higher or lower dot matrix resolution than
the Printronix. The unit character size may then be either
too small or too large to be considered suitable.
The aesthetic appeal of the characters produced by this
text facility is not particular high, and actually
deteriorates with each increase in text size. For unit sized
characters the problem is largely due to the doubling up of
the dimensions of plottable points as discussed in section
3.1.2. Thus, while the coded character representations are in
terms of a seven by five dot matrix, the same as standard
Printronix characters, they actually end up twice as high and
negated by the doubling up of point sizes, resulting in
sharper edges and less smooth slanting lines.
For all the character sizes the problems are further
compounded by the inadequacy of our SIMULA implementation
having to simulate floating point arithmetic because of the
lack of a floating point unit on the ECLIPSE. The attempted
addition of 1.0 to another floating point number actually
results in 0.999 being added. This affects the length of
lines drawn and is especially marked when text scaling is
performed.
For example, the drawing of
(5.0, 8.0) should result in device
a line from (5.0, 6.0) to
coordinates (5.0, 6.0),
(5.0, 7.0) and (5.0, 8.0) being plotted, where an addition of
1.0 is made to the y coordinate in each step. They
coordinates actually calculated are 6.0, 6.999 and 7.998.
This results in coordinate (5.0, 6.0) being plotted twice and
(5.0, 7.0) once, so producing a line of length two rather
than three.
This is a problem which can potentially affect all areas
of the graphics system but no attempt has been made to try
and 'patch' this situation from within the system. Rather,
the assembly routines used by SIMULA to perform floating
point arithmetic need to be rewritten in order to perform
4. Class Animation
Prefixed with class plot_environment this class provides
the facilities for a user, to define and manipulate pictures
and the objects which constitute them at an abstract level.
4.1 Geometric Transformations
Three coordinate transformations have been implemented in
the ECSTASY system. They are:
(i) Rotation
(ii) Translation
(iii) Scaling
By invoking the appropriate routines any object, including
a complete picture, can be subjected to the above
transformations to create a new, distinct object instance.
The routines involved are all implemented as function
procedures which return a reference to the new object, so
leaving the original object unchanged. The reference variable
for the original object can, of course, be assigned to the
newly created instance to achieve the same result as a
transformation applied directly to the original.
These three transformations are all bijective mappings
from the two dimensional world coordinate space onto itself
and preserve the given incidence relations between the points
of an object or picture (e.g relations of the kind "one line
4.1.1 Rotation
Rotation within the XY-coordinate system requires three
necessary items of information:
(i) the angle of rotation, counter-clockwise
(ii) the x coordinate of the point of rotation
(iii) they coordinate of the point of rotation
The routines that perform this transformation on the
various types of objects require this information to be
passed to them via their parameters. The geometric relations
between the original XY-system and the system X'Y' obtained
after the rotation by the angle a are:
x'
=
x.cos(a) + y.sin(a)y'
=
-x.sin(a) + y.cos(a)4.1.2 Translation
Translation of a point is performed by adding a positive
or negative constant to each coordinate of the point. The two
4.1.3 Scaling
Scaling of a point is performed by the multiplication of a
constant to each coordinate of the point. The x and y scaling
factors are required as parameters to the routines which
perform this transformation.
If the scaling factor in the x or y direction is less than
one then the object generated from the scaling will be
compressed in that direction compared with the original.
Similarly, if the scaling factor is greater than one then the object will be stretched.
While not only creating an object of different size,
scaling will usually cause the new object to be at a
different position relative to the origin than the original.
For example, scaling a point at position (10, 10) by a factor
of two in the x and y directions will cause the new point to
occur at position (20, 20). If the origin is an interior
point of the object, however, this associated shift will not
occur i.e. a point a (0, 0) will always give rise to another
4.2 Picture Representation
The most important design decision that has had to be made
in the development of the ECSTASY system is the internal
computer representation of complete pictures and the elements
which comprise them. Every picture consists of one or more
picture elements which in turn may consist of further
distinct elements, down to the lowest, or primitive level.
The chosen representation must reflect this hierarchical
nature of picture structure.
The SIMULA programming language offers two facilities to
aid in the construction of such hierarchical structures:
(i) class concatenation
(ii) SIMSET linked list facility
Both these facilities have been used to design a simple, yet
effective and flexible, picture representation scheme.
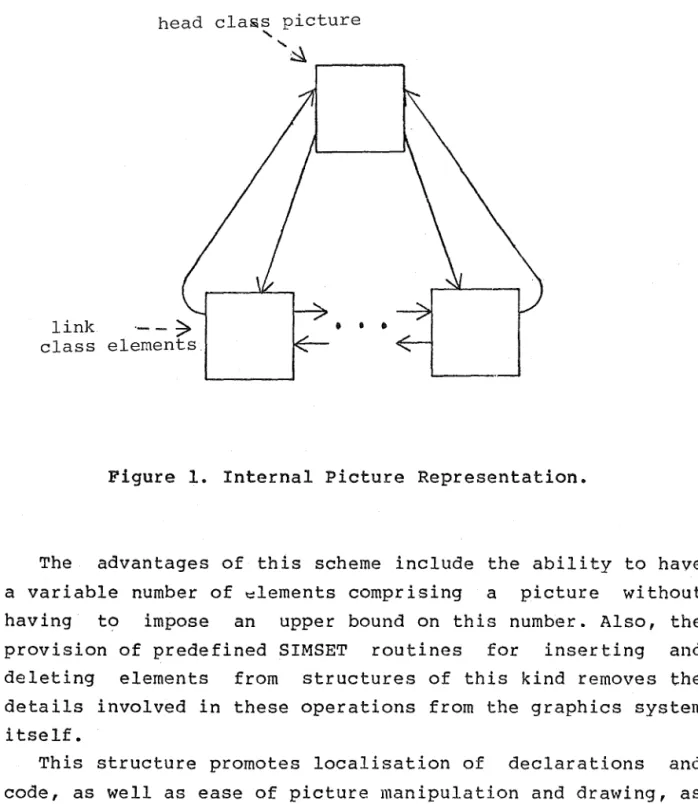
At the top level of the hierarchy there is the need, using
SIMULA's class mechanism, to enable reference variables of
the appropriate type to refer to an object representing a
complete picture. To this end the class type
prefixed by the predefined SIMSET class head,
picture,
has been
defined. This enables objects of this type to be the root of
any hierarchical structure. Those elements which comprise a
picture at the next level of abstraction can then be
associated with the particular picture object through their
membership of the linked list of which it is the head. This
head cla~s picture
'
link ·- - ~
class elements
... ~
...---.
•
•
•
Figure 1. Internal Picture Representation.
The advantages of this scheme include the ability to have
a variable number of ~lements comprising a picture without
having to impose an upper bound on this number. Also, the
provision of predefined SIMSET routines for inserting and
deleting elements from structures of this kind removes the
details involved in these operations from the graphics system
itself.
This structure promotes localisation of declarations and
code, as well as ease of picture manipulation and drawing, as
4.2.1 Drawing
The drawing of a complete picture simply involves
accessing each element which comprises it and invoking the
drawing routine local to this element. Section 4.3 will
outline this in more detail.
4.2.2 Geometric Transformations
The structures of the routines to perform the available
transformations are basically the same. A new picture object
is first created to be the head of the newly generated
picture. Each element comprising the original is then
accessed and the transformation routine local to it invoked.
The new element created from this procedure is then entered
into the linked list for the new picture.
As a uniform transformation is applied to each element of
the original picture, the new picture instance will represent
4.3 Picture Elements
So far, the element objects which comprise a picture have
been referred to as if they were all of the same kind. This is, of course, not necessarily the case, as pictures in the
ECSTASY system can be comprised of points, polygons, lines
and circles. Needless to say, distinct class declarations
are required for these various kinds of elements due to their
differing representations and drawing and transformation
requirements.
However, at the level of picture manipulation discussed in
section 4.2 it is necessary to be able to refer to these
distinct elements as if they were the same. This can be
achieved by using SIMULA's class concatenation facility to
prefix the class declarations of the various element types
with a common super-class, namely, class element. This then
enables reference variables with qualification element to
refer to any instance of the various element objects.
Since all elements can be drawn, rotated etc. it is at the
element level that these notions are introduced. However, the
actual mechanics of these operations depend entirely on the
nature of the sub-class and cannot, therefore, be defined at
this level, hence the VIRTUAL procedure declarations within
this class. Class element must, of course, also be prefixed
by the predefined SIMSET class link to enable any element to
become a member of a linked list associated with a picture.
The next sections of this report outline the
representations and associated routines of the various
4.3.l Circles
A circle can be precisely defined in world coordinate
space by the specification of a centre point and a radius.
Also associated with objects of this type are two variables,
x_scale_factor and y_scale_factor, the functions of which are
discussed in section 4.3.1.2.
4.3.1.l Drawing
When drawing a circle, each individual point on the
circumference must have its position calculated in order for
it to be marked on the bit map. To ensure that none of these
points are missed out the angle used in calculating the
position of successive points must be
sufficiently small amounts each time.
incremented by
This increment, however, need only be as precise as the
output device is in representing curved lines, a feature
dependent on the resolution of its dot matrix. Consequently,
the expression for the increment involves the size of the dot
matrix for the output device in the x direction (which is
usually larger than in the y direction). Such a device
dependent increment prevents the need for substantial extra
calculation when constructing circles for the Televideo
4.3.1.2 Scaling
When scaling is applied to a circle with differing scale
factors in the x and y directions the object created is an
ellipse. The variables x scale factor and y_scale_factor
associated with
keep track of
each circle object are consequently used to
the amount of scaling done in the two
directions. Then, when the drawing routine for the circle is
invoked, these variables will be used to modify the positions
of the points that would otherwise have been calculated as
lying on the circumference· of a circle rather than an
ellipse.
It should be noted that these variables are always
initialised to one at the creation of each new circle object
but can be changed by the user in order to generate an
ellipse rather than a circle. A severe limitation of this
feature, however, is the inability of ellipses to be
elongated in any directions other than horizontal or
vertical. Even a rotation, while shifting the centre point of
an ellipse, will not change its orientation.
4.3.1.3 Rotation and Translation
Both these geometric transformations applied to a circle
will result in an object of the same dimensions (and
orientation in the case of an ellipse) but with a different
centre point from the original, determined by the
4.3.2 Points
A point can be precisely defined by its x and y
coordinates in the world domain. The geometric transformation
routines qan all be applied to the specified x and y
4.3.3 Polygons
Any closed shape in two dimensions that consists of a set
of concatenated vectors, or straight-line segments, is a
polygon. An infinite number of shapes is covered by this
description and any system designed to represent polygons
must be flexible enough to cater for them all~ an aim which
can only be achieved by the implementation of a dynamic
polygon representation.
This description of polygons is in terms of vectors;
however, a vector .can be· defined by specifying only one
point, its end point, whereas its start position is given by
the current world coordinate position indicator (which may be
at the end of the previously defined vector). The definition
of a polygon is made much more economical and concise by
simply specifying the world coordinate positions of its
vertices (or vector end points) and this is the approach
taken here.
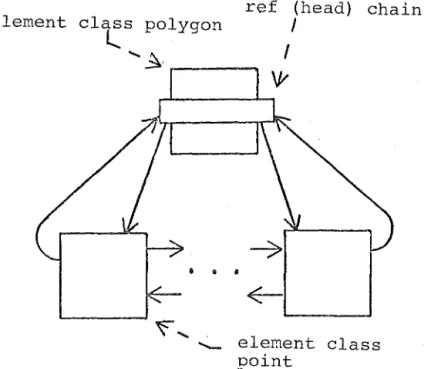
What is required then is a dynamic structure for storing
the variable number of points needed to adequately define any
particular polygon~ an application which lends itself to the
use of the SIMSET facility in exactly the same way as used in
representing pictures. The only differences in this case are
the homogeneous nature of the elements that comprise the
linked list, compared with a picture, and the use of a
variable of type ref (head) that is local to the class
declaration. This variable is necessary as the polygon class
declaration is already prefixed by element and so cannot also
be prefixed by head. The fact that polygons can be members
of linked lists as well as giving rise to them is a perfect
element class polygon
l.
.
ref (head) chain
I
... ~- .---.
I
\y
•
• •
element class point
Figure 2. Internal Polygon Representation.
When an instance of a polygon is created it is initially undefined as no parameters are passed to it. This is because two methods of defining a polygon have been implemented and
4.3.3.1 Drawing
Each polygon is drawn by first moving the current position
indicator to the first point in the linked list. A line is
then drawn to each successive point from the previous one
until the last point in the linked list has been connected. A
final line is then drawn from this last point back to the
first, so closing the shape.
4.3.3.2 Geometric Transformations
The structures of the three routines provided to perform
these transformations are identical. In each, a new polygon
object is created. Then, for each point in the linked list
of the original polygon, the appropriate transformation is
applied and the newly created point is added to the linked
list of the new polygon.
As a uniform transformation is applied to each point, in
the same order as they appear in the original polygon's list,
the effect is to produce a new polygon that is a direct
4.3.4 Lines
A line, or straight line segment to be more correct, is considered to be a polygon defined by only two points, a start and an end. By prefixing class polygon to the class
declaration of line all the routines discussed in the
5. Display Routines
Irrespective of which device the picture represented by
the bit map is to be displayed on, the plot file produced by
the graphics system must be interpreted by an independent,
device dependent display program to perform the plotting. At
present two such routines exist, one on the Eclipse for the
Televideo and the other on the Prime for the Printronix.
5.1 Televideo Display Routine
The display routine for the Televideo (see appendix III)
simply clears the screen and extracts the information bit by
bit for each integer on the plot file, three integers per row
for twenty-one rows.
A test must be done during this process to ensure that
only nineteen of the thirty possible bits in the last integer
5.2 Printronix Display Routine
The steps that must be followed to produce a display on
the Printronix from a plot file on the Eclipse are certainly
not as straightforward as those for the Televideo.
The plot file must first be copied to magnetic tape using
the ETOP command. This tape must then be taken to the Prime
operators to be mounted so that the plot file can be copied
to disc (A detailed summary of the commands involved is given
in the ECSTASY System Users Guide). At this point the file is
not in a suitable state for input to the display routine and
must be preprocessed by the ETOP program listed in appendix
III. The plot file produced by this program can then be used
as data to the display routine, from which, a spoolable file
is produced. The display routine itself is quite self
documenting and is listed in appendix III.
5.3 Charging
The costs associated with the just described procedure for
producing a display on the Printronix are quite prohibitive.
At fifty cents to mount a tape and approximately fifteen
cents to print over 700 lines (be it all on one page), an
overhead of sixty-five cents is immediately incurred. This is
without considering the processor time also required to
6. Summary and Conclusions
There is obviously scope for the ECSTASY system to be
further developed and extended and indeed it has been
designed to facilitate this. The basic kernel of routines can
be extended to include more of those outlined in the Core
Graphics System. Similarly, new types of objects can be added by the user for specific applications and situations.
There are a large number of high level graphics facilities
over and above those implemented here which can be added to
the system over time. These include such things as the
ability to blank out areas of the bit map enclosed by a
particular object, so that objects may be overlayed, and the
specification of point and line types to be drawn by the
system i.e. cross, dot, x for points and dashed, solid or
dotted for lines. There is also scope for the representation
of solid objects in the three dimensions but this is
considerably more difficult to implement than what has been
achieved here.
More importantly, perhaps, there is great scope for the
system to be interfaced into a complete, interactive
environment. An aim which would come considerably closer with
the availability of a good graphics terminal. Then, on top of
the ECSTASY system as it stands, would be the need for a
higher level, user interface package. Something which would
At the outset of this project the aim was to first
implement facilities for the production of chronological
graphs, histograms, pie charts etc. from files of simulation
output data. This was to be followed by the attempted
implementation of a drawing system based on geometrical
primitives. After the basic kernel of drawing routines had
been implemented, however, the possibilities of a basic
drawing system such as the one described in this report
became apparent and seemed more realistic to achieve. A
change in priorities subsequently ensued to enable a more
detailed investigation into this somewhat more general area
than the production of data displays. Even so, the ECSTASY
system provides the facilities to make the production of data
displays considerably easier. A natural extension of the
system would be to provide facilities for the automatic
production of displays from files. of output data, but time
considerations have prevented this step from being taken at
present.
It is hoped that the impression given by this report is of
a flexible and easily extendible graphics environment
framework, characterised by its simplicity and ability to be
further developed without disrupting existing software. While
the system is currently implemented in a totally
non-interactive environment this should in no way detract
from its appeal as a basis for an interactive system in the
7. References
[1] Birtwistle et al.
SIMULA Begin
Auerbach Publishers Inc.
Philadelphia, Pa., 1973.
[2] Denning P.J. ( Editor )
ACM Computing Surveys
Special Issue: Graphics Standards
Vol. 10, Number 4, December 1978.
[3] Giloi W.K.
Interactive Computer Graphics
-data structures, algorithms, languages
Prentice-Hall Inc.
APPENDIX I
Table of Contents
1.
Introduction.
2. User Program Interface.
3. System Initialisation.
3.1 Window. .
. • •
3.2 Viewport.
. .
.
1 1
2
3 3
4. Drawings Based on Geometrical Primitives. • • . • .
4
4.1 Picture Objects
. • •
• • • • . . • • 5
4.2 Circle Objects. •
. • . • • • 6
4.3 Line Objects.
4.4 Point Objects
4.5 Polygon Objects •
4.6 Get_Objects Facility . • • • •
6
6
7
8
5. Basic Drawing Routines.
. • •
• • .
9• • 12
6. Coded Character Representation • • • • • •
7. Picture Displays • • .
7.1 Televideo Displav •
7.2 Printronix Display.
• • • • • 13
• • . • . . • 13
1. Introduction
This document is a users guide to the ECSTASY Graphics System and should be read in conjunction with the report ECSTASY: An Object Oriented Graphics System - of which this guide is also an appendix. As the routines provided by the system are to be called from within a SIMULA program a working knowledge of this language is assumed in the reading of this guide. The system is implemented from within the Computer Science Department's DG SIMULA implementation on an ECLIPSE S/130 computer.
The ECSTASY system provides facilities for the definition and manipulation of geometrical primitives at an abstract level without the user having to be concerned with actual
internal object representations. These facilities are
outlined in section 4. A set of basic drawing routines is also provided for the user to construct pictures directly
without using these higher level facilities. These are
outlined in section 5.
At present the only two output devices catered for by the system are the Televideo 920 terminal attached to the ECLIPSE and the Computer Centre's Printronix printer. The system produces plot files of integers for interpretation by device dependent display routines associated with these devices. The steps involved in producing the final displays are outlined in section 7.
2. User Program Interface
The source code for the svstem is contained in the file ECSTASY. This is incorpor~ted into a user program in the
following way: begin
%include ecstasy animation
begin
.
3. svstem Initialisation
Immediately a user program begins executing with the
ECSTASY system a query of the form:
Output devices: 1: Printronix
2: Televideo
Enter Your Choice:
>
will appear, to which either the response ' l ' or '2' must be typed. Any other character will cause the query to be repeat.
All the plot files subsequently produced by the system will
be for the specified device and this cannot be changed.
The next two sections outline the system routines for
specifying the 'window' and 'viewport' settings. Both these
must be specified before the construction of a new picture or
the current settings, which may be the defaults, will be
3.1 Window( x min,
ymax,
ymin,
ymax, adjust
)1 real x min, y min, y min, y max1boolean adjust1 -
-A window is a rectangular domain in the
space. By specifying this domain with
coordinates that are more natural for
application may be used.
world coordinate
the above call,
any particular
The first four parameters define the low and high limits
of the window along each coordinate axis. Knowing these
picture frame limits the system will set new conversion
factors for the transformation between the world and device
coordinate domains.
This is done in such a way that for the case adjust=false
the picture will not be drawn true to scale. The whole
surface of the display device will be used for the mapping
from world to device coordinates. This is useful, for
example, when scattergrams with differing x and y coordinate
ranges are required to be drawn using the whole of the
display surface. Also, for the case adjust=false, the
differing height to width ratios of plottable points on many
particular devices is not adjusted for.
For the case adjust=true ~ictures will be drawn true to
scale. This must be done, for example, to prevent circles
from being drawn as ellipses.
The window settings may be changed at any stage of picture
construction but care must be taken when doing this. It is
usually only done in conjunction with a change in viewport as discussed in the next section.
The default window setting is precisely the device
coordinate domain with adjust=false. i.e. for a terminal
with 22 rows and 79 columns the default would be (0, 22, O, 79, false).
3.2 Viewport( x min, x max, y min, y max); real x_min, x_max, y_min, y maxi
A viewport is a rectangular portion of the display surface onto which the window is to be mapped. By default this is the whole of the display surface. The parameters are in terms of
normalised device coordinates i.e. between O and 1. For
4. Drawings Based on Geometrical Primitives
The ECSTASY system provides facilities for the definition
and manipulation of objects of the following types:
( i) (ii) (iii) (iv)
(v)
complete pictures circles
points polygons lines
Object instances of a particular type must be referenced
by a variable of the appropriate type, namely:
(i) ref
(ii) ref (iii) ref ( iv) ref
(v) ref
picture) circle ) point) polygon)
line), respectively.
Each object can be drawn, rotated, translated or scaled.
As the routine calls to perform these operations are the same
for all objects·they are discussed first before the distinct
characteristics of the individual object types are outlined.
The following discussion uses a general reference variable
'object' to represent an instance of either one of the
possible object types.
The three geometric transformations are all implemented
as function procedures and return a reference to a new,
distinct object instance. This instance is a direct mapping
under transformation of the object to which it was applied.
By assigning the reference variable for the original object
to the function call, however, the effect is the same as a
transformation applied directly to the original. i.e. object :- object .rotate ( ••• ) •
A more detailed discussion on geometric transformations is
given in the ECSTASY System report mentioned earlier.
(i) Object.draw;
This will result in the referenced object being displayed
on the output device when the plot file produced by the
system is interpreted by the appropriate display routine (see section 7).
(ii) Object.rotate( xcentre, ycentre, angle)~ real xcentre, ycentr.e, angle;
(iii) Object.translate( x dir, y dir
)1real x_dir, y_dir;
The
new object instance will be
a translation of the
instance referenced by 'object'
of
x dir world coordinate
units in the x direction and y dir units in they direction.
i.e. another object :--object.translate( 10 , 20 ) ;
( where another_object is of the same type as object)
(iv) Object.scale( xscale, yscale )i
real xscale, yscale;
The
new object instance will be a scaling of the instance
referenced by 'object'. If the scaling factor in the x
or
v
direction is greater
than one then the new object will be
stretched in that direction. If it is less than one then the
object will be compressed.
4.1 Picture Objects
A picture object is made up of any number of other object
instances (except other. oictures) to form a complete picture.
(i) pix:- new picturei
- creates a new instance of a picture referenced by 'pix'.
Initially no other objects are associated with the new
picture.
(ii) pix.include( object )i
adds
the object instance referenced by 'object' to the
picture 'pix'. If this instance is already in another picture
then it will be removed from :i.t before insertion into 'pix'.
Any particular instance can only be in one picture at a time.
(iii) object.out~
4.2 Circle Objects
(i) birc :- new circle( pt, radius); ref (point) pt1
real radius~
creates a new object instance that represents a circle
with a centre at 'pt' and a radius of 'radius' world
coordinate units.
(ii) circ.x scale factor:= 2, or
circ.y=scale=factor. := 0.5.
will change the scaling factor in the specified
direction thus elongating or shortening the dimensions of the
circle in that direction. This enables ellipses to be
defined although the elongation can onlv occur in the x and y directions.
4.3
Line Objects(i) lin :- new line( xl, yl, x2, yl) ~
real xl, yl, x2, y21
creates a new object instance representing a line from
(xl, yl) to (x2, y2) in world coordinate space.
4.4 Point objects
(i) pt :- new point( x,
v
)1 real x,vi
- creates a new object instance representing a point at
·4. 5 Polygon Objects
A polygon consists of a set of points which represent its
vertices. The order in which these vertices are connected
is
the same as that in which they were entered into the polygon
representation.
(i) poly:- new polvgon1
- creates a new polygon instance which has yet to have its
shape defined. The following two routines are provided for.
this.
(ii) poly.define( vertices, number
)1real array vertices1
integer. number~
The
dimensions of
the array 'vertices' must be at least
(1:2,1:number).
Each
pair of points, vertices(l,k)
and
ver.tices(2,k),
is used to create a new point object which is
then added to the list of vertices for
the polygon.
The
number
of vertices is specified by 'number' and they must be
in the order that they are to be connected when
the polygon
is drawn.
(iii) poly.include( pt);
ref point (pt)
1is used to insert the points representing the
of a polygon on an individual basis. This is useful
are being read from a file as happens in the routine
in the next section.
4.6 Get_Objects Facility
The routine:
get objects( filnam, number, pix
)7-text filnam7
integer. number7
ref (picture) pix7
will read data pertaining
'filnam'. Each line of
this
following
forms
depending
represented. The first letter
(i)
circles
to
'number'
objects from file
file must
take one
of
the
on which
type of object
is
must be in column one.
C <x centre> <y centre> <radius>
(ii) lines
L <xl coord> <yl coord> <x2 coord> <y2 coord>
( 111
. . .
)points
P <x coord> <v coord>
(iv) polygons
s:
Basic Drawing Routines
As well as the facilities discussed in the Previous
section there is a basic set of drawing routines that can
also be used to construct pictures. These routines are a
subset of the Core Graphics System (see ACM Computing
Surveys, Volume 10, Number 4, 1978) and enable the drawing of
the basic output primitives (i.e lines, points and text)
under direct control of the user program. A number of the
routines make use of the current position indicator (CP)
which is maintained by the system. This indicator takes on
values corresponding to the current drawing location in world
coordinate space and its use reduces the number of arguments
required by many of the routines.
A description of the routines now follows. All coordinates are expressed in real values.
(i) line_abs( x, y) 1
draws a line from the current position to the world
coordinates (x, y). CP becomes (x, y). (ii) line_rel(x, y)1
draws a line from the
coordinates (x, y) relative
becomes this new position.
(iii) mark_abs(x, y);
current position to the
to the current position. CP
- draws anoint at coordinates (x, y). CP becom~s (x, v). (iv) mark_rel(x, v)1
- marks a point at coordinates (x, y) relative to the CP. CP becomes this new position.
(viii) send1
Also not a specific core routine, send will dump the
contents of the. internal picture representation to a plot
file for later interpretation by a display routine. The user
is prompted for the name of this file. The display routines
are discussed in more detail in section 7.
(ix) prOtext( line, xstart,. ystart,
x char space, y char space);
- text line1 -
-real xstart, ystart,
x_char_space, y.char_space;
This routine will cause the text string referenced by
'line' to be displayed. starting at world coordinate position
(xstart, ystart). The bottom left of the first character is
taken to be at this point.
Each character is defined within a 7 by 5 dot matrix and is drawn within its own 10 by 7 square of device coordinates. For example, the letter 'H' is:
)
I, ,...__ ....,...
10
'1
'
Care must be taken that the characters expressed in device
coordinates do not overlap with other picture objects
expressed in the world domain. The user should experiment
with each output device to check the size of the characters
produced.
The routine for entering the coded
representations used by the system is discussed in section.· It enables the layou~ for any character to changed within the bounds of its 10 by 7 matrix.
character
the next
be easily
The x char space and y char space parameters determine the
direction the text will be wrTtten in. They are expressed in
character position units i.e.
( 1, 0 ) is horizontal across,
(x) text size(x,
y)1integer x,
y~This routine is used to change the text size attributes in
the x and y directions. The default is (1, 1). For example,
( 2, 2) is double sized characters,
( 1, 2) is double height by single width.
Again, the user should experiment with the output device
to
check
the size and quality of the characters produced with
6. Coded Character Representation
Each character is represented by a series of moving and drawing instructions stored in file charcodes. The program getchar can be used to change these representations and is easy to usa, prompting the user at every stage. Each drawing or moving instruction is represented by thre~ integers. The first integer is either O (for draw) or 1 (for move) and is followed by the x and y displacements for the operation from the current position. The last instruction, which may not always be needed, must be a move to ensure the current position is returned to the bottom left of the character matrix. It can be assumed that the position at the start of each sequence of instructions for a character is also at this position. Finally, the numbers 3 and 100 must be entered. The 3 signifies the end of the data when it is being used by ECSTASY and the 100 signifies the end of this line of data for program GETCHAR.
For example, the minus (-) sign is:
I·
I
s
>
1 4 3 - move to right of the symbol 0 -4 0 - draw to left
1 0 -3 - reposition to start 3 100 - finish off
The present implementation is restricted to 23 drawing and
moving instructions per letter. This can be changed by
increasing the record size used in program GETCHAR but it
7. Picture Displays
The
plot files produced by
the
'send'
routine for a
specific display device can be interpreted
bythe appropriate
display routine in the following ways.
7.1
Televideo Display
(i)
run program TVOUT on 'the ECLIPSE
(ii)
reply to prompt with the name of the l'.>lot file
(iii) wait for screen to be cleared and picture displayed
7.2
Printronix Display
(i) Copy the plot file to magnetic tape from the ECLIPSE via
the ETOP command. i.e. ETOP MT0:0/o plot_file/i.
(ii) Get the tape mounted on the PRIME, assigning it to MTO.
(iii) Use the MAGNET facility to copy the plot file from
tape in the following manner:
OK, magnet
[MAGNET rev.
18.110P'l1ION:
rMTU
#=
0MT
FILE#=
1 {or whatever}
LOGICAL
RECORDSIZE= 514
BLOCKING FACTOR= 1
ASCII, BCD, BINARY, OR EBCDIC? binarv
OUTPUT
FILE:plotfile
OK,
(iv) Load and run program ETOP to preprocess the plot file.
The input and output plot file names will be asked for.
(v) Load and run program TOPRO to produce the final
spoolable plot file.
The input and output plot file
APPENDIX II
% _Basic kernel of drawing routines based on the Core % Graphics System.
begin
int e g er x d ii~ v s i z e, y __ d ei v l z fL•
% device siz
ext.--sc,;:1lc1, 1.,I ·t£n: c;;:111:i;
text scale factor
r·eal x._cuT·r_,.po!::-, Y.-.curr,.310!;;.,
% current position indic tors;
x _.u, in d-}na :(, 1.:1 _.1.ti ind .)11,::i x ,
% upper window limits
x ___ wi nd_Jni n, IJ_ .. wi nd._.mi n,
% lower window limits
% %
'%
x , •• d ii:,V _Joa x .• y .. JI f'V .• Jnt', x J
x dt'IV_Jnin, y __ dev_Jnin,
adJusted device max and mins after viewport and window adJust specifications
d IJ ts ... PIH'.)<., do ·I; 1; .•. Per ... Y,
device dots per world coord dot
dot:_.J'atio ..
x dot p r 1
u
dox vii:i,w ___ d:if:f, 1,1 .. ,:,1i if'f;
diff rence in upper and lower viewport specifications
query user for output devi
ini;i?.ger dE:1vic
bef1in
od ,
) ;
c h ,":l'f'· a c tan' c h ;
if' dev:ic: od 1. t; h en b £J in c o mm,,., n t : pr intro n i >t; x ev ... si z
IJ f..'V _E;i Z e
dot .... .r'at:ici
1.md
390; :~60;
0. 13:33
<:!ls if d1r1vir;e .... cod
x_dev_size 79;
% get bit map size and initialise sy tem defaults
%
betJin
9et __ devic:e•: 0 ); comment: d12vic.:1 nut \Jfti; known
tJ ev,_,SZf! : t,L.dc,.1v_,size;
vi <?u.t.JHn·t ( 0. 0., 1. 0, 0. 0., L O ) ;
ud.nduw( 0, x .... d<?V i,: ,
o_.
tJ ev iz , .P1±11s<0, ) . ,tex i:n~U., U
end Y-.dev_);ze;
procedure plot( x1, y1 mark the point (xi,
be9in
integer x, y,
p OIJH?1';
);
1.Jl) in the bit map
if ( xi>~ x ev_~in ) and ( xi~ x ev max+ 1 )
and ( tJ1 ::,.,,:;, y ev.Jnin) ,,md ( LJl. <: y ev_)J)ii'IX + l }
then begin
% point in domain so convert to int ger device coords
X : 1,.•n ti tH' ( X :l. ) i
13 : entier( yi. );
power mod < x, '.W } i
potJJel' if' power O th1°1n l r:1.:,mm<?nt: .Por· rirJht: shJ.ft;
el 2
** (
30 power );x : ( x 1. ) / / ~30 + L comment: ::JO bit pf::>r int;
if: mod( bit;-Jniap( \J, ,t ) /i po\JJfJT·, ;;;! ) 0 th1:in
% get right bit and ee if i already on
bit .. Jn,,ip( iJ, 1.} :,,.,, bi p( iJ, ); ) pnw(01r
end e n d p l 1:i ·i.; .i
p ·r ci c f! d u r J o i n < x i , \,J:t, x~~J· ~J~;'? );
mark a line from (xi, qi) to (xf~,
re•aJ. xt1 yl, xf2, 1;.1t~; beg i r1
ini:a~geT· :i;
r·eal length.,
xinc:r·, tJ:i.ncr;
leng1;h : if abs( tJl2 yi )
>
rc'ltnd x;.;! xl thenabs( y:;:! ··- y1 )
f?lse abs( x2 id );
if' len9th O ·then comment: is aci;ually point;
plot( x:l.1 IJ:1 )
1?.<lse begin comment: mark the line point; btJ point;.:
xincr ( x2 xi ) I length;
'% c on v er-t t1w r 1 d to d e v i c e c o or d in at; s inc l u d :h1 £l vi e w p t:H' t:
name x, y; real x, y;
*
d n ·h r; ,_Jl .:i r· .. ,, x -1,· x ... Y i £:~J -... d ev .. .Jn :in + ( tJ lJ _ .. 1.i1 in J -Jn in :i
·Ii- d r1 t: .-P e r ...
:J
y ,_Y i f'end map
ilH)( xi., IJ1, x;:?, IJ
·r-e;::11 x1, l;.tl, xt~~, y:2; lH:JfJJ.11
map t;o __ device< xL 1J1 );
map o .. -device( x:;:11 IJ~~ ).,
% now in device coorcls so Join
,Join ( xi, tJ 1, :~~2, 1,1
1:1nd dr'a1.1.1_. 1
int'?.-} ;
i fl f;
if f'
% clear internal bit map rapr sentation of displ y device
be,Jin intefJer :1.,
for i : t
f: or J : bi
i~nd r i:;et.t
.P
s b,1 p 1 u n i; :i. 1 t_J I'? v ... rd .z d n c: D HlliH,) n t : i'i' ,H: h J. :t. rm .•
1 step 1 until < x v iz -1 ) // 80 + 1 do