ISSN : 2394-2231
http://www.ijctjournal.org
Page 137
SIGNATURE VERIFICATION THROUGH SMARTPHONES
1
Ms. Akila .S,
2Ms. Siva sankari A.
1M.Phil Research Scholar, Department of Computer Science DKM College for Women (Autonomous), Vellore, TamilNadu, India.
2 Asst. Prof, HOD, Department of Computer Science DKM College for Women (Autonomous), Vellore, TamilNadu, India.
---
************************
---Abstract:
This paper studies online signature verification on touch interface-based mobile devices. A simple
and effective method for signature verification is developed. An online signature is represented with a
discriminative feature vector derived from attributes of several histograms that can be compact and requires
constant space. The algorithm was first tested on the well-known MCYT-100 and SUSIG data sets. The
results show that the performance of the proposed technique is comparable and often superior to
state-of-the-art algorithm despite its simplicity and efficiency. In order to test the proposed method on finger drawn
signature on touch devices, a data set was collected from an uncontrolled environment and over multiple
sessions. Experimental results on this data set confirm the effectiveness of the proposed algorithm in mobile
settings. The results demonstrate the problem of within-user variation of signature across training strategies
to alleviate these problems.
Keywords
—SQL injection, information theory, entropy, web attacks, database security.
---
************************
---I. INTRODUCTION
A handwritten signature is a socially and legally accepted biometric trait for authenticating an individual. Typically, there are two types of handwritten signature verification systems: line and online systems. In an off-line system, just an image of the user's signature is acquired without additional attributes, whereas, in an online system, a sequence of x-y coordinates of the user's signature, along with associated attributes like pressure, time, etc., are also acquired. As a result, an online signature verification system usually achieves better accuracy than an off-line system.
The increasing number of personal computing devices that come equipped with a touch sensitive interface and the difficulty of entering a password on such devices have led to an interest in developing alternative authentication mechanisms on them. In this context, an online signature is a plausible candidate given the familiarity users have with the concept of using a signature for the purpose of authentication.
There has been much work on online signature verification system. However, none of this has been directed to the context of authentication on mobile devices. Previous work has addressed online signature
acquired from traditional digitizers in a controlled environment.
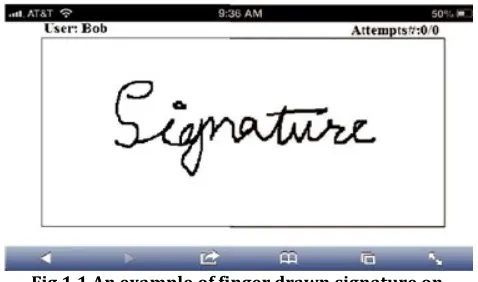
Fig 1.1 An example of finger drawn signature on mobile devices
These are different from those acquired from mobile devices in dynamic environments. First, on mobile devices, a user performs his signature in various context, ie., sitting or standing, mobile or immobile, and holding a device at different angles and orientations. Secondly, availability of computational resources may differ from one signature instance to another and it could result in
ISSN : 2394-2231
http://www.ijctjournal.org
Page 138
greater variation of input resolution when compared tothat of stand-alone acquisition devices. Last, signatures on mobile devices are often drawn using a finger instead of a stylus resulting in less precise signals. An example of finger drawn signature acquired from mobile devices is depicted in Figure 1
Consequently, verification performance derived from traditional datasets, collected using stylus-based devices in a controlled environment, may not carry over to online signature verification on mobile devices setting. In addition, other characteristics of the system, i.e., a template again and effectiveness of cross-session training, may be different when signature are obtained from a mobile device.
This paper proposes an online signature verification algorithm that is suitable to deploy on mobile devices. it is computationally and space efficient algorithm for enrolling and verifying signature. The proposed method was evaluated on public datasets as well as new owned mobile devices. The verification performance obtained is promising. The key contributions made by this paper are as follows:
1. A method to extract a model-free non-invertible feature set from an online signature is proposed. The feature set comprises of sets of histograms that capture distributions of attributes generated from raw signature data sequences and their combinations. By evaluating the proposed method on public datasets, its verification performance is superior to several state of the art algorithms.
2. A new dataset was collected from 180 users in a
mobile device verification environment. The signatures in this dataset were drawn with a Fingertip, in an uncontrolled setting on user owned iOS devices and over six separate sessions with intervals ranging from 12 to 96 hours. 3. By applying the proposed method on the above
dataset, the following aspects of online signature Verification on mobile devices were investigated:
a.Impact of template aging on online signatures, b.Effectiveness of using cross-session samples, or
samples from multiple sessions, to train a classifier, and
c.Security of the system against random forgery, or zero-effort attack, and its comparison to that of 4-digit PIN.
The rest of this paper is organized as follows. Section II presents a process of deriving a set of histograms from an online signature, gives details of the proposed online signature verification system, and analyzes its complexity. Section III provides experimental results on public datasets. In section IV, a method and apparatus for collecting a new dataset as well as experimental results and analysis on this dataset is presented. Lastly, in section V, conclusions and future
work are discussed.
A. Previous Work
Typically, online signature verification techniques can be classified into two approaches, namely, function-based and feature-function-based [5]. The former refers to an approach where the matching process is done using, directly or indirectly, the original time series data points of a signature. The latter refers to an approach where the matching process is done using descriptive features of a signature. Examples of well-known function-based approaches include Dynamic Time Warping Algorithm (DTW) [6], [7], [12], and Hidden Markov Models (HMM) [8].
A function-based system typically yields better verification performance than a feature-based system [13]. However, during the matching process, a dynamic construction of the original signature is revealed resulting in a potential privacy problem if the matching has to be done remotely. Furthermore, the system is generally more complex and slower than feature-based systems [6]. Even worse, when a template protection approach is applied in order to provide biometric privacy and/or security, verification performance often deteriorates significantly. For instance, Maiorana et al [14] have proposed a convolution scheme to protect the original signature sequence of a user, that can be directly applied to any function based approach. The idea is to split the original input sequence into W subsequences. Each subsequence may have a different length based on random parameters. This technique has been applied with HMM and DTW based verification systems [14]Ð[16]. In each case, verification rates were lower when compared to using the original versions of the signatures.
ISSN : 2394-2231
http://www.ijctjournal.org
Page 139
best reported verification performance obtained by theirsystem is promising. However, the system extracts 4800 features from tuning 16 different HMM models, which is a computationally expensive task. Moreover, the universal background model is trained from a pool of 2500 genuine and forged signatures from 50 users on the same device specification, where a user-specific classifier is trained from 10 signatures. These make it less feasible to be employed for mobile device authentication, where the embedded sensors are different from model to model. In addition, the HMM-based method is not robust to the well known template-aging problem resulting in significant deterioration of verification performance when verifying samples and enrollment samples are from different sessions [11].
II.ONLINE
SIGNATURE
VERIFICATION
ALGORITHM
As illustrated in Figure 2, the proposed system comprises of three main components: a feature extractor, a template generator, and a matcher. First, an online signature is processed by the feature extractor in order to compute a set of histograms from which a feature vector is derived. Then, the template generator constructs a user-specific template using the feature sets derived from multiple enrolled signatures. This template is later used by the matcher to verify a test signature. The rest of this section describes these three components in detail and analyzes system complexity. (For more details, please refer to [21] for the earlier version of this work.)
A. Feature Extractor
In the proposed system, an online signature is represented by a set of histograms. These histogram features are designed to capture essential attributes of the signature as well as relationships between these attributes. It should be noted that histograms are widely used as a feature set to capture attribute statistics in many recognition tasks. For instance, in object recognition [22] and off-line signature verification [23]. Using histograms for online signature verification was first suggested by Nelson et al [24]. They have also been used as part of the feature set in [1] and [19]. However, in [1] and [19], the use of histograms is limited only to angles derived from vectors connecting two consecutive points in an online signature. In fact, as is shown below, much more information can be used to derive histograms useful in online signature verification. These include x-y trajectories, speed, angles, pressure, and their derivatives.
The feature extraction process of the proposed system begins by converting the time-series data of a signature in to a sequence of cartesian vectors and attributes, as well as their derivatives. Then, each cartesian vector is also converted to a vector in the polar coordinate system. Finally, histograms from these vector sequences are derived. Details of the feature extraction
process are as follows.
Let X = {x1, x2, . . . , xn }, Y = {y1, y2, . . . , yn }, and
P = { p1, p2, . . . , pn } be the x and y co-ordinates and pressureattribute, respectively, of a signature with length
n sampled at times T = {t1, t2 , . . . , tn }. For datasets used in this first experiment, all signatures were sampled at a constant rate. Hence the time information is implicit and is ignored. Note that if time intervals are not a constant, a normalization process using information from T can be applied to the sequences X , Y , and P prior to being processed by the system.
To begin with, the vectors X 1, Y 1, and P 1 including their derivatives are computed as follows,
X 1 = {xi1|xi1= xi+1− xi}, (1a)
Y 1 = {ui1|yi1= yi+1− yi}, (1b)
P 1 = { pi}, (1c)
and
X k = {x k |xk=x k−1 −x k−1 }, (1d)
i i i+1 i
Y k = {yk |yk=yk−1 −yk−1 }, (1e)
i i i+1 i
P k = { pk | pk = pk−1 − pk−1}, (1f)
i i i1 + i
Where k > 1 and i = 1, 2, . . . , n − k.
Note that, by computing differences between each pair of successive points as above, the vectors X 1 and Y1 positional invariant features of the signature. And by repeating this process of taking differences k times yields the kt h order derivative, Xk and Yk , of the original X and Y sequences respectively.
Then, a sequence of vectors V = {vi∗ |i = 1, 2, . . . ,
n}, is constructed where each vector element, vi∗ = {vi1_ . . . _vij } is the concatenation of vik which is a five-tuple consisting of the kt horder derivative of the cartesian and polar coordinates andpressure attributes as follows:
A set of histograms is then derived from distributions of attributes of vectors vi∗ in V . The detailed descriptions of these uniform width histograms are given in Table I. Specifically, there are two types of histograms:
1) One dimensional histograms Ð these capture
ISSN : 2394-2231
http://www.ijctjournal.org
Page 140
especially useful in combating skilled forgeries.2) Two dimensional histograms Ð these capture
distributions of relationship between pairs of attributes. For example, < _1, R1 >(1) and < _1, R1 >(2) captures the distribution of dependency between speed and angle of the first and the second halves of an online signature. Similarly, < _1, _1d(1,2) > captures the distribution of the relationship between three consecutive angular coordinates of an online signature sequence while pro-viding warping flexibility when comparing two different signatures from the same user.
The histograms above are computed by splitting the range of attribute values (specified by Min and Max columns in Table I), into a number of equal width bin intervals (also given in Table I), and counting the number of elements that fall into each particular bin. For an angle attribute and its derivative, the range of its histogram is defined as [−π, π ]. For an attribute that has no explicit boundary, an outlier process with cutoff at three standard deviations from its mean is applied prior to computing the mean and standard deviation of the attribute in order to derive its implicit range described
In Table I. For example, the histogram _1 is derived from a sequence {θ1i; i = 1, . . . , n} by forming a 24 bin histogram with equal width bin intervals beginning from −π to π and counting the number of elements, {θi1}, that fall into each of the 24 bins. It then results in a vector of 24 bin frequencies. As can be noted from Table I histograms comprise of two types of frequencies: 1) absolute frequency, an actual count of elements that fall into a particular bin, and 2) relative frequency, the absolute frequency normalized by the total number of elements in the histogram, or in other words the length n of a signature. Using the absolute frequency results in more implicit importance given to the length of the signature whereas using the relative frequency ignores the length. Out of the 21 histograms listed in Table I, only 5 are described by absolute frequency. These are the speed and its first derivative histogram, the pressure histograms of the first and second half of a signature, and the < _1, _1d (1,2) > histogram. These five histograms were empirically chosen as they derive from the lowest order derivative of online signature attributes as well as they provide higher recognition rate when describe with absolute frequency.
After all these histogram are computed, they are concatenated and used as a signatureÕs feature vector as follows. Let Bi be a vector of bin frequencies of i t h histogram. A feature vector F is defined as F = {B1_B2_ • • • _B j }, where j is the total number of histograms, and _ is the concatenation operator. Once the feature vector F is constructed, each of the elements is used independently as a feature component of an online signature. For the rest of
the paper, F is treated as a feature vector without distinguishing which histogram each individual feature element belongs to. In other words, an online signature is represented by a feature vector F = { fi ; i = 1, . . . , M } where M is the total number of histogram bins from all j histograms.
B. User Template Generator
A user template is generated during the enrollment process where multiple signatures are acquired from a user and a feature set is computed from each of the samples. Then, the variance of each feature component is computed and is used to construct a user-specific uniform quantizer for each feature element resulting in a quantization step size vector Qu that is used to quantize each of the feature vectors derived from the enrollment samples. Finally, the average of these quantized feature vectors is used as the template¨ u for F that user. This feature vector along with the quantization step size vector are stored corresponding to the identity of the user.
During verification, a user claiming an identity u is asked to produce one instance of an online signature which is again represented by the set of features. Then the quantization step size vector, Qu corresponding to that identity is used to derive a quantized feature vector from the signature input. Next, the system compares this quantized feature vector against the stored feature vector template,¨ u. The signature F is accepted if the Manhattan distance between these two vectors is less than a predefined threshold, otherwise it is rejected. The details on how to derive the quantization step size vector Qu and the template feature vector are given below.
Let S be the total number of enrolled samples and
M be the total number of features for each sample. And let
Fsj = { fisj |i = 1, . . . , M } be a feature vector of the enrolled sample s jof the user u where j =1, . . . , S. The quantization step size vector of the user u, Qu = {qiu |i = 1. . . M }, is obtained by computing the standard deviations over all the enrolled samples for each feature and using a multiple of this as the quantization step size. That is,
qiu = β
1 S fisj − µ
fi(u) 2, i = 1, . . . , M(3)
j =1
_ S
_
where µ (u) = 1 S f
sj , β is experimentally Fixed at
1.5.
fi S
j
=1 i
Then, the quantized feature vector of each enrolled sample
_(s j
|u) s j
ISSN : 2394-2231
http://www.ijctjournal.org
Page 141
i
to prevent division by zero) as follows,
fˆi(sj|u) =_
s
,
fi j
i =1, . . . , M (4)
qiu +ǫ
where ǫ is at 0.002 and 0.8 for histograms with absolute and relative frequencies, respectively.
Lastly, the user-specific feature vector template, ¨ u =
F
{ f¨iu |i = 1, . . . ,M}, is derived by averaging the quantized
Feature vectors of all the enrolled online signature samples from the user u.
S (s j |u) , f¨
iu = _ j =1Sfˆi i = 1, . . . , M (5)
A pair Qu, F¨ u comprising of the quantization step size Vector and its associated feature vector template is then stored and later used to verify a claimed signature of the user u. It should be noted that while the feature vector in this experiment was extracted from attributes of multiple histograms, it is possible to use other proposed methods, e.g., the one in [25], that can extract a Fixed-size feature vector from an online signature with variable length. However, the method proposed in this paper to derive a quantization step size vector and a user-specific feature vector template is not robust to a feature with an extreme value, i.e., an outlier. This could possibly happen in certain features spaces, for example DCT coefficients in [25], but is rarely the case for histogram features. Such an occurrence could result in Verification performance deterioration.
C. Matcher
During Verification, given that t is claimed to be an online
signature sample from user u,
ˆ (t |u)
is calculated using Qu.
F
Then the system derives a dissimilarity score using manhattan distance
between ¨ uand ˆ
(t |u)
as,
F F
M
Scor e = |fˆi −f¨i | (6)
_
i=1
The system then accepts the sample t if the dissimilarity score is less than a predefined threshold, otherwise it rejects.
D. Complexity
Given n as the length of an online signature, Xk , Yk , Rk , _k , and Pk can be computed in time O(n). These vectors are then used to derive h histograms which requires O(h∗n) or O(n) time complexity for deriving a feature vector as h is a constant. For the classification process, a feature vector is first computed and quantized in O (n) time and then used to construct or to compare against the feature vector
template.
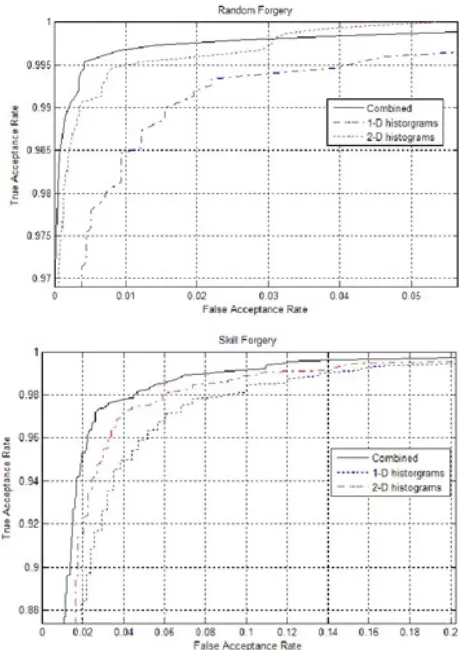
Fig. 4. ROC of skill and random forgery obtained from MCYT-100 dataset when 1-D histogram, 2-D histogram, and both sets are applied. (a) ROC of
random forgery. (b) ROC of skill forgery.
Since the number of features is a constant, the time complexity is O (n). The space required to store a template is clearly a constant as it consists of two Fixed-length vectors. As a result, the proposed method requires constant space to store a user’s template and linear time computational complexity for enrolling and verifying a signature.
III. EXPERIMENTS ON PUBLIC DATASETS
This section presents experimental results with the proposed technique and compares it to others published in the literature on common datasets. Experiments were performed on the two well known datasets: 1) MCYT [8], which consists of signatures from 100 individuals with 25 genuine samples and 25 skilled forgery samples, and 2) SUSIG [7], which consists of signatures from 94 individuals with 20 genuine samples from two separate sessions and 10 skilled forgery samples.
ISSN : 2394-2231
http://www.ijctjournal.org
Page 142
randomly select k samples as the training set and thenthey average over multiple such random selections to derive the final performance result. The reason is that such a training method captures within-user variation better. Other papers [7], [8], [14], [15], and [20] choose the first k samples, according to the original order in which the data was acquired, as the training set. For online signature Verification, most studies have chosen this second approach since it mimicks what a Verification application will actually do. In other words, the actual Verification application will always acquire enrollment samples before verifying samples. The results from such an experimental protocol also captures the effect of the template aging problem [13], [26], [27], which is, in fact, one of the major causes for degradation of Verification performance.
In this experiment, the second protocol was followed. That is, the first k samples of the set from a specific user were used to enroll a template, and the rest were used to evaluate the False Rejection Rate (FRR) at different threshold levels. In the random forgery scenario or zero effort attack, i.e., an attacker simply attacks the system using his own signature, all samples from all other individuals were used to evaluate the False Acceptance Rate, namely FAR-RF. On the other hand, for the skilled forgery scenario, 25 skilled forgery samples from MCYT dataset and 10 skilled forgery samples from SUSIG dataset for each user were used to evaluate the False Acceptance Rate, namely FAR-SF. The Equal Error Rate (EER), the rate at which FAR and FRR are equal, was also used to compare the Verification performance of different approaches.
Finally in this experiment, only the first and second derivative sequences of vectors v ∗ = [vi1, vi2 ], as described in Section 2.1, were used to compute the features of an online signature (i.e. k = 2). This resulted in a set of 440 features by concatenating the histograms described in Table I (See Appendix A for experiments where parameters in the table are varied.)
A. Effectiveness of 1-D versus 2-D Histogram Features
As mentioned in section II-A, the proposed histogram features are derived from two types of histograms namely one dimensional histograms and two dimensional histograms. The plot of the receiver operator characteristic (ROC) curve obtained from MCYT-100 dataset when each of these histograms is used as well as when they are combined, using 10 enrollment samples, is depicted in Figure 4.
The results show that 2-D histograms are indeed a more effective feature set in terms of discrimination power against both skilled and random forgeries as compared to 1-D histograms provided that they are employed with larger bin widths. They also appear to work well with less information since pressure information was not included in the 2-D histograms we
computed. The results also demonstrate that 1-D histogram features provide complementary information since the best result is observed when the two sets are combined.
Table II EER of the proposed system derived from mcyt-100 dataset when different numbers of samples
are used for training
B. Verification Performance of the Proposed System
The performance of the proposed Verification system derived from MCYT-100 dataset using different number of training samples per user is reported in Table II. The results demonstrate that the proposed system can effectively verify a userÕs online signature even when only three samples are supplied during enrollment. However, Verification performance at every operating point slightly improves as the number of training samples grows.
C. Comparison with Previous Work
This subsection provides a comparison of performance between the systems that are considered as the state of the art for feature and function based approaches and the proposed approach. Results reported on the proposed system as well as the other systems are derived from the same datasets. The function based approach considered here includes Dynamic Time Warping technique (DTW), Hidden Markov Model (HMM), and their template protection approach. The feature based approach considered include one utilizing Fourier descriptor features, and a 100-feature system in conjunction with three different classifiers.
Table III lists the Verification performance of these different techniques on the MCYT-100 dataset. As seen, the proposed system outperforms other systems especially when a few training samples are supplied. These results emphasize the competitiveness of the proposed system despite its computational and space efficiency.
ISSN : 2394-2231
http://www.ijctjournal.org
Page 143
set are attributed by their relative frequency in which theactual length of the signature is ignored. Only 112 histogram features or 25% in the set are attributed by absolute frequency, where the actual length of the signature gets reflected in the feature values. This results in lower FAR-RF but higher FAR-SF than the system in [7] and [26]. However, when more weight is given to the histograms with frequency attributes, the EER of skill forgery is reduced from 5.86 to 4.59 whereas that of random forgery remains unchanged. This implies that the Verification performance could potentially improve if there are more histograms created using absolute frequency and not relative frequency. It also demonstrates that the forger’s skill in these two datasets are very different.
We acknowledge that reported Verification rate is not always the best justification for a system’s effectiveness, since each system might have been trained and tested differently as well as the difference in employing skilled forgery model. In addition, the system might apply different set of features to employ their classifiers. Nevertheless, the results show that the proposed system, at the very least, is comparable to others in terms of the Verification performance.
IV. EXPERIMENTS ON MOBILE DEVICE
DATASET
Performance comparison of online signature recognition algorithms has been traditionally done using public datasets. The two well-known public datasets, the SUSIG and MCYT-100 datasets, have been collected using a static stylus-tablet in a controlled and supervised setting. The previous section reported results of the proposed algorithm obtained on these two datasets. However, as mentioned in the introduction, online signature Verification for user authentication on mobile devices has unique aspects that are not reflected in these datasets. It has been reported that performance obtained with algorithms on traditional digitizers in a static environment suffers significant deterioration when used on a mobile platform where users were holding the device instead of it being in a Fixed position [29]. The performance may further degrade when online signatures are acquired without supervision as opposed to those in public datasets which were typically supervised. This section describes an experimental study to evaluate the performance of the proposed system while using a dataset comprising of signatures collected from user owned devices taken over a sufficient time window in an unsupervised, uncontrolled setting.
A. Data Collection Procedure
The process for data collection began by recruiting users from a departmental mailing list by sending a brief description of the experiment and offering a $10 dollar gift card to those who participate. Users who
volunteered, were asked to create an online account with an email address, username and password on a webpage. The system then immediately took them to an introduction page that briefly described the purpose of the experiment and the procedure they would be expected to follow. An example signature was provided but no other instruction was given on the type of signature they should create. However, they were motivated to provide quality signatures by rewarding the top ten users with the most consistent samples over the entire experiment with an additional $40 gift card. Then the user was asked to create a signature and draw it five times on the screen. Visual feedback was provided so the user could see the signature they drew. All signatures were performed on the user’s personal devices.
An experimental protocol was designed to capture time variation effects in user signature input over the course of approximately seven days. After the first session, multiple sessions of data collection were performed where a user entered his signature 5 times for each session. At the end of each session, the screen was locked and the user was instructed to wait for a time period after which a reminder to perform the next session would be sent to his email address. The minimum time interval between each of the sessions and its immediate successor was twelve hours for the Þrst and second, the second and third, and the third and fourth sessions. The minimum time intervals imposed between the fourth and the Þfth, and between the Þfth and the last session were 96 hours and 24 hours respectively. The time intervals between sessions were chosen to introduce variation in times of the day when the signatures were performed and hence the context they would be performed under.
During the experiment, if a user forgot his signature, he was provided with two options. First, he could reset the account and redo the process from the beginning. Second, he could click the forgotten button and the system would show his previous signature on the screen. In this case, he would be prompted to clear the screen before he could enter his new signature. This was to prevent a user from tracing his own signature thereby increasing consistency artificially.
ISSN : 2394-2231
http://www.ijctjournal.org
Page 144
user in the form of piecewise linear curve between thepair of drawing point in real time. For each signature, the data consisted of series of x-y coordinates and time-stamps.
B. Signature Characteristics
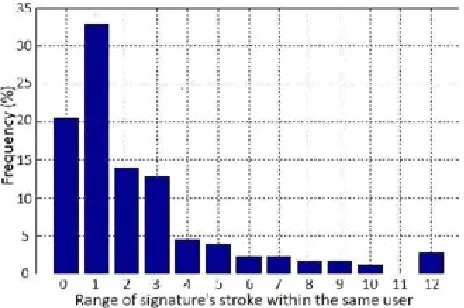
This subsection provides some characteristics of signatures that were collected. These characteristics included the length (number of points) and the number of strokes in the signature. A stroke in this study is defined as a sequence of touch points beginning from touch-down event to the next touch-up event. Figure 5 shows the distribution of signature lengths, the distribution of signature strokes and the distribution of the difference in the number of signature strokes within the same user. It is seen from Figure 5 that signature length varies significantly from user to user whereas the average length of a signature was 142.11 with a standard deviation of 85.67. Different signatures were also comprised of various numbers of strokes. Generally, the number of strokes can be influenced by the language and writing styles of users. In addition, it can also be caused by discontinuity of interaction between the hardware sensor and the input device (Fingertips in this case.) In this experiment, the users were recruited from the mailing list of a university where English is used as the first language.
Fig. 5. Characteristics of online signatures in the dataset. (a) The distribution of signature lengths. (b)
The distribution of signature strokes. (c) The distribution of the difference in the number of
ISSN : 2394-2231
http://www.ijctjournal.org
Page 145
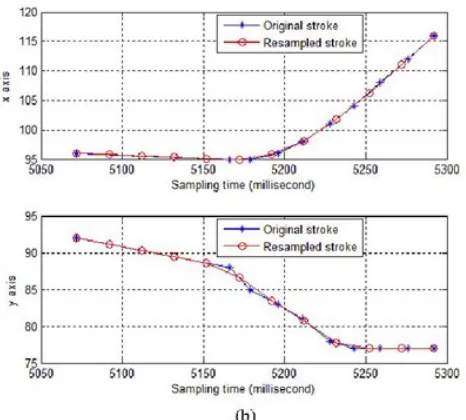
Fig. 6. A part of an online signature example before and after time normalization. (a) x-y coordinates. (b)
x-t and y-t coordinates.
Nevertheless, the variation in the number of strokes from user to user is noticeable. On average, a signature had 3.38 strokes with a standard deviation of 2.28. In addition, we observed that the number of strokes were often not consistent even within the same user. On average, the number of strokes varied by 3.5 over the entire set of 30 samples taken from the same user. Only 20% of the users had a consistent number of strokes across all samples. Therefore it is important that an online signature Verification system for mobile devices should be designed such that it is robust to signatures with varying number of strokes.
C. Signature Preprocessing
The variation in the number of strokes per signature and sampling rate introduced in the dataset can affect Verification performance. Hence, all signatures were pre-processed by time normalization and stroke concatenation before extracting histogram features. Details of the time normalization and stroke concatenation steps used are as follows.
1) Time Normalization: When a signature is acquired
from typical touch sensitive computing devices (iOS device in this case), it is typically sampled with non-uniform rate. The rate depends on the availability of computational resources at a given time as well as the latency of network connection. Therefore, time normalization was used in order to derive a uniformly sampled signature. This helped to minimize the variation of signatures due to different sampling rates. The process used was as follows.
Let S = {v1, v2 , . . . , v N } be
an online with a sequence of N strokes
signature where
each stroke v¤i = {(x1i, y1i), . . . , (xMi , yMi )} is asequence of touch points (x
j , yj ) sampling at time T = {ti, . . . , ti }.
1 M
The normalized stroke
si
was computed by interpolating the stroke vi at T = {t
i , ti + R, ti + 2 R, . . . , t 1i + tMi−t1 i
× R}.
1 1 1 R
An example of a normalized stroke is depicted in Figure 6. After the process, all time-normalized signatures have a Fixed sampling rate of 50 times per second, or 20 milliseconds apart.
2) Signature Stroke Concatenation:
ISSN : 2394-2231
http://www.ijctjournal.org
Page 146
Fig. 7. Illustration of signature concatenation process. (a) A part of a signature with multiple strokes. (b) The same part after stroke concatenation
ALGORITHM:1 Signature Stroke Concatenation
Let S = {s1, s2 , . . . , sN } be an online signature h a sequenceof normalized strokes where each stroke si = {(x1i, y1i), . . . , (xMi , yMi )} is a sequence of touch points (xj ,
yj ) with length M . The immediately succeeding stroke is concatenated to the main stroke by translating the origin of the latter stroke to the end of the former stroke. The algorithm is as follows (see Figure 7 for illustration of the process),
D. Experimental Results
In this subsection we present experimental results using the data collection procedure and the pre-processing techniques described above. The algorithm used is the same as the one described in section 2, except two key differences. First, the histograms related to pressure information were discarded as they were not available in this dataset. Second, the additional histograms from Table V are empirically added as they provide higher recognition accuracy when incorporated.
1.Impact of Signature Aging and Effectiveness of Cross-Session Training Strategy: The objective of collecting the dataset over six separate sessions was to study tem-plate aging issues in online signatures, as well as to study whether training samples from multiple sessions can better represent within-user variation thereby enhancing Verification performance. In this context, first the performance of online signature Verification when training and test samples are drawn from the same session is reported in Table VI. Note that the results are the average performance from leave-one-out cross validation test. That is, the classifier is trained from all the samples from the same users but one, and each and every sample is used as a positive sample exactly once. The result shows that Verification performance of the system when the training and test samples are from the same sessions is just slightly lower than that of public datasets given in section 3.
Table v Descriptions of additional histograms that are used in the dataset collected from mobile device
Table Vi The Verification Performance (EER) Of Intra-Session Experiment Using Leave-One-Out Cross
Validation
This is an encouraging result given that all signatures in this dataset were collected in an uncontrolled, unsupervised setting, without pressure information, and they were drawn using a Fingertip, not a stylus.
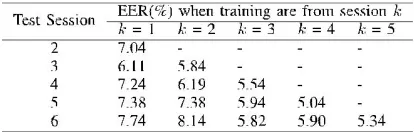
However, biometric performance can be affected severely by the template aging problem as reported in many bio-metric modalities, namely, iris [31], [32], pericular [33], ECG signal [34], and speech [35]. To understand the aging problem of online signatures, the performance results, when a signature template is trained using samples from one session was used to verify samples from a different session, are reported in Table VII. It is seen that the performance when training and test samples are from different sessions noticeably deteriorates as compared to when they are from the same session. SpeciÞcally, with training samples from session 1 and test samples from session 2, the error rate in terms of EER increases from 3.18% to 7.04% as compared to when training are from session 2.
Table Vii The Verification Performance (Eer) When The Training And Test Samples Are Drawn From
ISSN : 2394-2231
http://www.ijctjournal.org
Page 147
Table Viii The Verification Performance (Eer) When The Training Samples Are Drawn From N Immediately
Preceding Sessions
It is also observed that the best performance in inter-session Verification is obtained when the classifier is trained using samples from the preceding session. For example, the best Verification performance of samples from session 6 is achieved when the training is from session 5. This suggests that a template updating mechanism should be in place in order to retain system reliability. Interestingly, for short-term effect, i.e., approximately one week, the time interval between the training and the test sessions seemed to have little influence on the performance. Specifically, the Verification performance of the fifth session, which was at least four days apart from the previous session, did not deteriorate as compared to other sessions.
In terms of training strategies, previous work on ECG [34] and speaker Verification [35] has shown that cross-session samples can be used to improve biometric performance. That is because they can accommodate within-user variation better than those from a single session. In order to evaluate the effectiveness of this training strategy on an online signature modality, a user’s online signature template was trained using samples from multiple sessions instead of those from a single session. The results for multiple sessions training are given in Table VIII. In general, there is a significant improvement of Verification performance when training samples are drawn from multiple sessions instead of a single session. Specifically, training a user’s signature template with samples from two sessions improves the EER to 3.27%, on an average, as compared to 5.76% when training samples are drawn from one session. Note that, while collecting enrolled samples from a user over multiple sessions is not a user-friendly option, one could possibly devise a procedure to collect samples with more realistic intra-user variation from a single session. One scenario involves interrupting users with a short interactive activity.
Fig. 8. Distribution of HTER (Half Total Error Rate), FAR, and FRR when training samples are drawn from
sessions 1 and 2.
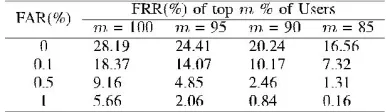
TABLE IX The Average False Rejection Rate (FRR) For The Top N% Users When False Acceptance Rate (Far) Is Fixed For Each User At Different Level And Training
Samples Are Drawn From The Preceding Session
TABLE X The Average False Rejection Rate (FRR) For The Top N% Users When False Acceptance Rate (Far) Is Fixed For Each User At Different Level And Training Samples Are Drawn From The Two Preceding Sessions
Further effort in designing such enrollment procedure that better captures intra-user variation is left for future work.
2) Adaptive Thresholding: It is known that the score
distribution of biometric samples differs from user to user. Consequently, the resulting FAR of different users with respect to the same threshold is different. This can be seen from Figure 8 which depicts FAR, FRR and HTER (Half Total Error Rate between FAR and FRR) of each individual when a global threshold that corresponds to the corresponding EER is applied. However, as far as security is concerned, FAR should be kept very low for each and every user. The performance in this case can be theoretically realized by adjusting the threshold for each user individually according to the desirable FRR. Tables IX and X report the system performance with
TABLE XI Successful Zero-Effort Impersonation Rate Of The Top Three Users With Respect To Different Far
ISSN : 2394-2231
http://www.ijctjournal.org
Page 148
Table Xii the Top Three Most Popular Pins and Their Frequencies [36]
Such a threshold selection strategy in terms of the average FAR derived from the top n% of users with respect to different FRRs. The training samples in these two tables are from one and two preceding sessions respectively. Note that, in practical applications, this empirical decision threshold can be estimated by using the pool of signatures in the database where each signature is represented by a feature vector.
3) Security Against Zero-Effort Impersonations: This experiment was conducted in order to analyze the security of signatures against zero-effort impersonations and compare it against that of 4-digit PINs. For 4-digit PINs, if all users choose their 4-digit PINs at random, guessing a PIN of an unknown user with each and every PIN number would result in the same success rate at 0.01%. However, in practice, some PINs are chosen much more frequently than the others. In Table XII, the three most popular four-digit PIN and their frequencies are presented. An attacker could maximize the success rate of guessing a PIN of a random user by choosing the most popular one, i.e., Ô1234Õ.
Similarly, given that users can choose their signatures freely, some users might choose similar signatures. That is, their signatures may form a cluster in a speciÞc feature space. Consequently, an attacker could maximize the chance of successful impersonation by mimicking a signature of the user that belongs to a cluster with a large number of users. To evaluate clustering characteristic of online signatures, we derive a success rate of zero-effort impersonation for each user when his signatures are used as impersonation samples against all other users.
Table XI presents the top three users with the highest success rate for zero-effort impersonation in different FAR levels. While the success rate of guessing user’s 4-digit PINs with Ô1234Õ is at 10.71%; the success rate of impersonating other users by signatures from the user with the highest potential is lower at 4.66% for 1% FAR. The rate is lower at 2.38% and 0.48% for 0.5% and 0.1% FAR, respectively. That is, online signatures are distributed more evenly than four-digit PINs. As a result, they can better protect users against guessing attack as compared to four-digit PINs when there is no password blacklist policy enforced against common pins.
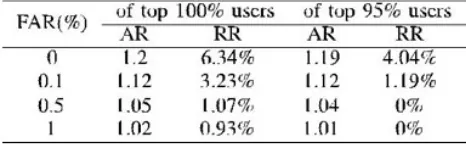
TABLE XIII Attempt Rate (AR) And Rejection Rate (RR) Of The Proposed Online Signature Verification System When Training Samples Are Drawn From Sessions 1
And 2 While Test Samples Are From Session 3
4) Authentication Effort and Performance: Verification performance is one of the key factors that influence the usability of an authentication system. In particular, false rejection can lead to either an increase in the number of authentication attempts or user rejection and temporary lockout. While both cause usability issues, the recovery effort of the latter is more time-consuming than the former. Assuming that three failed attempts are allowed before rejecting and temporarily locking out users, rejections of genuine signatures are classified into two categories. These are failed attempts and user rejections. The Þrst type leads to an increase in average number of attempts for successful authentication while the second one leads to an increase in user rejection rate. That is, the attempt rate is defined as,
Attempt Rate (AR) =
# Total Attempts
(7) # Successful logins
and the user rejection rate is defined as, Rejection Rate (RR)
=
# Authen. Failures
(8) # Authen. Failures + # Successful logins
Table XIII reports an average number of attempts as well as user rejection rates at different FAR levels. Note that, in this experiment, the signatures are verified in a circular and timely order. If a signature is rejected for the first time, at most two consecutive failures can be made before the attempt is counted as a user rejection. Also, if the last signature is rejected, two more chances are given to the next two samples in a circular order. On the other hand, if a signature is accepted, the attempt is counted as successful and the number of trials before succeeding is recorded. The results show that the rejection rate, or authentication failure, is greatly reduced from the FRR reported earlier in Table X. That is because, in many cases, the users can recover from failed attempts within the next two attempts. However, similarly to any other traditional authentication system, authentication failures are inevitable and the system should always have a secure and proper backup authentication mechanism in place.
ISSN : 2394-2231
http://www.ijctjournal.org
Page 149
This paper proposes a simple and effective onlinesignature Verification system that is suitable for user authentication on a mobile device. The benefits of the proposed algorithm are as follows. First, a histogram based feature set for representing an online signature can be derived in linear time and the system requires a small and Fixed-size space to store the signature template. In addition, since the feature set represents only statistics about distribution of original online signature attributes, the transformation is non-invertible. As a result, the privacy of the original biometric data is well-protected. Second, a specific classifier comprising of a user-specific quantization step size vector and its associated quantized feature vector can be trained using only enrollment samples from that user without requiring a training set from a large number of users. Several experiments performed on MCYT and SUSIG datasets demonstrate effectiveness of the proposed method in terms of Verification performance as compared to existing algorithms.
A new dataset was collected for evaluating system performance of user authentication on a mobile device. Signatures in this dataset were drawn using a Fingertip in an uncontrolled setting on user owned iOS devices over six separate sessions. Experimental results on this dataset provide similar performance as older dataset on stylus based devices and controlled environments. This shows that finger drawn signatures are plausible candidates for user authentication on mobile devices. The experiments also indicated that the well know template aging problem of online signatures is very relevant to the context of user authentication. That is, it was observed that the older the training samples as compared to the test samples, the lower the Verification performance of the online signature classifier. This suggests that template updating mechanism is needed in order to stabilize the performance. Also, a significant inter-session Verification performance improvement when a classifier is trained using cross-session samples, as compared to the one trained from a single-session samples, implied that
samples from multiple session can reflect a more accurate intra-user variation. Last but not least, security analysis of online signature Verification system as compared to that of 4-digits PIN, and two usability metrics is also presented.
One interesting area for future work is the design of an enrollment protocol that can capture a intra-user variation effectively within a single session. In addition, it is currently possible to match different signature templates generated from the same online signature samples and thereby learn that two leaked biometric templates belong to the same user. Further investigation includes the use of other biometric key binding approaches, like fuzzy commitment, in order to strengthen security of the system, even when stored tem-plates, helper data etc., are compromised, while preserving Verification performance. Lastly, it is possible to derive a
fusion approach by combining the proposed method with other existing approaches, e.g., DTW, HMM-based, etc., in order to improve Verification performance, especially for applications where privacy of the signature traits is less critical.
APPENDIX
DEPENDENCY OF VERIFICATION PERFORMANCE
On Histogram Parameters
The histogram feature configuration in Table I is parameterized by several key factors and their modification could impact the Verification performance of the system. These include the number of bins for each histogram and the inclusion of each histogram in the feature set. In order to elaborate the effect of these parameters towards Verification performance, the performance result when modifying the parameters is presented in Table XIV. First, to analyze the contribution of each histogram towards Verification performance, an experiment to iteratively remove the histogram with the least contribution is performed and the results are reported. In this case, the initial set of features consists of all attributes from all histograms described in Table I, and the performance in this case is reported as a baseline. In addition, the performance when each of the histogram is solely applied as a feature set is also reported. These histograms are derived at three different resolutions: 1) the one described in Table I, 2) 50% decrease from 1), and 3) 50% increase from 1).
ISSN : 2394-2231
http://www.ijctjournal.org
Page 150
of skill forgery increases but that of random forgerydecreases.
Future work to examine a method that can select those parameters holistically and optimally for both skill forgery and random forgery cases is warranted. Noting that, in this work, these parameters are defined experimentally on MCYT dataset and are used as an example of working configurations to demonstrate effectiveness of histogram features for online signature Verification application against other datasets.
1. A. Fallah, M. Jamaati, and A. Soleamani, ÒA new online signature Verification system based on combining Mellin transform, MFCC and neural network,Ó Digital Signal Process., vol. 21, no. 2, pp. 404Ð416, 2011. 2. L. Findlater, J. O. Wobbrock, and D. Wigdor, ÒTyping
on ßat glass: Examining ten-Þnger expert typing patterns on touch surfaces,Ó in Proc. Annu. Conf. Human Factors Comput. Syst., New York, NY, USA, 2011, pp.2453Ð2462.
3. N. Sae-Bae, K. Ahmed, K. Isbister, and N. Memon, ÒBiometric-rich gestures: A novel approach to authentication on multi-touch devices,Ó in Proc. CHI, 2012, pp. 977Ð986.
4. N. Sae-Bae, N. Memon, K. Isbister, and K. Ahmed, ÒMultitouch gesture-based authentication,Ó IEEE Trans. Inf. Forensics Security, vol. 9, no. 4, pp.568Ð582, Apr. 2014.
5. L. G. Plamondon and R. Plamondon, ÒAutomatic
signature Verification and writer identiÞcationÑThe state of the art,Ó Pattern Recognit., vol. 22, no. 2, pp. 107Ð131, 1989.
6. H. Feng and C. C. Wah, ÒOnline signature Verification
using a new extreme points warping technique,Ó Pattern Recognit. Lett., vol. 24, no. 16, pp. 2943Ð2951, 2003.
7. A. Kholmatov and B. Yanikoglu, ÒSUSIG: An on-line signature data-base, associated protocols and benchmark results,Ó Pattern Anal. Appl., vol. 12, no. 3, pp. 227Ð236, 2008.
8. J. Ortega-Garcia et al., ÒMCYT baseline corpus: A bimodal biometric database,Ó IEE Proc. Vis. Image Signal Process., vol. 150, no. 6, pp. 395Ð401, Dec. 2003.
9. L. Nanni, ÒAn advanced multi-matcher method for
on-line sig-nature Verification featuring global features and tokenised random numbers,Ó Neurocomputing, vol. 69, nos. 16Ð18, pp. 2402Ð2406, 2006.
10. D. Guru and H. Prakash, ÒOnline signature Verification and recognition: An approach based on symbolic representation,Ó IEEE Trans. Pattern Anal. Mach. Intell., vol. 31, no. 6, pp. 1059Ð1073, Jun. 2009. 11. J. Galbally, M. Martinez-Diaz, and J. Fierrez, ÒAging in
biometrics: An experimental analysis on on-line signature,Ó PLOS ONE, vol. 8, no. 7, p.e69897, 2013.
12. M. Faundez-Zanuy, ÒOn-line signature recognition
based on VQ-DTW,Ó Pattern Recognit., vol. 40, no. 3, pp. 981Ð992, 2007.
13. J. Fierrez, J. Ortega-Garcia, D. Ramos, and J.
Gonzalez-Rodriguez, ÒHMM-based on-line signature
Verification: Feature extraction and signature modeling,Ó Pattern Recognit. Lett., vol. 28, pp. 2325Ð2334, Dec. 2007.
14. E. Maiorana, P. Campisi, J. Fierrez, J. Ortega-Garcia, and A. Neri, ÒCancelable templates for sequence-based biometrics with application to on-line signature recognition,Ó IEEE Trans. Syst., Man, Cybern. A, Syst., Humans, vol. 40, no. 3, pp. 525Ð538, May 2010. 15. E. Maiorana, P. Campisi, and A. Neri, ÒTemplate
protection for dynamic time warping based biometric signature authentication,Ó in Proc. 16th Int. Conf. Digital Signal Process., Jul. 2009, pp. 1Ð6.
16. L. Nanni, E. Maiorana, A. Lumini, and P. Campisi, ÒCombining local, regional and global matchers for a template protected on-line signa-ture Verification system,Ó Expert Syst. Appl., vol. 37, pp. 3676Ð3684, May 2010.
17. M.-H. Lim, A. B. J. Teoh, and K.-A. Toh, ÒAn efÞcient dynamic reliability-dependent bit allocation for biometric discretization,Ó Pattern Recognit., vol. 45, no. 5, pp. 1960Ð1971, 2012.
18. Y.-J. Chang, W. Zhang, and T. Chen, ÒBiometrics-based cryptographic key generation,Ó in Proc. IEEE ICME, vol. 3. Jun. 2004, pp. 2203Ð2206.
19. J. Fierrez-Aguilar, L. Nanni, J. Lopez-Pe–alba, J. Ortega-Garcia, and D. Maltoni, ÒAn on-line signature Verification system based on fusion of local and global information,Ó in Audio- and Video-Based Biometric Person Authentication (Lecture Notes in Computer Science), vol. 3546. Berlin, Germany: Springer-Verlag, 2005, pp. 627Ð656.
20. [20] E. Argones Rua, E. Maiorana, J. Alba Castro, and P. Campisi, ÒBiometric template protection using universal background models: An application to online signature,Ó IEEE Trans. Inf. Forensics Security, vol. 7, no. 1, pp.269Ð282, Feb. 2012.
BIOGRAPHIES