Thesis report for the degree of Master of Science in Industrial Engineering and Management
Specialization: Production and Logistics Management
M.M. Teshome s1022660
Examination Committee:
Dr. A. Al Hanbali Dr. P.C. Schuur J.E. Parada Puig
August 2012
aspect for customers of these companies, which makes this availability a key aspect for the success. For the Netherland Railways (NS) that run multiple train units in rail network, predicting and keeping a required level of fleet availability is a challenging task. The stochastic nature of train breakdowns and the corrective maintenance to fix them are problems to keep track of availability of the fleet. If more trains are withdrawn from a fleet due to failure, the fleet operator, NS cannot provide the required transportation capacity to cover the scheduled services. To enhance the availability of the fleet, NS keeps a large fleet of trains. Each day NS keeps 200 operational and 3 cold standby trains in one of their service region. Standby trains are spare trains available in case of one of the operational trains fail. However keeping a high number of spare trains each costing about 2 million Euros is not economical.
The different challenges at NS lead to the following problem statement: Given a repairable fleet of trains with cold standbys how do we model mathematically the long run fleet availability.
To solve this problem a mathematical model has been created. The model was created using a method where a Markovian analysis is applicable to present the operation of the fleet system. It was designed to establish relationships between system availability, number of cold standby trains, failure rate and repair throughput time of the repair facility.
The created model plans to evaluate the key performance indicators of the fleet system. The key performance indicators of the fleet that are included are:
Steady state fleet availability (SSA), The mean time to failure (MTTF) and The mean time to recover (MTTR).
consequence for the results is that they might not match reality exactly. However, although the results might differ from reality, the effects of different types of decisions can still be derived from the results.
The developed program accepts the fleet size ( ), the number of spare trains ( ), the failure rate ( ), the repair rate ( ), and the number of repair facilities ( as an input and produces all the values of the key performance indicators as an output. The size of the input values can be of any arbitrary number. Regardless of the size of the input, our program can perform well with a reasonable time. The model is computationally efficient. The program generates graphs of the steady state availability as a function of number of failed trains and Fleet availability as a function of number of standby trains.
To obtain more managerial insights different scenario analyses have been done. For any given failure rate of a fleet the impact of varying the repair parameter was examined in relation to the associated numbers of spare trains. The model illustrates that the relationships between the failure rate, the number of spare trains, the repair throughput time and the corresponding relative utilization of the repair facilities, provide useful criteria for evaluating the availability of the fleet system. For one of the scenario, even with high number of spares the rate of output of the repair facilities being less than the average rate of failures doesn’t improve the fleet availability. In addition, the system is likely to prove uneconomic.
For the other scenario where the rate of output of the repair facility being greater than the failure rate, by increasing the number of cold standby trains significant improvement in fleet availability can be obtained.
The values of the parameters concerning the fleet availability at NS were inserted and a result using the Matlab algorithm was generated. The result demonstrated that for a fleet size of 200 trains and with 2 repair facilities keeping more than 2 standby trains is an over estimation. The evaluations show that with 2 cold standby trains the average fleet availability almost reaches 100%. This has an improvement potential of one train per the given region (33 %), which is about 2 million Euros. Our model can be also used to compute the fleet availability of the remaining service regions of the NS.
university of Twente, The Netherlands. It took almost 7 months to make this project and this is the result of all efforts and hard work that I spent. I would like to thank NedTrain for giving me the opportunity to make this master study. I could not do this project without the help of some specific people.
First and most I would like to thank my mentor and first supervisor Ass. Prof Ahmad Al Hanbali. During the many discussions, we had on the different subjects concerning my thesis, his critical view, continuous feedback and comments have played the most important role in shaping up this work.
I would also like to thank my second supervisor Associate prof. Peter Schuur for making time to discuss my work and asking questions that helped me improve my work.
Further, I would like to thank Jorge E. Parada Puig. From the very beginning of my project, the discussions with him helped me to get a clear view on the processes at NedTrain and translate this into a model. I would say his enthusiasm, knowledge and experience helped me a lot in my study.
I would also like to thank Rob Basten and Bob Huisman for their support, feedback, and suggestions during the project.
Next, my deepest gratitude goes to my friends Ferry Kristanto, Workneh Chekol, Tesfahun Aregawy and Abelneh Teka for their continuous encouragement and moral support.
Finally, I would like to extend my special thanks to my family. I am forever grateful for their prayer, undying love and unconditional support.
Melkamu Teshome Enschede
DISCLAIMER
1. Introduction ... 5
1.1. Company description NS ...5
1.2. Ned Train ...8
2. Description of The research ...10
2.1. Reliability and availability of a rolling stock ... 10
2.2. Relation between reliability and availability according to norm EN 50126 ... 10
2.3. Reserach Description ... 13
2.4. Research Relevance ... 14
2.5. Research Questions and Research Methodology ... 14
2.6. Research Scope and Assumptions ... 16
2.7. Research Deliverables ... 17
2.8. Thesis Outline ... 17
3. Literature Review ...18
3.1. Introduction ... 18
3.2. Literature review and description of models ... 18
3.3. Conclusions ... 21
4. Model Formulation ...22
4.1. Introduction ... 22
4.2. Model descriptions and assumptions ... 22
4.3. Problem Solution ... 25
4.4. Key Performance Indicators (KPIs)... 27
4.5. Computer Implementation ... 31
4.6. Conclusions ... 31
5. Analysis and Illustration of the Model Outputs ...33
5.1. Introduction ... 33
5.2. Case I ... 33
5.3. Case II ... 37
5.4. Numerical Evaluation of Nedtrain’s Scenario ... 41
5.5. Model validation ... 43
6. Conclusion and Recommendation ...44
7. ALgoritihm ...46
8. Appendix ...49
8.1. Organizational Structure of Nedtrain ... 49
8.2. Performance indicators (PI) and Service Level Agreement between NSR and NedTrain... 50
8.3. Failure Categories ... 52
8.4. Summary of Articles ... 53
Figure 1.1 NS divisions
Figure 1.2 Dutch network and passenger operators Figure 1.3 NedTrain maintenance levels
Figure 2.1 Quality of service and Railway RAMS Figure 2.2 Research Methodology
Figure 4.1 Model Design
Figure 4.2 State transition diagrams for repairable fleet system Figure 4.3 State transition diagrams from the short mode state Figure 5.1 Fleet availability with standby spares for Figure 5.2 Expected numbers of failed trains for Figure 5.3 Fleet availability with standby spares for Figure 5.4 Expected numbers of failed trains for Figure 5.5 Fleet availability with standby spares for Figure 5.6 Expected numbers of failed trains for Figure 5.7 Fleet availability with standby spares for Figure 5.8 Expected numbers of failed trains for Figure 5.9 Fleet availability with standby spares for Figure 5.10 Expected numbers of failed trains for Figure 5.11 Fleet availability with standby spares for Figure 5.12 Expected numbers of failed trains for Figure 5.13 Fleet Availability with standby trains Figure 5.14 Expected numbers of failed trains Figure 5.15 Mean Time to Failure for the fleet Figure 5.16 Mean Time to Recover for the fleet
Table 8.2.1 Performance indicators Table 8.3.1 RAMS failure categories Table 8.4.1 Transit systems
1.
INTRODUCTION
This thesis is the graduation project to the Master of Science in Industrial Engineering and Management.
Section 1.1 provides the reader with an introduction to the Netherlands Railways and its subsidiaries. In Section 1.2 one of the main holdings of the NS group and the problem owner of this research, NedTrain is discussed.
1.1. Company description NS
Nederlandse Spoorwegen (NS, or the Netherlands railways in English), a state owned company founded in 1938 is the principal passenger railway operator in the Netherlands. Following the 1990s European Union regulations which included the need for formal separation of the national railways from governments and into separate companies, NS began to be separated into two main divisions. One of the division deals with the infrastructure, and the other one deals with the transport activities. Officially, NS was transferred into an independent company in 1995. However, 100% of their shares are still owned by the government, but the government has little direct influence on the policies of the company. This is due to the fact that shareholders can not dismiss the executive board. However, there are still financial and political ties between the government and NS, such as the Performance Contract (Vromans, 2005). The organizational structure of the NS group is presented in Figure 1.1. Following the explanation of the NS divisions, the performance contract between NS and The Ministry of Transport is explained.
The NS divisions that are involved directly or indirectly in the passenger transportation activities are:
NS Reizigers (NSR): this is one of the core business groups of NS and it operates the trains in the main Dutch railway network.
NS Poort: is in charge of the operation of all 390 railway stations in the Netherlands, i.e., also those served by other railway companies than NS Reizigers.
Abellio: is the international expansion of NS, making public transport contracts in Europe.
NedTrain: is one of the core business entities responsible for the availability, safety and quality of the rolling stock. For this reason, NedTrain provides a wide range of services from maintenance and cleaning to conversion, overhaul and rolling stock1 innovation.
Strukton: is another subsidiary of NS responsible for railway construction. NS Financial Services Company (NSFC): based in the Ireland, owns the
significant part of the rolling stock and it leases them for railway operators.
Passenger Transportation Abelio NedTrain NS Hispeed NS Reizigers (NSR)
Branch point Development and Exploitation NS Poort
Rail infrastructure and Construction Stukton
NSFC Supporting
Companies and Associates
NS Group
Figure 1.1 NS divisions
Every day NS handles more than 1.2 million passenger journeys. This covers the most part of the country, with almost all cities connected, mostly with a service frequency of two trains an hour or more (and at least four trains per hour between all of the main cities)2.The crisscrossed network of the different train lines along the
390 stations makes sure that almost more than 80% of the passenger trips is made without transfer. NS have over 32,000 employees and a total turnover of €3.628 billion in 20113.
1
Rolling stock comprises all the vehicles that move on a railway. It usually includes both powered and unpowered vehicles,for example locomotives, railroad cars, coaches and wagons
2
3 March 2012 <http://en.wikipedia.org/wiki/Nederlandse_Spoorwegen>
3
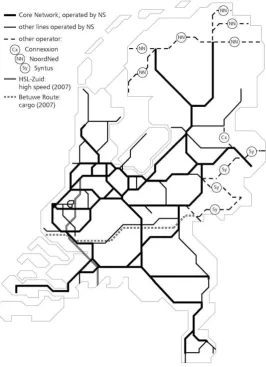
The so-called Performance Contract between the Ministry of Transport and NS gives NS the exclusive right of operating passenger trains on the core network until 2015. Figure 1.2 shows this core network. In return, NS have to offer a minimal service frequency, and they have to achieve a certain percentage of on time arrivals of their passenger trains. NS will incur a fine if this percentage is not achieved. On the other hand, they will receive a premium when they can increase the number of passengers during the morning rush hours. Furthermore, upper limits on ticket prices are defined in the contract. Both the performance contract and the agreement on price increase contain explicit punctuality figures for NS. By reaching those punctualities, NS avoid penalties and further price increases are allowed (Vromans, 2005)
1.2. Ned Train
After the privatization of the state owned NS in the 1990’s, NedTrain was founded not only to comply with the EU Directive and NS's strategy, but also to take advantage of the Dutch Government's desire to create competition in both passenger and freight transport by offering an independent locomotive and rolling stock maintenance and repair facility. The history of NedTrain goes back to 1839, the very beginning of railroad transportation in The Netherlands. NedTrain considers itself as one of the best specialists in maintenance of rolling stock in Europe. The core competence of NedTrain is rolling stock maintenance in all its aspects during the whole life cycle of the operator’s assets. The main office is located at Utrecht. Over 3500 employees work on 24/7 basis at more than 30 locations around the Netherlands to keep the NS fleet up and running. In 2010, NedTrain generated a total turnover of €470 million. The management of NedTrain consists of the board of directors and the divisions presented in the Appendix. In the following section, we will discuss the NedTrain’s maintenances levels and its logistic support infrastructures. The section is based on Huisman (2010).
1.2.1. NedTrain Maintenance Levels
NedTrain maintains, cleans and overhauls rolling stock. It overhauls components such as wheel sets, bogies and engines or even complete trains. In addition, it refurbishes train interiors. It also fixes complicated safety systems and repairs damage, takes care of re-railing, technical maintenance and fault repair. The maintenance activities encompass four levels of maintenance, which are spread over a number of sites across the country.
First-line service: This is a location where all the trains stay overnight. In the first line, service trains are inspected, repaired and cleaned at least once every day. Minor technical problems are solved. If problems are beyond minor technical problems the train will be sent to the maintenance depot.
Maintenance depot: After a certain mileage has been reached on a main part or if major technical problems occur, a train goes to depots for maintenance.
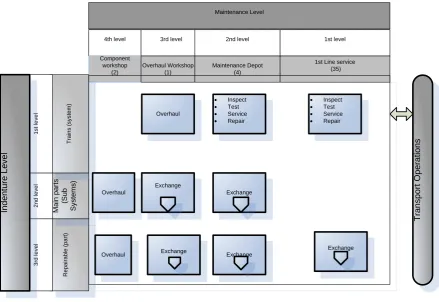
support infrastructure. The squares in the figure represent the activities performed within the specific maintenance level at specific rolling stock indenture level. The triangles represent stock points of the spare parts that can be exchanged at this level. The number of sites at each maintenance level is shown between brackets.
Maintenance Level
4th level 3rd level 2nd level 1st level
Component workshop (2) Overhaul Workshop (1) Maintenance Depot (4)
[image:15.595.87.527.200.502.2]1st Line service (35) R e p a ir a b le ( p a rt ) M a in p a rt s (S u b S y s te m s ) T ra in s ( s y s te m ) 3 rd l e v e l 2 n d l e v e l 1 s t le v e l In d e n tu re L e v e l Overhaul Inspect Test Service Repair Inspect Test Service Repair Overhaul Exchange Overhaul Exchange Exchange Exchange Exchange T ra n s p o rt O p e ra ti o n s
2.
DESCRIPTION OF THE RESEARCH
In Section 2.1 reliability and availability of a rolling stock is discussed. In Section 2.2, relation between reliability and availability according to the Norm EN 50126 is presented. In Section 2.3, the research description and research objective relevant for NedTrain will be grounded. In Section 2.4, the relevance of the problem is explained. In Section 2.5 based on the research description the research questions and the research methodology will be given. In Section 2.6, we will explain the research assumptions and the scope of the project. In Section 2.7, we will indicate the expected outcome of this research. Finally, in Section 2.8 the outline of the project is presented.
2.1. Reliability and availability of a rolling stock
Reliability, availability and their mutual relationship are very important characteristics of rolling stocks. These two metrics are extremely important characteristics of every technical system, as well as subjects of the rolling stock. That is why reliability and availability are the theme of European norm EN 50126, which defines processes for specifying requirements and validations of the so-called RAMS characteristics (Reliability, Availability, Maintainability and Safety) of technical systems applied in railways. Although relation between reliability and availability of rolling stocks as technical systems is complex, it is mostly analysed to define optimal levels of reliability and availability of new or reconstructed systems related to invested financial resources (Lučanin, 2005). In the following section we provide the definition of reliability and availability according to the Norm EN 50126.
2.2. Relation between reliability and availability according to norm EN 50126
Definitions of all-important terms used in the norm EN 50126 are given in a distinct chapter at the beginning. Definitions of basic RAMS characteristics are also given. Reliability is defined as probability that an item can perform a required function
under given conditions for a given time interval.
Maintainability is defined as probability that a given active maintenance action, for an item under given conditions of use can be carried out within a stated time interval when the maintenance is performed under stated conditions and using stated procedures and resource.
Safety is defined as the state of technical system freedom from unacceptable risk of harm.
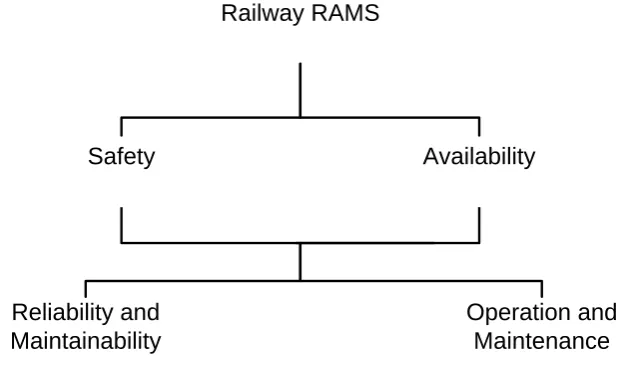
Special norm items define relations between RAMS and railway service quality and also between RAMS characteristics, i.e. elements interrelation. Railway RAMS is realised through application of established engineering concepts, methods, tools and techniques in the system life cycle and it is an important parameter of railway quality of service (Fig. 2.1).
Safety Availability
Reliability and Maintainability
[image:17.595.98.408.304.497.2]Operation and Maintenance Railway RAMS
Fig. 2.1 Quality of service and railway RAMS
Interrelation between RAMS elements of technical systems (reliability, availability, maintainability and Safety) is shown in Fig. 2.1. It can be seen from the same figure that safety and availability are output RAMS characteristics (Lučanin, 2005). Availability appears to be a more appropriate measure than reliability for measuring the effectiveness of maintained systems because it includes reliability as well as maintainability. In our research the availability characteristics is the focus of the study but the output RAMS characteristic safety is outside the scope of this project. Formulas for availability calculation of railway vehicles are given in the norm EN 50126. According to this norm, the following generally indicate the availability formula:
Where, MUT= Mean Up Time, MDT= Mean Down Time. Depending on the definitions of MUT and MDT, it is possible to have different types of availability using the same formula:
Inherent Availability, Ai
Achieved (technical availability), A a
Operational (logistic) Availability, Ao
For Inherent availability, Ai the definitions used for MUT and MDT are MUT =
MTBF (Mean Time between Failures) in hours. MDT=MTTR (Mean Time to Restore) in hours.
For Achieved (technical) Availability, the definitions for MUT and MDT are MUT= MTBM Mean Time between Maintenance (hours), MDT = MTTMa (Mean Time
To Maintain) in hours. In this case, MTTMa takes in to account the mean time required to maintain rolling stock both for preventive and corrective maintenances. Operational (logistic) Availability, the definitions for MUT and MDT are:
MUT=MTBM (Mean Time between Maintenance) for preventive and corrective in hours.
MDT= (Mean Time to Maintain) in hours. In this case, , takes in to account the mean time required to maintain the rolling stock both for preventive and corrective maintenance, including logistical and administrative delays. Another measure of availability that could be considered is the ratio of the number of rolling stock available for service in the monitored period and the whole fleet this is called Fleet Availability.
Fleet availability (FA): more specifically it is the number of rolling stock available for service and is determined by the difference between , the number of rolling stock in the whole fleet and , the number of rolling stock not available for service due to maintenance actions divided by the whole fleet , .
In this case, the formula is:
=
2.3. Reserach Description
level of fleet availability. In addition to building a general model for calculating fleet availability this specific question is also part of the motive of our research.
Therefore:
The objective of this research is to model, predict and evaluate long run availability of a fleet system consisting of operational and cold standby trains that are identical and independent.
2.4. Research Relevance
The research is relevant for several reasons. It enables a customer /operator of a rolling stock:
To specify the RAM requirements addressing long run fleet availability
To give an input for making decisions to evaluate different tenders in terms of fleet availability requirements
To gain assurance in determining the appropriate fleet size to satisfy transportation demand requirements
To gain an understanding how cold standbys will have an impact on the long run fleet availability
To determine the number of cold standby trains need to achieve certain target availability.
To determine the number of new trains to buy Secondly, it enables the main supplier of the rolling stock:
Understand the customer/operators need of long run fleet availability.
To demonstrate in a tender to show that the rolling stock offered is likely to satisfy reliability/availability contractual requirements.
2.5. Research Questions and Research Methodology
We developed the following main research question to reach the research objective.
Given a repairable fleet of trains with cold standbys how do we model mathematically the long run fleet availability?
considered as a multi -unit system consisting of operational and cold standby train units.
In order to answer this main research question we posed the following sub research questions.
1. Which relevant scientific literature is available?
Reviewing some related scientific models done in previous researches helps to evaluate, explain and integrate previous researches into the proposed research. We will search scientific databases for reliability/availability modelling of repairable multi-unit cold standby systems.
2. How can we design, or extend a model in the context of our research? After conducting a survey on previous work we will extend scientific models if available or design a new model in order to reach the research objective.
3. How appropriate is the designed model for evaluating fleet availability? This research question enables to verify and validate the designed model. At this stage of our research, we will also make numerical illustration and sensitivity analysis. We can answer this research question by answering the following sub questions:
a) How can we validate and verify the designed model? c) How can we illustrate the model?
d) How sensitive is the designed model?
1. Literature
Search 2. Model design
Model Met Requirements?
No
yes
3c. Sensitivity
Analysis
4. Discussion
and Recommendation 3a.
Verification and Validation
ok? yes No: Adjustment is needed
3b. Numerical Illustration
Figure 2.2 Research Methodology
2.6. Research Scope and Assumptions
2.7. Research Deliverables
At the end of the project the following deliverables are expected: A mathematical model to solve the problem
Solution representation and numerical illustration: The solution representation will show Steady state availability of active trains, and the impact of cold standbys on the fleet availability
A master thesis report
2.8. Thesis Outline
3.
LITERATURE REVIEW
3.1. Introduction
In this section we discuss the relevant literature for modeling the long run availability of a multi-train repairable fleet with cold standbys. In order to increase the reliability and availability of the fleet system, the concept of cold standby redundancy is employed. Cold standbys trains are spare trains which are kept for the purpose of enhancing the availability of the fleet. The cold standby trains cannot fail while they are waiting before activation. The cold standby trains moves into an operating state whenever an operating train fails. .
We mention the relevant papers in this section and give description of the existing models. To find some more background on the problem the search was made a little wider by also searching for papers focused on reliability/availability modeling of transit (transport) systems. After examining the literature available on the problem described in this report, an interesting point is that the most similar situations to the one described here are not necessarily in a rolling stock fleet. Models of other transit systems (a system of vehicles including buses) general systems like (machine repair problems, communication systems and military applications) are also considered.
To find applicable theories and information for the literature review “Reliability and availability”, “Repair”, “Multi component systems”, and “Fleet of systems” have been used as keywords. And these have been entered in main search engines to find the appropriate articles.
3.2. Literature review and description of models
Some of the other articles which describe the situation similar to our problem setting are the articles about the reliability and availability of a k-out-of-n system. A k-out-of-n: G system is an n-component system that works (or is “good”) if and only if at least k of the n components work (or are good). A k-out-of-n: F system is an n component system that fails if and only if at least k of the n components fails. Several authors have researched about the availability and reliability of k-out-of-n systems. Chung (1988) developed the steady-state availability of the k-out-of-n: G (good), vehicle fleet that describes part of the problem described in Rayapati (1985) mathematically. However, in the article some assumptions have been made that are different than the ones made in Rayapati (October, 1985). The most important difference is that it requires a minimum of k vehicles to maintain the system in operation. This makes that this situation looks like the situations described in our report and makes the article useful for our research. However, this article does not consider standbys.
The paper of Richard and Kenyon (1983) considers steady-state availability of a k-out-of-n: G system as Chung (1988) does. The only difference is that this article presents a solution and computer program for steady-state availability of general systems. Similar to other articles discussed above this article also does not consider standbys.
The article of Sivazlian (1988) gives a mathematical model of a situation very similar to the one described in this report. The differences between the two situations are: The article of Sivazlian (1988) considers warm standby spares. In our research, cold standbys are taken into account. In this article, the warm-standby spares are subjected to failure, while in our report the cold standbys are not subjected to failure before activation. However, under proper restriction warm standby problems can be reduced to cold standby problems.
The paper of Gupta (1993) presents a reliability model that considers the possibility of analysing the reliability and the availability of a multi-component warm standby redundant system. The authors formulated a mathematical model to govern the stochastic performance behaviour of the multi-unit system. Both main and standby subsystems are considered to include non-identical components in series. However, unlike our assumption the authors assume that every component of each unit can suffer from three types of failures, namely minor, major and human. In our case we assumed only the major failure. The authors also assumed an exponential failure time distribution and a general repair distribution for each type of failure. The major drawback of this article is that availability model is developed for a single system. The paper of Chung (1994) presents a stochastic analysis of a multiple unit repairable system. The system considered has K active and N standbys with R repair facilities in the presence of chance of multiple critical errors. The authors assume that the system is in a failed state when any one of the multiple critical errors has occurred or when (N+1) units (active and/or any one of the multiple non-critical errors) have failed. Failed system will be repaired with repair times which are arbitrarily distributed. Moreover, they assume that repair costs are constant which cannot be applied to our situation. But from the modeling perspective the article seems useful to our situation.
The most interesting papers that describe a position very similar to our research are the articles about the machine repair problem (MRP). The machine repairable systems with spares have been used in many situations. For example, to avoid any loss of production, the plant always keeps spare machines so that a spare machine can immediately act as a substitute when an operating machine fails. Another example of a repairable system with spares can be found in the operating room of a hospital, where standby power equipment are needed since the operating on a patient cannot be stopped when the power is breakdown. Similar examples can be found in many fields such as power stations, manufacturing systems and industrial systems, Dequa (2008). These examples perfectly describe our aspect of the problem. Therefore we can conclude that the problem we are working on can be conisdered as a machine repair problem with cold standbys.
provided reliability analysis of an n-spare system with a single repair facility. Kalpakam and Hamed (1984) obtained the availability and reliability of an n-unit warm standby redundant system. Goel and Srivastava (1975) investigated a transient behavior of an n-unit cold standby system with a single repair facility. Wang (1989) considered the reliability characteristics of a repairable system with m operating units, s warm spares and R repairmen. They obtained the expressions of the reliability and the mean time to system failure. Jain and Dhyani (1992) developed transient analysis of M/M/c machine repair problem with spares, however they considered during switching the machine is subjected to a failure. According to the Kendal’s notation the first “M” refers the arrivals are a Poisson process, the second “M” refers the Service time is exponentially distributed and the “c” refers the number of servers.
Hsieh (1995) considered the reliability characteristics of a repairable system with operating units, warm spares and one removable repairman in the facility. They obtained the expressions of the reliability and the mean time to system failure. Wang and J. K. (2003) extended this model to consider the balking and reneging of the failed units. They obtained the steady state availability and mean time to system failure. Jain ( 2004) extended the model of Wang and J. K. (2003) to analyze the repairable system in transient state by incorporating reneging behavior of the failed units. Ke (2008) examined availability characteristics of manufacturing system consisting of M operating units and S spares under the supervision of a group of repairmen. Gupta (1994) investigated machine repair problem with balking, reneging and warm spares. For cost analysis purpose, Ke J. (1994) and Hawky (2000) studied M/M/R machine repair problems with balking and reneging activities. The probabilistic analysis of a repairable machining system using warm spares with balking and reneging concepts was done by Wang ( 2003).
3.3. Conclusions
The purpose of this chapter was to find an appropriate existing fleet availability/reliability model from scientific literature.
4.
MODEL FORMULATION
4.1. Introduction
In the previous chapter, we indicated that there is no suitable model for evaluating the long run fleet availability of the rolling stock.
Therefore, we design a model from our ideas and parts from the available scientific literature. The goal of this chapter is to answer the second research question: “How can we design, or extend a model in the context of our research?” Hence, the objective of this section is to develop a model for evaluating the long run fleet availability of trains with cold spare trains. This model should be mathematically sound and competent to take the random failure of the trains as well as the variation of repair times into account. The mathematical model to be considered is illustrated based on the following assumptions. In this part of our report, for the purpose of understanding the mathematical formulation of the problem, the terms “machine” and “train” are used alternatively. We consider the fleet as a multi-train system having operating trains as well as cold spares and a repair facility consisting of parallel servers.
4.2. Model descriptions and assumptions
The following assumptions have been used for mathematical formulation of the problem:
The fleet consists of identical trains.
At most of these trains can be operating simultaneously. The rest of trains, are cold standby trains.
For an acceptable functioning of the whole system exactly trains has to be operating. When the number of operating trains is smaller than we say that the fleet is operating in a short mode.
Each train consists of different components, which can be a rather large number.
In order to simplify the model we consider only one component level, i.e. a train is assumed as a single indenture.
At the beginning of operation t = 0, it is assumed that all trains are as good as new
The time to failure and time to repair of the trains is exponentially distributed.
The life time of a train is exponentially distributed with parameter
Similarly repair time of a train is exponentially distributed with parameter . The failure time of each train is independent of the state of the other trains and the failure times are independent of the time spent in a particular state. Once a machine is repaired, it is as good as new and goes into standby or operating state.
Whenever one of the operating train fails, a standby immediately replaces it if any is available.
The switchover time from standby state to operating state, from failure to repair, or from repair to standby state is instantaneous.
Whenever an operating train fails, it is immediately sent to a repair facility where it is repaired in the order of their breakdowns.
There are identical repair facilities or repair teams available. Only one repair facility is assigned to the repair of a failed train. The time needed by any repair facility to repair any failed component is independent and is exponential distributed. Later on we distinguish two cases, namely
. . .
Operating
. . . .
Standbys
Repair Shop
…..
λ
μ
K S
1 R
Figure 4.1 Model Design
As shown above in the figure, as time passes trains will be distributed round the loop in varying proportions. For a given repair time if number of failures is below average, most of them will be waiting to be used. At other times, following a series of failures, possibly coupled with a run of repairs taking longer than average, the failed trains will be accumulated in the repair shop, either receiving or queuing for attention. But as long as not more than are failed, the fleet can continue to operate. The chance of the number of trains in the repair facility not exceeding the number of cold standbys is the operational availability.
As mentioned earlier, the fleet availability and the corresponding probability of the number of failed trains being unable to operate for a specified period are the useful performance indicators when attempting to solve this particular problem. Based on the assumptions given above, we develop a method where a Markovian analysis is used. More precisely the Markovian process is represented as a birth and the death process. For details, see the next page.
no longer possible to operate the specified number of trains meaning the fleet availability is below the target level. Clearly speaking the fleet system will be operating in a short mode when number of trains working in the field is below K.
4.3. Problem Solution
Based on the model descriptions, the system state transition is shown in Figure 4.2. At time , the fleet has just started operation with no failed trains. The numbers in the circles indicate the system states, which represent the number of failed trains that are either waiting for or are receiving repair in the repair shop. The system state is decreased by 1 whenever a failed train is repaired as good as new and increased by 1 whenever a working train becomes unoperational. As indicated above at time or called initial state, the trains are put in operation and the number of failed trains in that state is . In states 0 to all, the standby trains are used and exactly trains will be operating. The system state indicates that the fleet is in a short mode. From state to state , the number of operating trains will be below then the fleet will be also operating in short mode. The state will return to normal when the number of operating trains restored to exactly .
0 1 2 S
Kλ
μ
min (2, R)μ Kλ
min (S, R)μ Kλ
S+1 Kλ
min (S+1,R)μ
…
S+2(K-1)λ
…
(K-2)λ
S+K=N
min (N,R)μ λ
min (S+3,R)μ min (S+2,R)μ
Kλ
min (3, R)μ
Figure 4.2 State transition diagrams for repairable fleet system
The following notations are used
n : number of failed trains in the system, t : time
: failure rate of the system when there are n failed trains, 0 ≤ n ≤ N : repair rate of the system when there are n failed trains,
probability of exactly failed trains in the system at time : steady-state probability, , 0 ≤ n ≤ N
{
{
We already assumed that the lifetime distributions of the train and the repair time distribution are both exponential and the same for all the trains. We can then write: (i) The probability that a train that is working at time t will fail in the interval to is
(ii) The probability that a train being repaired at time t will become available for working in the interval to is
The Chapman-Kolmogorov equations governing the model are as follows: For
,
=
For
,
,
Where
The steady state solutions are obtained by putting
for each of the previous equations.
)
We obtain the following steady state solutions:
In general,
, this relation is useful for numerical computation of For all the conditions, is given by
∑ ( )
4.4. Key Performance Indicators (KPIs)
We derive expressions for various measures of system effectiveness. These are important steady state performance measures of the fleet system. As explained before the interest is centred upon the steady state availability, the mean time to failure and the mean time to repair of the fleet. We also provide other performance indicators which are also important to evaluate the characteristics of the fleet.
These and other important performance measures are provided in this section.
I. , probability that there are n failed trains in the system,
Where, ).
The solution for this steady state performance measure is already given in section 4.2
II. Steady-State Availability (SSA)
As the K-out-of-N system is used, the number of failed trains in the system changes. When it reaches , the system is failed and the repair facilities are utilized to repair failed trains. As soon as the number of failed trains goes down below , the system starts working again. Thus, the system state changes between up and down over time. The probability that the system is in the working state at time t is:
= ∑
As mentioned in the previous pages, although the system is allowed to operate in a short mode when the number of operating machines is below K, the target availability will not be achieved. Therefore the fleet system is considered failed as soon as the number of trains in the failed state is at least or .
III. Mean Time to Failure of the Fleet (MTTF)
Even though the system under consideration is a repairable system, we are still interested in finding the MTTF of the fleet. In this case, as the machines fail, they get repaired. Since we are interested in finding the MTTF of the system, we need to assume that state or is an absorbing state. As soon as the number of trains in the failed state at any instant of time reaches , the system is considered failed. In other words, failure states of the system are considered as absorbing states. In this way, the time to absorption represents the time to failure of the fleet.
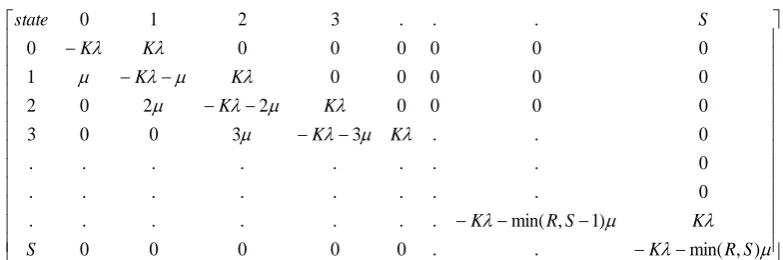
As a result, we have to assume . When the system is in state n, there are n failed components and standbys or active working trains in the system, and the failure rate of the fleet is . If the number of failed trains is less than or equal to the total number of repair facilities, all failed trains are being repaired, and thus the repair rate of the system is . However, if , will be constant and is equal to as all repair facilities are being used and some failed trains are waiting for repair. The following method by (Neuts, 1981) helps to find the distribution of TTF of the fleet.
Assuming that the initial probability in one of the states from “ ” to “ ” is given by a row vector
s a unit column vector denoted by:
1 1 . . 1 1
: ) , min( . . 0 0 0 0 0 ) 1 , min( . . . . . . . 0 . . . . . . . . 0 . . . . . . . . 0 . . 3 3 0 0 3 0 0 0 0 2 2 0 2 0 0 0 0 0 1 0 0 0 0 0 0 0 . . . 3 2 1 0 S R K S K S R K K K K K K K K K S state
Then the mean time to failure will be the product of the initial probability vector, the inverse of the generating matrix and a unit column vector, which gives;
MTTF=
IV. Mean Time to Recover (MTTR)
[image:35.595.119.511.121.251.2]The mean time to recover (MTTR) indicates the average length of time that the fleet stays in the failed states before going to the non-short state. It is the average time the fleet stays in one of the states: . In other words, it is the average time for the system to go from the first short mode state to a full working state. This can be represented by the following absorbing chain. S S+1 Min (S+1,R)μ S+2 (K-1)λ
…
(K-2)λ S+K=N Min (N,R)μ λ Min (S+2,R)μ Min (S+3,R)μFigure 4.3 State transition diagrams from the short mode state For the system initially in state S+1, denoted by probability row vector of
s a unit column vector denoted by; 1 1 . . 1 1
In addition, is the transient generator matrix represented by the following matrix. ) , min( ) , min( . 0 0 0 0 0 ) 1 , min( ) 1 ( . . . . . . . 0 . . . . . . . . 0 . . . . . . . . 0 . . . . . 0 0 4 0 . . . . . ) , 3 min( 0 3 0 . . . . ) 2 ( ) , 2 min( ) 2 ( ) , 2 min( 2 0 0 0 0 0 0 ) 1 ( ) , 1 min( ) 1 ( 1 . . . 4 3 2 1 S R N R N N S R N S R S S K R S K R S S K R S K S N S S S S State
Therefore, the mean time to recover (MTTR) will be the product of the initial probability , the inverse of the generating matrix and a unit column vector, which is given by:
MTTR=
V. Average number of standby trains upon failure of an operational train.
∑
VI. Average number of failed trains being repaired ( including the time the
system works in short mode)
∑
∑
VII. The expected number of operating trains in the system, E [O]
∑
∑
VIII. Average number of trains waiting for repair service
∑
IX. Service utilization factor of the repair facility ( Expected number of
busy repair men)
∑ ∑
4.5. Computer Implementation
The proposed model formulated in the previous section is encoded using a commercial software package. The model comprises matrix of big sizes. Therefore, the commercial software Matlab is found suitable and used to deal with the calculations.
The developed program accepts the fleet size ( ), the number of spare trains ( ), the failure rate ( ), the repair rate ( ), and the number of repair facilities ( as an input and produces all the values of the key performance indicators as an output. The size of the input values can be of any arbitrary large number. Regardless of the size of the input, our program can perform well with a reasonable time. The model is computationally efficient. For example, for a fleet size of 5000 trains it can generate the results in 45.11 seconds. The program generates graphs of the steady state availability as a function of number of failed trains and Fleet availability as a function of number of standby trains. From the model sensitivity analysis of some parameters and scenario analysis can be performed. This can provide NedTrain with information on what influence the different parameters have on the results of the model. These aspects are discussed in chapter 5. The Matlab algorithm can be found in chapter 7.
4.6. Conclusions
Finally, we modeled solutions of key performance indicators such as steady state availability, mean time to failure (MTTF) and mean time to recover (MTTR) using appropriate techniques.
5.
ANALYSIS AND ILLUSTRATION OF THE
MODEL OUTPUTS
5.1. Introduction
To obtain more managerial insights different scenario analyses have been done. For any given failure rate , the effects of varying the repair parameter is examined in relation to the associated numbers of spare trains necessary for an acceptable long run fleet availability.
This examination is realized by considering the effects of the number of spare trains and the repair throughput time or the repair rate on the fleet availability. We will consider two different cases:
I.
II. , this is similar to the practical case at NedTrain.
5.2. Case I :
This is the case with the average failure rate (i.e. the average rate of unoperational trains) is greater than or equal to the potential repair rate (R*µ). For the problem when there is an infinite supply of "potential queues", i.e. repairable trains, the solution illustrates the development of quite high number of trains waiting for repair. And this causes the fleet to reach the short mode state in a short duration of time. Hence the fleet availability will be below the target level.
We fix the failure rate and the number of operating trains working in one region to
respectively and choose the number of repair servers in the repair shop and choose three different repair rates namely, then vary the number of spare trains from to 40. We arbitrarily assumed that failure of a train or its components occurs once in a month (i.e.
. The values of the parameters K and R are obtained from NedTrain. The values of the parameter are taken such that
is satisfied.
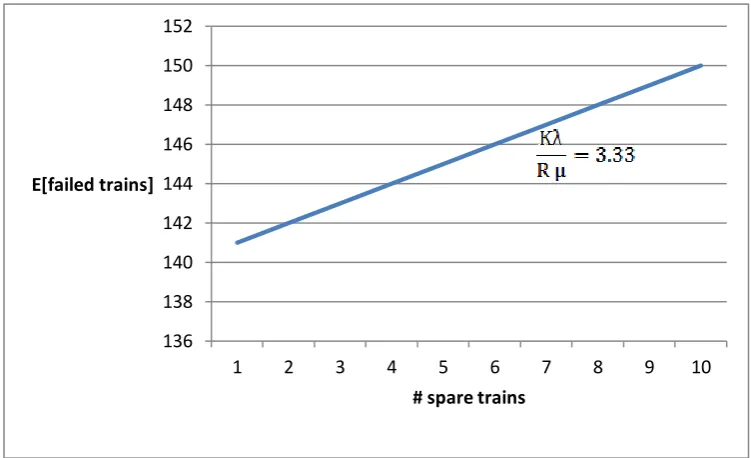
Figures 5.1, Figure 5.3 and Figure 5.5 show the behavior of the fleet availability as the number of spare trains increases for the cases when respectively. It is seen in Figure 5.1 that increasing for (i.e. , worthwhile improvement in fleet availability is not obtained. Likewise, Figures 5.3, (
)
respectively, shows that significant improvement in fleet availability cannot obtained for small repair rate even with large number of spare trains.
Further, examining the average number of failed trains shows that with increasing the number of spare trains the number of failed trains also increases at a steady rate. From Figures 5.2 , 5.4 and 5.6 , we see that the addition of spare trains can drastically increase the number of failed trains. We perceive that the fleet availability is not quite promising for small values of throughput time and large value of S.
From this we can conclude that when the repair rate is too small, the increase in fleet availability is quite insensitive to S.
As we have seen above, little is gained in fleet availability for large value of and small value and the system is also likely to be uneconomic. Therefore, the only practical alternative
, is investigated in the following section.
Figure 5.1 Fleet availability with standby spares for
0 0.1 0.2 0.3 0.4 0.5 0.6 0.7 0.8
1 2 3 4 5 6 7 8 9 10 20 30 40
Availability
# spare trains
Availability
Figure 5.2 Expected numbers of failed trains for
Figure 5.3 Fleet availability with standby spares for
136 138 140 142 144 146 148 150 152
1 2 3 4 5 6 7 8 9 10
E[failed trains]
# spare trains
0 0.02 0.04 0.06 0.08 0.1 0.12 0.14 0.16 0.18
1 2 3 4 5 6 7 8 9 10 11 12 13 14 15
Fleet availability
# of Spare trains
Availability
Figure 5.4 Expected numbers of failed trains for
Figure 5.5. Fleet availability with standby spares for
70 75 80 85 90 95 100
1 2 3 4 5 6 7 8 9 10 11 12 13 14 15
E[failed trains]
# spare trains
0 0.01 0.02 0.03 0.04 0.05 0.06 0.07 0.08 0.09
1 2 3 4 5 6 7 8 9 10 11 12 13 14 15
Fleet Availability
# Spare trains
Availability
[image:42.595.148.476.422.647.2]Figure 5.6 Expected numbers of failed trains for
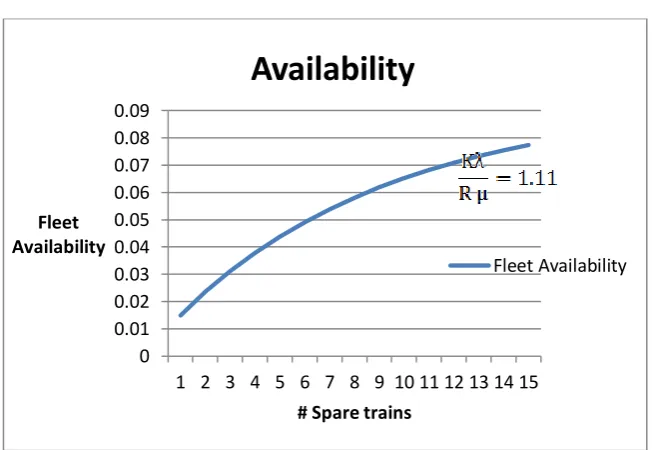
5.3. Case II : The case
, is representative of the situation at Ned train where the potential rate of output of the repair shop is greater than the average rate of failures of the fleet. To compare this with the previous section we take similar values of the parameters . The only parameter changed is we take values of because this insures the factor
It can be noticed that for
respectively.
Figures 5.7 through 5.10 shows that the fleet availability rises as the number of spares increases for the cases when and
It is observed in Figure 5.7, 5.9 and 5.11 that by increasing the value of significant improvement in fleet availability is achieved. One can depict the variation of fleet availability with different numbers of spare in the respective figures.
Assuming for the purposes of discussion that 96 per cent fleet availability is a reasonable criterion, for it is seen from Figure 5.7 and 5.9 that at this level 17 and 8 spare trains respectively are required to maintain the target fleet availability.
In most circumstances, the savings in cost may be appreciable; i.e in the case of NedTrain, trains costing some 2 million euros each, the effect of increasing the
0.00 5.00 10.00 15.00 20.00 25.00 30.00 35.00 40.00
1 2 3 4 5 6 7 8 9 10 11 12 13 14 15
E[Failed]
repair rate from 4 to 5 but maintaining the same potential fleet availability thereby reduces the required number of spare from 17 to 8. This is to make available up to about 18 million euro for the necessary purchase of additional equipment, modification of existing equipment, the engagement of additional labor, or a combination of all three.
It should be noted that the repair facilities will be largely unused, the utilization factor fails from about 83.3 per cent to 66.6 per cent . Nevertheless, if these fairly large idle repair facilities and repair crews can be obtained within-the cost of the spares saving economic advantage follows. Especially it may be possible for the additional resources to be diverted to some other productive use when not required for the primary task.
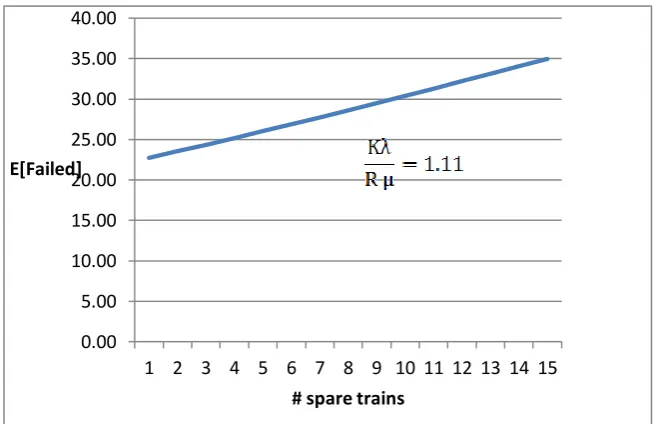
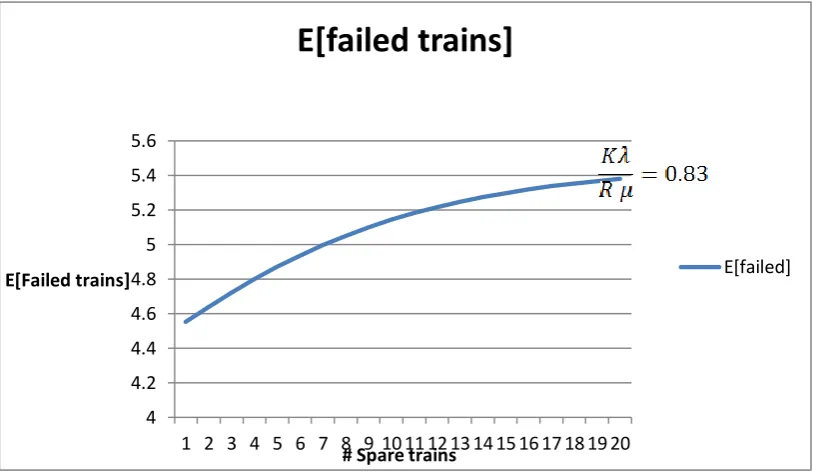
The average number of failed trains versus spare trains is also analyzed in Figures 5.8, 5.10 and 5. 12. Examining the average number of failed trains shows that with increasing the number of spare trains does not in contrast to the previous case (i.e. case A), rapidly increases the number of trains failed. Their effect is directed only towards increasing the fleet availability or the operational efficiency.
Figure 5.7 Fleet availability with standby spares for
0 0.2 0.4 0.6 0.8 1 1.2
1 2 3 4 5 6 7 8 9 10 11 12 13 14 15 16 17 18 19 20
Fleet availability
# spare trains
Fleet availability
Figure 5.8 Expected numbers of failed trains for
Figure 5.9 Fleet availability with standby spares for
4 4.2 4.4 4.6 4.8 5 5.2 5.4 5.6
1 2 3 4 5 6 7 8 9 10 11 12 13 14 15 16 17 18 19 20
E[Failed trains]
# Spare trains
E[failed trains]
E[failed]
0 0.2 0.4 0.6 0.8 1 1.2
1 2 3 4 5 6 7 8 9 10 11 12 13 14 15
Fleet availability
# spare trains
Fleet Availability
Figure 5.10 Expected numbers of failed trains for
Figure 5.11 Fleet availability with standby spares for
2.24 2.26 2.28 2.3 2.32 2.34 2.36 2.38 2.4 2.42
1 2 3 4 5 6 7 8 9 10 11 12 13 14 15
E[ failed trains]
# Spare trains
E[Failed trains]
E[Failed trains]
0 0.2 0.4 0.6 0.8 1 1.2
1 2 3 4 5 6 7 8 9 10 11 12 13 14 15
Fleet Availability
# spare trains
Fleet Availability
Figure 5.12 Expected numbers of failed trains for
5.4. Numerical Evaluation of Nedtrain’s Scenario
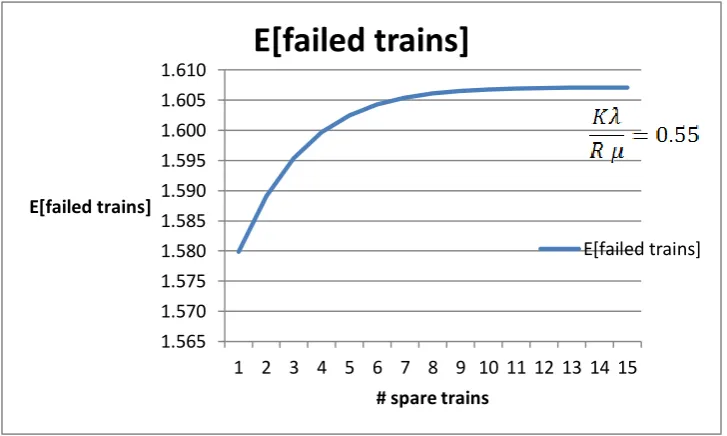
Recall from section 2.3 that each day NS keeps 200 operational trains and 3 cold standby trains in one of their fleet. The maintenance in the repair shop takes place in two parallel repair facilities with an average repair rate of 1 train per day. It is interesting to establish whether the given numbers of cold standby trains is effective and efficient for the acceptable level of fleet availability. The values of the given parameters are . On the basis of the previous input data obtained from the company we updated the estimated value of the parameter to . As we explained in the previous section the case (i.e. case II) is representative of the situation at Ned train where the potential rate of output of the repair shop is greater than the average rate of failures. The fleet availability as function of number of spare trains is shown in Figure 5.13.
From the figure it is observed that for the given fleet size the
Matlab
algorithm generates a long run availability of 96.72 %, 99.95 %, and 99.99 % with no spares, 1 spare train and 2 spare trains respectively. Thus by increasing the value of significant improvement in fleet availability is realized. In fact, it is seen that with , the average fleet availability almost reaches the highest level.Figure 5.14 illustrates average number of failed trains as a function of the number of spare trains. Investigating the average number of failed trains shows that with an increasing the number of spare trains the expected number of failed trains does not exceed 1. It appears that keeping more than two spare trains is an
1.565 1.570 1.575 1.580 1.585 1.590 1.595 1.600 1.605 1.610
1 2 3 4 5 6 7 8 9 10 11 12 13 14 15
E[failed trains]
# spare trains
E[failed trains]
overestimation. This has an improvement potential of one train per the given region (33 %), which is about 2 million Euros.
Figure 5.15 and 5.16 illustrates mean time to failure and the mean time to recover of the fleet as a function of the number of spare trains. It is seen that by increasing the number of spare trains the mean time to failure of the fleet increases rapidly. However increasing the number of spare trains beyond 2 doesn’t have material effect on the mean time to recover for the fleet.
Figure 5.13 Fleet Availability with standby trains
Figure 5.14 Expected numbers of failed trains 0.95
0.96 0.97 0.98 0.99 1 1.01
1 2 3 4 5 6 7
Fleet Availability
# Spare trains
Fleet Availability
Fleet Availability
0 0.2 0.4 0.6 0.8 1 1.2
1 2 3 4 5 6 7
E[failed Trains]
# Spares
E[ failed trains]
Figure 5.16 Mean Time to Recover for the fleet
5.5. Model validation
In order to validate the model we designed, we illustrated the model to the problem owner from the company and asked the experts and managers their opinion about our results. An in-depth evaluation of the performance of the model was made. Indeed the feedback was positive and the company saw potential applications of our results.
0 0.2 0.4 0.6 0.8 1 1.2
1 2 3 4
MTTR
# spare trains
MTTR
6.
CONCLUSION AND RECOMMENDATION
The research discussed in this report was done in order to obtain a model which evaluates the long run availability of a multi-train repairable fleet. The developed model evaluates the so-called key performance indicators, namely; steady state availability, the mean time to failure (MTTF) and the mean time to repair (MTTR) of the fleet system. The model was created using a method where a Markovian analysis is applicable to present the operation of the fleet system. It was developed by establishing relationship between system availability and the number of cold standbys, the failure rate and the repair throughput time of the repair facility.
For any given failure rate of a fleet the impact of varying the repair parameter was examined in relation to the associated numbers of spare trains necessary for an acceptable long run fleet availability.
During this research, there are some values of parameters not exactly known by NedTrain and for the unknown values, estimations have been made. Even though this means that the exact numbers of the results might not totally match reality, the relationship between variables can give many managerial insights. It turned out that the relationships between the failure rate, the number of spare trains, the repair throughput time and the corresponding relative utilization of the servicing facilities, provide useful criteria for evaluating the performance of the fleet system. The maximum output rate of the repair facilities being less than the average rate of failures, are likely to prove uneconomic.
7.
ALGORITIHM
function
[N,Pmin,expStandTrain,expFail,expOperating,servUt,TTF,TTR,availability,PminCum]=mainPr ogram(S,mu)
R=3;
%S=3;
K=200; N=S+K;
%mu=1;
lambda=1/30;
rho=lambda/mu; minrs=min(R,S); maxrs = max(R,S);
summ=0;
% the following loop is sum for n<=min(R,S)
krhobyfact = 1;
for i=0:N-1 if(i<=S)
lamv(i+1)=K*lambda; else
lamv(i+1)=(N-i)*lambda; end
muv(i+1)=min(i+1,R)*mu;
end
rhov=lamv./muv;
lamv muv rhov
summ=1;
for i=1:N
summ =summ + prod(rhov(1:i));
end
summ
P(1)= 1/summ;
for i=2:N+1
P(i)=rhov(i-1)*P(i-1);
end
plot(1:N+1,P)
ylabel('Steady state probability')
%hold on;
sum(P)
P=P';
Pmin = 0;
for j=0:S
Pmin = Pmin + P(j+1); PminCum(j+1) = Pmin;
end
xaxis=linspace(1,S,S); figure(2);
plot(1:S+1,PminCum) xlabel('#spare trains') ylabel('Fleet availability')
expStandTrain = 0;
for j=0:S
expStandTrain = expStandTrain + (S-j)*P(j+1);
end
expFail = 0;
for j=0:(K+S)
expFail = expFail + j*P(j+1);
end
expOperating = N - expFail;
expWait = 0;
for j=(R+1):(K+S)
expWait = expWait + (j-R)*P(j+1);
end
servUt = 0;
for j=0:R
servUt = servUt + j*P(j+1);
end
for j=(R+1):N
servUt = servUt + R*P(j+1);
end
servUt = servUt/R;
SSavail = Pmin;
G1=zeros(S+1,S+1);
for j=1:S
G1(j,j+1) = K*lambda;
end
for j=1:(S+1)
end
for j=1:S
G1(j+1,j) = min(R,j)*mu;
end
%A1=P(1:(S+1),:); A1=A1';
A1=zeros(1,S+1); A1(S+1)=1;
%B1=zeros(S+1,1); B1(1)=1; B1(S+1)=1;
B1=ones(S+1,1); TTF= -A1*inv(G1)*B1;
G2=zeros(K,K);
for j=1:(K-1)
G2(j,j+1) = (K-j)*lambda;
end for j=1:K
G2(j,j) = -(K-j)*lambda-min(R,S+j)*mu;
end
for j=1:(K-1)
G2(j+1,j) = min(R,S+j+1)*mu;
end
A2=zeros(1,K); A2(1)=1;
%A2=P((S+2):(N+1)); A2=A2';
B2=ones(K,1);
%B2 = zeros(K,1); B2(1)=min(R,S+1)*mu;
TTR = -A2*inv(G2)*B2;
8.
APPENDIX
8.1. Organizational Structure of Nedtrain
The management of NedTrain consists of the board of directors and the divisions presented in the Figure 8.1. In the following subsection, we will explain some of the operational units of NedTrain.
NedTrain Operations NedTrai consulting
B and D Board of NedTrain
Quality Operations control Operations Support
Maintenance
Overhaull
Services
Production Manager
Production Manger
Operational control Operational support
Maintenance personnel
Operations Control Operational support
Service Personnel
Help Desk Control centre
[image:55.595.90.356.224.476.2]Figure 8.1 Organizational structure of NedTrain 8.1.1. Help Desk Control centre
The helpdesk and control Centre in the case of rolling stock failures functions as a front back office between NS Reizigers and NedTrain. In direct dialogue with the train personnel the helpdesks front office tries to correct failures. When necessary, the back office plans a repair order at a specific service locations or maintenance workshop to correct the failure. This repair order will be combined with a time prognosis when the train set must be ready for service. The arrival location and the estimated time prognosis will be handed over to the NS Reizigers.
8.1.2. Process manger (PCL), Service and Maintenance personnel
personnel. After the repair job has been performed by the service or the maintenance personnel, the process manager will book out the repair job.
The service personnel repair failures during and outside the train service. The repair work will be formed on a service location or on the location of the standard train set. In the case that the driver cannot correct the failure, the service personnel will be called to restore the failure as quick as possible, so that the driver can continue the train service.
In case of more serious failure, it will be decided to take the train set out of service. The train personnel will have then more time to correct the failure. Furthermore, the service personnel perform the periodic checks for the train sets. The maintenance personnel repair and maintain train sets in the maintenance workshop. Normally a train set will be maintained once every three months approximately 30,000 Km. However, in case of complex failures, train sets will be transported earlier to a ma