of stars and extrasolar planets
Thesis by
Trevor Justin David
In Partial Fulfillment of the Requirements for the degree of
Doctor of Philosophy
CALIFORNIA INSTITUTE OF TECHNOLOGY Pasadena, California
2017
© 2017
Trevor Justin David ORCID: 0000-0001-6534-6246
In memory of Anita Naomi Cole and Alexander Cochran Davis
ACKNOWLEDGEMENTS
It has been a privilege to work with my thesis advisor, Lynne Hillenbrand. The significance of any of the work that follows is owed entirely to her ability to identify relevant and timely problems to study. I am grateful for the latitude she has granted me in our various projects to pursue the aspects of the research that interested me most, as well as for her patience and sense of humor which have enabled us to work smoothly together. Her skepticism, pragmatism, and sociological wisdom have kept me on the right track and I look forward to working together in the future.
I am also grateful to the YSOVAR group, specifically Ann Marie Cody, Luisa Rebull, and John Stauffer, for welcoming me to their meetings and taking the time to share their expertise on various topics in stellar astrophysics. Their enthusiasm for all things pertaining to young stars has been an inspiration along this journey through the exquisite K2 datasets. A number of other K2 collaborators across the globe have provided me with helpful and thoughtful input, including Keivan Stassun, Ed Gillen, Suzanne Aigrain, and Andrew Collier Cameron.
Much of the science presented here was enabled through the gracious support of the California Planet Search collaboration, specifically Andrew Howard, Howard Isaac-son, David Ciardi, B.J. Fulton, Evan Sinukoff, Ian Crossfield, and Josh Schlieder. Erik Petigura in particular has proven both a great friend and mentor, and I am indebted to him for the hours he has spent helping me to improve my capabilities as a scientist and deepening my understanding of how best to approach research problems in astronomy.
Many other postdocs, staff scientists, and faculty have provided mentorship or friendship in one form or another over the years, and it has been a pleasure working alongside this talented group of individuals. These include Sasha Hinkley, Björn Benneke, John Carpenter, Jessie Christiansen, Justin Crepp, Jean-Michel Désert, Jim Fuller, Shri Kulkarni, Wal Sargent, Nick Scoville, Avi Shporer, Ji Wang, and my thesis committee members Konstantin Batygin, Heather Knutson, Dimitri Mawet, and Chuck Steidel.
at NASA and Ball Aerospace, and the U.S. taxpayers for their parts in giving the Keplertelescope a second life. Material support for my research has been provided
by the NSF through the Graduate Research Fellowship Program.
There are plenty of logistics involved in acquiring new data, traveling to conferences to present results, and carrying out day-to-day research activities. Thankfully, I’ve been spared these burdens by the friendly and efficient administrators of Cahill, as well as the astronomers, telescope operators, engineers, and supporting staff at Keck and Palomar Observatories. I am also grateful to France Córdova for personally endowing research funds that enabled me to travel and present my work as a Neugebauer Fellow.
My interest in astrophysics likely would have remained just that if not for the many talented educators I’ve been fortunate to learn from over the years. In order of appearance: Joe Vaughan, Fred Chromey, Debbie Elmegreen, Allyson Sheffield, Jamie Lombardi, Jim Challey, Brian Daly, Richard Ellis.
Thanks are owed to my officemates for tolerating me over the years: Ryan Trainor, Swarnima Manohar, Matt Schenker, Marin Anderson, and, in particular, the first year group of Ben “Charlotte” Montet, Mislav “Samantha” Baloković, and Yi “Miranda” Cao. I would also like to thank the other members of my incoming class, for whom I have graciously waited to see off before finishing up myself: Antonija Oklopčić, Allison Strom, and Abhilash Mishra. We made it through graduate school with plenty of guidance from our forebears, particularly Gwen Rudie and Drew Newman.
Caltech is a place of characters, but a few denizens of Cahill stand out in particular. Sirio Belli for disagreeing with me on everything, every time. Matt Schenker for introducing me to the world of third strikes, fuel dumps, and manufactured spend. Mike Bottom for enlivening discussions about circlons, space mirrors, and other alternative astrophysical theories.
My friends from outside the realm of astronomy, especially those I’ve known since well before I started down this path, have kept me sane and grounded. These include Ross Fredella, Chino and Joyce Kim, Skylar Hughes, Ian Miller, Jason Tragni, and Matt Fox. I would also like to thank my teammates from the Outlaws of the Pasadena Bronze B ice hockey league for a spirited inaugural season, despite our 3-14-3 record.
this passion. It began, as best as I can remember, when my mother woke me in the middle of the night to watch a meteor shower from our backyard. To my brother, Zach, my sister, Ariana, her family David, Scarlett, and William, and to Diana, E.J., and Zachary: I am lucky to call you family and always look forward to the time we spend together. I am particularly thankful for my niece and nephew, who never fail to cheer me up. I would especially like to thank the nurses and doctors of White Plains Hospital for seeing my mother through a life-saving surgery and its complicated aftermath, particularly Drs. Waheeda Mithani, Kaare Weber, John Train, and Angie.
Verses to the Vassar Dome
A low-built tower and olden,
Dingy but dear to the sight
And they that dwell therein are wont
To watch the stars at night.
ABSTRACT
In this thesis, I present several studies aimed at determining the evolutionary states of stars and the planets that orbit them. Multiple approaches are undertaken to determine the physical parameters of stars over a wide range of masses, and in the process I evaluate current theoretical models which are commonly used to indirectly determine the properties of stars and planets.
Chapter II concerns the ages of nearby stars more massive than the Sun. These stars, because they are bright and young (<1 Gyr) on the average, constitute attrac-tive targets for surveys aiming to directly capture light from planets in wide orbits. The precise masses of directly imaged companions are important for constraining star and planet formation theories, but rely critically on the host star ages. I show that sky-projected rotational velocity is a vital parameter in age-determination for intermediate-mass stars. Rapid rotation induces large pole-to-equator gradients in the photospheric temperature and surface gravity, such that a star seen pole-on appears hotter and higher gravity (and thus younger) than a star with identical prop-erties seen edge-on. I use intermediate-band photometry centered on the hydrogen Balmer series and projected rotational velocities to determine atmospheric param-eters and ages for approximately 3500 nearby stars with masses in the range of 1–10 M. I validate the method using four open clusters, in the process finding ages for α Persei and the Hyades that are younger at∼70 Myr and older at∼830 Myr, respectively, than canonical values.
In Chapters III through V, I present orbital solutions and fundamental parameters for eclipsing binaries (EBs), newly discovered from theK2mission, in the Pleiades open cluster (125 Myr) and the Upper Scorpius OB association (5–10 Myr). EBs, particularly those in coeval stellar populations, are valuable benchmarks for eval-uating evolutionary models. Such benchmarks are particularly rare at low masses and young ages, and my work has increased the sample by 80% at M < 1 M
diagram appear systematically older than those determined for the same stars in a Hertzsprung-Russell (H-R) diagram. A precise distance determination for the Pleiades EB HCG 76 is in agreement with the literature consensus and formally ex-cludes the now discredited trigonometric measurement fromHipparcos. The orbital periods, eccentricities, and stellar spin periods determined fromK2photometry are compared with theoretical expectations from tidal dissipation. In Chapter VI, I present preliminary results on more recently discovered EBs in Upper Scorpius, and updated interpretations of previously published systems. I use the combined data to pave the way for an empirical pre-main-sequence mass-radius relation over a broad range of masses and determine an age of Upper Scorpius which is intermediate to the canonical age (3–5 Myr, as derived from low-mass pre-main-sequence stars) and a more recent estimate (9–13 Myr, as derived from intermediate-mass stars) from H-R diagram analyses.
In Chapter VII, I present observations of the low-mass pre-main-sequence star RIK-210. This star shows a variable eclipse-like signature, which persisted through 78 days ofK2photometry but was apparently absent in archival photometry. Follow-up observations demonstrate that RIK-210 is a single star with no massive companion orbiting at the period of the eclipse-like signature. The flux diminutions are in phase with the stellar rotation, behavior seen in some young stars that are periodically obscured by an accretion disk, but RIK-210 lacks such a protoplanetary disk. I consider various explanations for the observations and favor a model in which charged dust is trapped in a rigidly-rotating magnetosphere. The source of such dust could be from one or more close-in planets or residual planet-forming material drifting in towards the star.
dispersal. UsingK2photometry for hundreds of pre-main-sequence stars in Upper Scorpius I search for transiting planets, assess survey completeness, and determine the occurrence rates or upper limits to such rates for large planets in close orbits around low-mass stars. With the singular detection of K2-33 b, I determine a rate of close-in Neptune- to Jupiter-sized planets higher than that for low-mass field stars but in closer agreement with the rate for sub-Neptune planets. Given the extreme youth of K2-33 b, I tentatively interpret these results as an indication that the planet is a progenitor of the abundant class of close-in sub-Neptunes.
PUBLISHED CONTENT AND CONTRIBUTIONS
David, T. J., Petigura, E. A., Hillenbrand, L. A., et al., 2017, “A Transient Transit Signature Associated with the Young Star RIK-210,”The Astrophysical Journal, 835, 168, DOI:10.3847/1538-4357/835/2/168,
T.J.D. discovered the periodic signal, organized collaborators, prepared the pho-tometric data, performed key analysis steps, and led the manuscript writing.
David, T. J., Conroy, K. E., Hillenbrand, L. A., et al., 2016a, “New Pleiades Eclipsing Binaries and a Hyades Transiting System Identified by K2,” The Astronomical Journal, 151, 112, DOI:10.3847/0004-6256/151/5/112,
T.J.D. participated in spectroscopic observations, performed the photometric and radial velocity fitting, and led the analysis and manuscript writing.
David, T. J., Hillenbrand, L. A., Cody, A. M., Carpenter, J. M., & Howard, A. W., 2016b, “K2 Discovery of Young Eclipsing Binaries in Upper Scorpius: Direct Mass and Radius Determinations for the Lowest Mass Stars and Initial Charac-terization of an Eclipsing Brown Dwarf Binary,”The Astrophysical Journal, 816, 21, DOI:10.3847/0004-637X/816/1/21,
T.J.D. discovered the eclipsing binaries, participated in spectroscopic observa-tions, performed the photometric and radial velocity fitting, and led the analysis and manuscript writing.
David, T. J., Hillenbrand, L. A., Petigura, E. A., et al., 2016c, “A Neptune-sized transiting planet closely orbiting a 5-10-million-year-old star,”Nature, 534, 658, DOI:10.1038/nature18293,
T.J.D. discovered the planet, organized collaborators, prepared the photometric data, performed key analysis steps, and led the manuscript writing.
David, T. J., & Hillenbrand, L. A., 2015, “The Ages of Early-type Stars: Strömgren Photometric Methods Calibrated, Validated, Tested, and Applied to Hosts and Prospective Hosts of Directly Imaged Exoplanets,” The Astrophysical Journal, 804, 146, DOI:10.1088/0004-637X/804/2/146,
T.J.D. assembled the stellar sample, developed the methodology, performed all analyses, and led the writing of the manuscript.
David, T. J., Stauffer, J., Hillenbrand, L. A., et al., 2015, “HII 2407: An Eclipsing Binary Revealed By K2 Observations of the Pleiades,”The Astrophysical Journal, 814, 62, DOI:10.1088/0004-637X/814/1/62,
TABLE OF CONTENTS
Acknowledgements . . . iv
Abstract . . . viii
Published Content and Contributions . . . xi
Table of Contents . . . xii
List of Illustrations . . . xviii
List of Tables . . . xlviii Chapter I: Introduction . . . 1
1.1 Stellar evolutionary models and the need for calibrators . . . 1
1.1.1 Eclipsing binaries . . . 2
1.1.2 Evaluating pre-main-sequence models of low-mass stars . . 6
1.1.3 Convection, magnetic fields, and starspots . . . 7
1.1.4 Apparent age spreads, accretion histories, and coevality within binaries . . . 9
1.1.5 Multiplicity effects . . . 10
1.1.6 Tidal dissipation in binary stars . . . 11
1.1.7 Young star variability studies in the age ofKepler/K2 . . . . 13
1.2 Towards measuring planetary evolution and migration timescales . . 17
1.2.1 Inflated planetary radii at young ages? . . . 22
1.2.2 The masses of directly imaged companions . . . 23
1.2.3 The future of exoplanet science at young ages . . . 26
Chapter II: The ages of early-type stars: Strömgren photometric methods calibrated, validated, tested, and applied to hosts and prospective hosts of directly imaged exoplanets . . . 27
Abstract . . . 28
2.1 Introduction . . . 29
2.1.1 The Era of Direct Imaging of Exoplanets . . . 29
2.1.2 The Age Challenge . . . 31
2.1.3 Our Approach . . . 33
2.2 The Strömgren Photometric System . . . 34
2.2.1 Description of the Photometric System . . . 34
2.2.2 Extinction Correction . . . 36
2.2.3 Utility of the Photometric System . . . 37
2.3 Determination of Atmospheric ParametersTeff,logg . . . 37
2.3.1 Procedure . . . 37
2.3.2 Sample and Numerical Methods . . . 40
2.3.3 Rotational Velocity Correction . . . 40
2.4 Calibration and Validation Using the HM98 Catalog . . . 43
2.4.1 Effective Temperature . . . 43
2.4.2.1 Comparison with Double-Lined Eclipsing Binaries 52
2.4.2.2 Comparison with Spectroscopic Measurements . . 59
2.4.3 Summary of Atmospheric Parameter Uncertainties . . . 60
2.5 Age Estimation from Isochrones . . . 67
2.5.1 Selection of Evolutionary Models . . . 67
2.5.2 Bayesian Age Estimation . . . 69
2.5.2.1 Bayes Formalism . . . 70
2.5.2.2 Age and Mass Prior Probability Distribution Func-tions . . . 71
2.5.2.3 Numerical Methods . . . 72
2.5.2.4 Age and Mass Uncertainties . . . 72
2.6 The Methodology Tested on Open Clusters . . . 73
2.6.1 Process . . . 75
2.6.2 Results . . . 76
2.6.2.1 Ages from Bayesian Inference . . . 76
2.6.2.2 Ages from Isochrone Fitting . . . 80
2.7 The Methodology Applied to Nearby Field Stars . . . 80
2.7.1 Empirical Mass-Age Relation . . . 87
2.7.2 Empirical Spectral-Type-Age/Mass Relations . . . 87
2.8 Discussion . . . 87
2.8.1 Methods Previously Employed in Age Determination for Early Type Stars . . . 90
2.8.2 Stars Below the Main Sequence . . . 91
2.8.3 Stars of Special Interest . . . 92
2.8.3.1 Sun . . . 92
2.8.3.2 HR 8799 . . . 93
2.8.3.3 βPic . . . 94
2.8.3.4 κAnd . . . 94
2.8.3.5 ζ Delphini . . . 95
2.8.3.6 49 Ceti . . . 95
2.9 Conclusions . . . 96
Appendices . . . 98
2.A Metallicity Effects . . . 98
2.B Confidence Intervals . . . 99
2.C Open Cluster Tables . . . 100
2.D Alternative Treatment of Open Clusters . . . 106
Chapter III: HII 2407: An eclipsing binary revealed by K2 observations of the Pleiades . . . 109
Abstract . . . 110
3.1 Introduction . . . 111
3.2 K2 Observations and Analysis . . . 111
3.3 HII 2407 . . . 113
3.4 Orbital Parameter Fitting . . . 118
3.5 Discussion . . . 123
Acknowledgments . . . 127
Chapter IV: New Pleiades eclipsing binaries and a Hyades transiting system identified by K2 . . . 128
Abstract . . . 129
4.1 Introduction . . . 130
4.2 Data . . . 132
4.2.1 K2Photometry and Detrending . . . 134
4.2.2 Photometric Colors . . . 134
4.2.3 Spectroscopy . . . 135
4.3 Analysis . . . 136
4.3.1 Estimation of Primary Star Properties . . . 137
4.3.2 Light Curve Modeling . . . 137
4.4 Results . . . 138
4.4.1 HCG 76 . . . 138
4.4.2 MHO 9 (BPL 116) . . . 147
4.4.3 HD 23642 . . . 150
4.4.4 HII 2407 . . . 158
4.4.5 AK II 465 . . . 158
4.4.6 vA 50 (HAN 87) . . . 160
4.5 Test of Model Isochrones at Pleiades Age . . . 163
4.6 Summary and Conclusions . . . 166
Acknowledgments . . . 169
Appendices . . . 170
4.A Model results for Pleiades non-member EB AK II 465 . . . 170
Chapter V: K2 discovery of young eclipsing binaries in Upper Scorpius: Direct mass and radius determinations for the lowest mass stars and initial characterization of an eclipsing brown dwarf binary . . . 172
Abstract . . . 173
5.1 Introduction . . . 174
5.2 K2Observations and Analysis . . . 175
5.2.1 Light Curve Extraction . . . 176
5.2.2 Detrending Procedure . . . 177
5.3 Spectroscopic Observations and Analysis . . . 179
5.4 Orbital Parameter Fitting . . . 184
5.5 Overview of System and Primary/Secondary Parameter Estimation . 186 5.6 Results and Discussion of Individual Eclipsing Binaries . . . 187
5.6.1 EPIC 203710387 . . . 188
5.6.2 EPIC 203868608 . . . 194
5.6.3 EPIC 203476597 . . . 202
5.7 General Discussion . . . 206
5.7.1 Comparing EPIC 203710387 and UScoCTIO 5 . . . 208
5.7.2 On the Age of Upper Scorpius . . . 211
5.7.3 Coevality Within and Between Systems . . . 213
5.7.4 Chromospheric Activity Effects . . . 214
5.8 Conclusion . . . 216
Acknowledgments . . . 219
Appendices . . . 232
5.A Revised Parameters for UScoCTIO 5 . . . 232
Chapter VI: A pre-main-sequence mass-radius relation and the age of Upper Scorpius from eclipsing binaries . . . 236
6.1 Introduction . . . 236
6.2 Observations . . . 237
6.3 Discussion of individual systems . . . 241
6.3.1 EPIC 204760247 / HD 142883 / HR 5934 . . . 241
6.3.2 EPIC 204506777 / HD 144548 . . . 246
6.3.3 EPIC 203476597 . . . 246
6.3.4 EPIC 204432860 / RIK-60 / USco 48 . . . 246
6.3.5 EPIC 205207894 / RIK-72 . . . 252
6.3.6 EPIC 202963882 . . . 254
6.3.7 EPIC 205030103 / UScoCTIO 5 . . . 254
6.3.8 EPIC 203868608 . . . 255
6.3.9 EPIC 203710387 . . . 257
6.4 Pre-main-sequence evolution of intermediate-mass stars . . . 259
6.5 The age of Upper Scorpius from eclipsing binaries . . . 260
Chapter VII: A transient transit signature associated with the young star RIK-210264 Abstract . . . 265
7.1 Introduction . . . 266
7.2 RIK-210 . . . 266
7.2.1 Stellar properties . . . 267
7.2.2 Activity and Possible Disk . . . 267
7.3 K2Light Curve and Analysis . . . 269
7.3.1 Stellar variability fit . . . 273
7.3.2 Periodicity . . . 273
7.3.3 Ephemeris . . . 274
7.3.4 Durations . . . 274
7.3.5 Size of occulting material . . . 275
7.3.6 Dip morphology . . . 276
7.3.7 Bursts, Flares, and Starspots . . . 276
7.3.8 Light curve parameterization . . . 278
7.3.9 Short duration, shallow flux dips . . . 285
7.4 Archival and follow up photometric monitoring . . . 286
7.5 Spectroscopic Observations . . . 289
7.5.1 Secondary line search . . . 289
7.5.2 Projected rotational velocity . . . 291
7.5.3 Radial velocities . . . 291
7.5.4 Line profile variations . . . 294
7.6 High-resolution Imaging . . . 295
7.7 Discussion . . . 297
7.7.2 Eclipses of an accretion hotspot? . . . 300
7.7.3 Eclipses of prominences? . . . 301
7.7.4 Transits of magnetospheric clouds? . . . 301
7.7.5 Obscuration by a circumstellar disk? . . . 302
7.7.6 A co-rotating dust component? . . . 304
7.7.7 Boil-off of a protoplanet atmosphere? . . . 308
7.7.8 Tidal disruption of a planet? . . . 308
7.7.9 Transits of an enshrouded protoplanet? . . . 309
7.7.10 Significance of the corotation radius . . . 312
7.7.11 Uniqueness of RIK-210 . . . 313
7.8 Conclusions . . . 314
Acknowledgments . . . 316
Chapter VIII: A Neptune-sized transiting planet closely orbiting a 5-10-million-year-old star . . . 317
Abstract . . . 318
8.1 Methods . . . 323
8.1.1 Stellar Membership and Properties. . . 323
8.1.2 Stellar Rotation and Independent Assessment of the Stellar Radius. . . 327
8.1.3 K2Time Series Photometry Treatment. . . 327
8.1.4 Transit Model Fitting Analysis. . . 328
8.1.5 High Spectral Resolution Observations and Radial Velocities. 329 8.1.6 Limits on Companions from the Spectroscopic Data. . . 329
8.1.7 High-resolution Imaging. . . 330
8.1.8 Non-redundant Aperture Masking. . . 330
8.1.9 Limits on Companions from the Imaging Data. . . 331
8.1.10 Galactic Structure Model and Intracluster Contamination. . . 332
8.1.11 False Positive Probability Analysis. . . 333
8.1.12 Implications of Hierarchical Triple Scenarios. . . 333
8.1.13 Cluster Age. . . 334
8.1.14 K2-33 b in the Context of Other Claimed Young Planets. . . 335
Chapter IX: The occurrence of close-in planets at the epoch of primordial disk dispersal . . . 340
Abstract . . . 341
9.1 Introduction . . . 342
9.2 Sample Selection . . . 343
9.2.1 Proper motion analysis . . . 345
9.2.2 Color-magnitude cuts . . . 348
9.2.3 Disk-hosting stars . . . 349
9.2.4 Stellar multiplicity . . . 349
9.2.5 Crowded fields . . . 351
9.2.6 Final selection scheme . . . 352
9.2.7 Stellar characterization . . . 352
9.3.2 Transit search pipeline . . . 358
9.3.3 Manual vetting . . . 359
9.3.4 Transit injection and recovery tests . . . 359
9.3.5 Survey completeness . . . 360
9.4 Determination of planet occurrence rates . . . 366
9.4.1 Expected planet yields . . . 369
9.5 Discussion . . . 370
Acknowledgments . . . 372
LIST OF ILLUSTRATIONS
Number Page
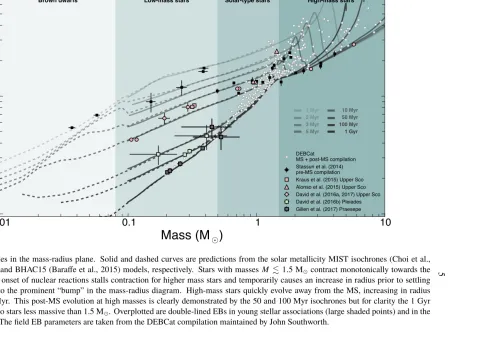
1.1 Reproduction of Figure 2 from Wyatt (2008). The disk frequency, i.e. fraction of stars hosting protoplanetary disks, within stellar as-sociations of different ages. The time available for forming planets with substantial gaseous envelopes is set by the protoplanetary disk dispersal timescale. Ages of young associations are typically derived from H-R diagram analyses using evolution models that are largely uncalibrated and contain systematic offsets. . . 2 1.2 Isochrones in the mass-radius plane. Solid and dashed curves are
predictions from the solar metallicity MIST isochrones (Choi et al., 2016; Dotter, 2016) and BHAC15 (Baraffe et al., 2015) models, respectively. Stars with masses M .1.5 Mcontract monotonically towards the main sequence. The onset of nuclear reactions stalls contraction for higher mass stars and temporarily causes an increase in radius prior to settling on the MS, leading to the prominent “bump” in the mass-radius diagram. High-mass stars quickly evolve away from the MS, increasing in radius again after several Myr. This post-MS evolution at high masses is clearly demonstrated by the 50 and 100 Myr isochrones but for clarity the 1 Gyr isochrone is limited to stars less massive than 1.5 M. Overplotted are double-lined EBs in young stellar associations (large shaded points) and in the field (white points). The field EB parameters are taken from the DEBCat compilation maintained by John Southworth. . . 5 1.3 Reproduction of Figure 10 from Mann et al. (2017). Sizes of
1.4 Reproduction of Figure 6 from Bowler (2016). Orange, green, and blue curves show theoretical predictions for the temporal evolution of luminosity of low-mass stars (>80 MJup), brown dwarfs (14–80 MJup), and planetary-mass companions (<14 MJup) respectively. Points
represent directly imaged companions in either the planetary (blue) or brown dwarf (green) mass regimes. Large errors in the ages of host stars translate into large uncertainties in model-derived companion masses. The prevalence of directly imaged companions (i.e. extreme mass ratio companions at large orbital separations) has implications for star and planet formation theories. ©The Astronomical Society of the Pacific. Reproduced with permission. . . 24 2.1 Top panels: Evolution of logTeffand loggwith age for
intermediate-mass stars, as predicted by PARSEC evolutionary models (Bressan et al., 2012). Bottom panels: Same evolutionary trends for B−V (close tob− y) and MV mag, as might be used to discern ages from color-magnitude diagram evolution (e.g. Nielsen et al., 2013). While the color and temperature trends reflect one another, the absolute magnitude trends are not as strong as the surface gravity trends when the stars are evolving from the main sequence after a few hundred Myr. The PARSEC models predict the precision in logg needed to distinguish a 1.5M star and a 2.0M star evolves from 0.0397 dex at
∼30 Myr to 0.0242 dex at 100 Myr to 0.0378 dex at∼300 Myr. The
precision in logg needed to distinguish a 1.5M star and a 3.0M evolves from 0.0085 dex at ∼ 30 Myr to 0.0694 dex at 100 Myr to 0.5159 dex at∼300 Myr. The precision in loggneeded to distinguish a 2.0M star and a 3.0M evolves from 0.0312 dex at∼ 30 Myr to 0.0936 dex at 100 Myr to 0.4781 dex at 300 Myr. . . 32 2.2 The u,v,b,y, Hβwide and Hβnarrow passbands. Overplotted on an
2.3 Top: Three relevantuvbyβ spaces for atmospheric parameter deter-mination of our sample of BAF stars with uvbyβphotometry in the HM98 catalog, and located within 100 pc of the Sun. Two stars were excluded from these figures for favorable scaling: Castor, which is an outlier in all three planes (β <2.4, a0 >1, b− y >0.6), and HD 17300, a poorly studied F3V star with b− y >0.6. Bottom: The same plots as above, with the model color grids of Castelli & Kurucz (2006) and Castelli & Kurucz (2004) overlaid in the relevant regions of parameter space. The lines of constant Teff (largely vertical) and of constant logg (largely horizontal) are annotated with their cor-responding values. Some outliers have been pruned, and irrelevant groups of stars eliminated, for clarity in this second plot. . . 38 2.4 Vectors showing the magnitude and direction of the rotational velocity
corrections at 100 (black), 200, and 300 (light grey) km s−1for a grid of points in log(Teff)-loggspace, with PARSEC isochrones overlaid for reference. While typical A-type stars rotate at about 150 km s−1, high-contrast imaging targets are sometimes selected for slow rotation and hence favorable inclinations, typically vsini <50 km s−1 or within the darkest black vectors. For rapid rotators, a 100% increase in the inferred age due to rotational effects is not uncommon. 41 2.5 Top: Comparison of the temperatures derived from the ATLAS9
uvbyβ color grids (Tuvby) and the fundamental effective
2.6 Ratio of the uvbyβ temperature to fundamental temperature as a function ofvsini, for the late (left), intermediate (middle), and early (right), group stars. The solid horizontal colored lines indicate the mean ratios in each case. The arrows represent both the magnitude and direction of change to the ratio Tuvby/Tfund after applying the FB98 rotation corrections. The dashed horizontal colored lines in-dicate the mean ratios after application of the rotation correction. The rotation correction appears to improve temperature estimates for early group stars, but worsen estimates for the late and intermediate groups. Notably, however, the vast majority of Teff standards are slowly rotating (vsini < 150 km s−1). Note one rapidly rotating intermediate group star extends beyond the scale of the figure, with a rotation correctedTuvby/Tfundratio of≈1.26. . . 46 2.7 Ratio of the uvbyβ temperature to fundamental temperature as a
function of [Fe/H]. There is no indication that the grids systematically overestimate or underestimateTefffor different values of [Fe/H]. . . . 47 2.8 Comparison of the uvbyβ derived logg values with fundamental
values for the primary components of the double lined eclipsing binaries compiled in Torres et al. (2010). Red, teal, and black points represent late, intermediate, and early group stars, respectively. In each case the solid colored line represents the mean of the residuals, ∆logg (in the sense of fundamental-uvbyβ). As can be seen, the
2.9 Surface gravity residuals,∆logg(in the sense of fundamental-uvbyβ), as a function of uvbyβ-determined log(Teff) (left) and logg (right). Solid points represent eclipsing binary primaries from Torres et al. (2010) and open circles are stars with spectroscopic logg determi-nations in N93. Of the 39 eclipsing binaries, only six have residuals greater than 0.2 dex in magnitude. This implies that theuvbyβgrids determine loggto within 0.2 dex of fundamental values∼ 85% of the time. Surface gravity residuals are largest for the cooler stars. Pho-tometric surface gravity measurements are in better agreement with spectroscopic determinations than the eclipsing binary sample. There is no indication for a global systematic offset in uvbyβ-determined loggvalues as a function of eitherTeffor logg. . . 54 2.10 Surface gravity residuals,∆logg(in the sense of fundamental-uvbyβ),
of eclipsing binary primaries as a function of vsini. Arrows indi-cate the locations of points after application of the Figueras & Blasi (1998)vsini correction, where in this case late group stars received the same correction as the intermediate group. . . 55 2.11 Surface gravity residuals,∆logg(in the sense of fundamental-uvbyβ),
as a function of [Fe/H]. The metallicity values have been taken pri-marily from Ammons et al. (2006), with additional values coming from Anderson & Francis (2012). While metallicities seem to exist for very few of the surface gravity calibrators used here, there does not appear to be a systematic trend in the residuals with [Fe/H]. There is a larger amount of scatter for the more metal-rich late-type stars, however the scatter is confined to a relatively small range in [Fe/H] and it is not clear that this effect is due to metallicity effects. . . 55 2.12 Distributions of the true variations in Teff (left) and logg (right)
2.13 The effect of interstellar reddening on atmospheric parameters de-rived from uvbyβ photometry. The isochrones and mass tracks plotted are those of Bressan et al. (2012). The tail of each vector represents a given point in a specific photometric plane ((b−y) −c1 for the late group stars in red,a0−r
∗
for the intermediate group stars in teal, and c1− β for the early group stars in black) and its corre-sponding value in [Teff,logg]. The tip of the vector points to the new value of [Teff,logg] after each point in photometric space has been “dereddened” assuming arbitrary values of AV. The shifts inuvbyβ space have been computed according to the extinction measurements of Schlegel et al. (1998) and Crawford & Mandwewala (1976), as-suming AV ' 4.237E(b−y). The magnitudes of AV chosen for this figure represent the extremes of values expected for our sample of nearby stars and are meant to illustrate the directionality of the ef-fects of reddening as propagated through theuvbyβplanes. Finally, note for the early group (black vectors), the AV values are an order of magnitude larger and much higher than expected for our sample. Again, this is to illustrate the directionality of the reddening effect, which is particularly small for the early group which rely on c1, the Balmer discontinuity index, for temperature, and β, a color between two narrow-band filters with nearly the same central wavelength, for logg. . . 65 2.14 Comparison of PARSEC isochrones (solid lines), Ekström isochrones
in the rotating case (dashed lines), and Ekström isochrones in the non-rotating case (dotted lines). The solid black lines are evolutionary tracks for stars of intermediate-mass, from the PARSEC models. All evolutionary tracks plotted are for solar metallicity. . . 67 2.15 Histograms of the visual extinction, AV, in magnitudes for individual
members of the four open clusters considered here. The extinction values are calculated using the relationAV =4.237E(b−y), with the
2.16 PARSEC isochrones and mass tracks (Bressan et al., 2012) in logTeff -logg space and the isochrones of Ekström et al. (2012) (including rotation, plotted as dashed lines) with ouruvbyβphotometric deter-minations of the atmospheric parameters. For early and intermediate group stars, the black filled circles represent thevsinicorrected atmo-spheric parameters (using the FB98 formulae), while the open circles represent the uncorrected parameters. Note that the late-group stars do not receive avsinicorrection but are still plotted as filled circles. In both cases the point sizes are∝ vsini. The typical uncertainties in our logTeffand loggdeterminations are represented by the error bars at the bottom of the figure. These uncertainties correspond to 1.6% or ≈ 0.007 dex in logTeff and 0.091 dex (intermediate), and 0.145 dex (late) in logg, corresponding to the RMS errors as determined in the effective temperature and surface gravity calibrations. Top left: IC 2602 members; the currently accepted age of IC 2602 isτ= 46+−65 Myr (Dobbie et al., 2010). Top right: Members of theαPersei clus-ter, which has a currently accepted age ofτ =90±10 Myr (Stauffer et al., 1999). Bottom left: Pleiades members where the currently accepted age of the Pleiades isτ=125±8 Myr Stauffer et al., 1998. Of the∼20 Pleiads that sit below the zero age main sequence, 5 are known pulsators of the δScu orγ Dor variety. Additionally, there is an excess of slow rotators sitting below the ZAMS. Possible reasons for this observed behavior include systematics of the atmospheric models (several authors have noted problems with the treatment of convection in ATLAS9 models at this mass range), failure of the evolutionary models to predict the true width of the main sequence (though this effect is unlikely to be as large as the scatter seen here), and overaggressive dereddening procedures. Bottom right: Hyades cluster members where the currently accepted age of the Hyades is τ=625±50 Myr Perryman et al. (1998). Note the far left outlier, HD
2.17 Left panels: 1D marginalized, normalized posterior PDFs in age, calculated from Bressan et al. (2012) evolutionary models, for in-dividual open cluster members. Black, teal, and red histograms represent early, intermediate, and late group stars, respectively. Mid-dle panels: Sums of the individual PDFs depicted on the left. This
figure shows the total probability associated with the 200 age bins between log(age/yr)=6.5 to 10. The grey shaded regions indicate the currently accepted ages of IC 2602 (46+−65Myr),αPer (90±10 Myr), the Pleiades (125±8 Myr), and the Hyades (625±50 Myr).Right pan-els: Products of the individual PDFs depicted in the left panels. The
grey shaded regions again depict the accepted literature age ranges of each cluster. . . 78 2.18 Best fitting isochrones found through χ2-minimization for four open
2.19 Characterization of our sample of 3499 nearby field stars. Upper panels: histograms of the spectral types (left) and distances (right) of
stars in our sample, taken from Anderson & Francis (2012). Middle panels: histograms of the V-band extinction in magnitudes (left), as
derived by the IDL program described in § 2.2.2, and the [Fe/H] values in dex from Anderson & Francis (2012). Lower panels: his-togram of the projected rotational velocities in our sample (left), with data taken from Glebocki & Gnacinski (2005), andvsini as a func-tion of spectral type (right) with grey x’s indicating individual stars and black squares representing the meanvsiniin each spectral type bin. The error bars represent the standard deviation in vsini values for each bin. The red triangles indicate the empiricalTeff-vsini rela-tion of Gray (2005) using the spectral-type-Teff relation of Habets & Heintze (1981). . . 82 2.20 Histograms of the uncertainties (in mag) for differentuvbyβindices
for the sample of ∼ 3500 field stars discussed in § 2.7. The solid lines in each plot indicate the position of the mean uncertainty in that parameter. Uncertainties in a0 andr
∗
are calculated according to Eqns. (13) & (14). . . 83 2.21 H-R diagram for our sample of B0-F5 field stars within 100 pc.
2.22 Normalized composite age PDFs for our sample of field B0-F5 stars within 100 pc. The normalized composite PDFs are created by sum-ming the normalized, 1D marginalized age PDFs of individual stars in a given spectral type grouping. The black curve represents the composite pdf for all spectral types, while the colored curves repre-sent the composite PDFs for the spectral type groups B0-B9, A0-A4, A5-A9, F0-F5 (see legend). Circles represent the expectation values of the composite PDFs, while squares represent the medians. The solid and dashed lines represent the 68% and 95% confidence inter-vals, respectively, of the composite PDFs. The statistical measures for these composite PDFs are also presented in Table 2.6. . . 88 2.23 Empirical spectral-type-age relation (left) and spectral-type-mass
re-lation (right) for solar neighborhood B0-F5 stars. Grey x’s represent individual stars, while the black scatter points represent the mean value in a given spectral type bin and the error bars represent the scatter in a that bin. . . 88 2.24 Comparison of ages for BAF field stars derived through 2D linear
in-terpolation and Bayesian inference. Grey points represent those stars with∆log age/yr >1 (in the sense of Bayesian minus interpolated), which coincide with the same stars that reside below the MS. . . 92 2.25 2D joint posterior PDFs in age and mass for an early-type star with
2.27 The effect of metallicity onuvbyβdeterminations of temperature, as predicted by model grids of Castelli & Kurucz (2006) and Castelli & Kurucz (2004). In the left-most figure, for given values ofTeff, or
(b− y), the ratio of the temperature given by the grid of metallicity
[M/H]=-0.5 to the solar metallicity grid is depicted in the top panel. The bottom panel shows the ratio of the temperature given by a grid of metallicity [M/H]=+0.5 to the temperature given by the solar metallicity grid. In the temperature range of interest (≈ 6500K-8500K, or spectral types F5-A4), a shift of 0.5 dex in [M/H] can produce variations up to∼1% inTeff, with the smallest discrepancies occurring at approximately the F0-A9 boundary. The middle figure is analogous to the left figure, for thea0−r
∗
grids which are used for stars between≈8500K-11000K (A3-B9). In this regime, shifts of 0.5 dex in metallicity can produce variations up to∼ 2% in temperature. Finally, for the hottest stars (Teff > 11000 K, spectral types B9 and earlier), a 0.5 dex shift in metallicity can produce variations up to
∼ 6% in effective temperature. . . . 99
2.28 The effect of metallicity onuvbyβdeterminations of surface gravity, as predicted by model grids of Castelli & Kurucz (2006) and Castelli & Kurucz (2004). In the left-most figure, for given values of logg, or c1, the ratio of the temperature given by the grid of metallicity [M/H]=-0.5 to the solar metallicity grid is depicted in the top panel. The bottom panel shows the ratio of the temperature given by a grid of metallicity [M/H]=+0.5 to the temperature given by the solar metallicity grid. In the temperature range of interest (≈ 6500K-8500K, or spectral types F5-A4), a shift of 0.5 dex in [M/H] can produce variations up to ∼ 0.1 dex in logg. The middle figure is analogous to the left figure, for thea0−r
∗
2.29 Left panels: 1D marginalized, normalized posterior PDFs in age, calculated from Bressan et al. (2012) evolutionary models, for in-dividual open cluster members. Black, teal, and red histograms represent early, intermediate, and late group stars, respectively. Mid-dle panels: Sums of the individual PDFs depicted on the left. This
figure shows the total probability associated with the 200 age bins between log(age/yr)=6.5 to 10. The grey shaded regions indicate the currently accepted ages of IC 2602 (46+−65Myr),αPer (90±10 Myr), the Pleiades (125±8 Myr), and the Hyades (625±50 Myr).Right pan-els: Products of the individual PDFs depicted in the left panels. The
grey shaded regions again depict the accepted literature age ranges of each cluster. . . 107 3.1 Top panel: Systematics corrected K2 SAP light curve with our GP
stellar variability fit in orange. Observations circled in red were excluded from the variability fit. Bottom panel: Corrected light curve obtained from dividing out the variability fit and excluding outliers. . . 113 3.2 Systematics-correctedK2light curve phase-folded on the orbital
pe-riod (top) and on the rotational pepe-riod (bottom). Points are col-ored according to the time of observation. Rotational modulation of starspots is clearly demonstrated. The variable amplitude of the spot signature suggests a changing spot fraction. Though the eclipses are clearly not in phase with the rotational period, we discuss in § 7.7 the likelihood that the system is tidally synchronized with the difference in spot and orbital periods due to a latitudinal gradient in the rotation rate. . . 117 3.3 Best-fit jktebop model to the K2 photometry (top panels) and the
3.4 Isochrones in the mass-radius plane with the components of HII 2407 and benchmark EBs from Torres et al. (2010) overplotted. From left to right, the evolutionary models depicted are from Siess et al. (2000), Baraffe et al. (2015), and Bressan et al. (2012). All models plotted are for solar metallicity (Z=0.02). Unlike the Torres et al. (2010) sample, the masses and radii of the HII 2407 components are model-dependent.125 4.1 K2 Campaign 4 pointing (grey) with observed Pleiades and Hyades
members overlaid. Eclipsing or transiting systems discussed in this paper are indicated by pink points. . . 131 4.2 V vsV −Ks photometric color magnitude diagram for the observed
known members of the Pleiades (left) and Hyades (right) clusters. The red highlighted points are the EBs reported in this paper. . . 135 4.3 Top panel: The systematics corrected K2 light curve for HCG 76
with our variability fit indicated by the orange curve. Outlier points excluded from this fit are marked by the red circles. Bottom panel: The rectified light curve, from dividing out the variability fit above, upon which we performed our fitting procedure. In both panels the gray shaded region highlights a portion of the light curve that is poorly modeled by the variability fit, leading to the introduction of systematics in the rectified light curve. . . 139 4.4 Lomb-Scargle periodogram of the variable light curve for HCG 76
(left) and the K2 light curve for the object phase folded on the two strong rotational periods detected in the periodogram (middle and right panels). Outliers (both flares and eclipses) have been removed from the light curves in these figures for the purposes of illustrating the sinusoidal rotation signals. . . 139 4.5 Best-fit jktebop model to theK2photometry (top) and Keck/HIRES
4.6 The positions of HCG 76 components relative to BHAC15 isochrones in the mass-radius plane (left),Teff−loggplane (middle), andTeff− logL/L plane (right). Square points represent best-fit values and errorbars indicate 1-σuncertainties. We assumed 100 K uncertainties
in the temperatures and propagated these through in determining the luminosity uncertainties. The two components are consistent within error of being coeval in the mass-radius plane at ∼100 Myr, though they appear younger in theTeff−loggplane. The luminosities calculated from the Stefann-Boltzmann law, the measured radii, and photometric temperatures, are significantly larger than the model predictions. . . 143 4.7 BHAC15 isochrones in the mass-temperature, radius-temperature,
mass-luminosity, and radius-luminosity planes (clockwise from up-per left panel) compared to the derived parameters for the HCG 76 components. In each panel, the dashed line indicates the 120 Myr isochrone shifted by 200 K towards cooler effective temperatures (or the luminosities resulting from such a shift). . . 144 4.8 Detrended normalized light curve for MHO 9 (BPL 116). The full
unphased light curve is shown on the left with the phased light curve zoomed in on the primary eclipse shown on the right. . . 148 4.9 Lomb-Scargle periodogram for the systematics corrected light curve
of MHO 9 (left), phased at the inferred rotation period (right). Eclipses are excluded in the scaling of this figure for clarity. . . 148 4.10 jktebop fit to theK2light curve and RVs for MHO 9. The RV point
near phase of 0.3 (corresponding to the UT 2016-01-24 observation) was not included in this analysis but is entirely consistent with our best fit. . . 149 4.11 Top panels: K2 PDC SAP light curve for HD 23642 phase folded
on the orbital period of≈2.46 days, with the best-fit jktebop model plotted in orange. Bottom panel: Literature radial velocities from Munari et al. (2004) and Groenewegen et al. (2007) with the best-fit jktebop models indicated by the red and blue curves. In each panel the best-fit residuals are plotted below. . . 153 4.12 The completeK2light curve for HD 23642, phase folded on the best
4.13 PARSEC v1.2S 120 Myr isochrones (Bressan et al., 2012; Chen et al., 2015) in the mass-radius plane, of different metallicities. Several direct determinations of the masses and radii of the double-lined EB HD 23642 from the literature are indicated, along with our new determinations from the highly preciseK2light curve and literature RVs. . . 155 4.14 Lomb-Scargle periodogram (left) and K2 PDC light curve phase
folded on the favored rotation period of vA 50 (right). The other significant peak in the periodogram is at the half-period alias. . . 161 4.15 Measured RVs of vA 50 (HAN 87, EPIC 210490365) folded on the
two possible periods of ∼ 3.48 and ∼ 6.97 days, respectively. RVs from Mann et al. (2016b) are plotted with green circles while our reported RVs are plotted with blue squares. The dashed horizontal lines represent the median velocity of all RVs and is therefore assumed as the systemic velocity. The red curve represents a circular orbit with an amplitude of 0.3 km/s. This is not a fit, but rather a representative of the approximate maximum amplitude allowed by an RV curve to still be consistent with observations. This limit is used in Figure 4.16 to constrain the maximum mass of the companion for each of these periods and ultimately rule out a stellar companion. The blue curve on the left panel represents the maximum amplitude of the estimated mass of the planetary companion. . . 164 4.16 Expected RV semi-amplitude as a function of the mass of the
com-panion, assuming M1 = 0.261M and i = 90
◦
, for both possible periods (3.48 days shown as a solid blue line, 6.97 days shown as a dashed red line). Dotted vertical lines represent the masses of Nep-tune and Jupiter, respectively. The dot-dashed horizontal line depicts the approximate maximum amplitude that would be consistent with the measured RVs shown in Figure 4.15. This clearly rules out a stellar-companion, which also implies that the true period is in fact 3.48 d. . . 165 4.17 Phase folded K2 light curve of vA 50 with the best-fitting jktebop
4.18 Mass-radius diagram for all currently known eclipsing binaries in the Pleiades star cluster. With the exception of HII 2407 which is single-lined, each system is double-lined with dynamically deter-mined masses. The solid and dashed curves show PARSEC v1.2S and BHAC15 isochrones for solar metallicity (Z=0.02). . . 166 4.19 Top panels: K2PDC SAP light curve for AK II 465 phase folded on
the orbital period, with the best-fit jktebop model plotted in orange. Bottom panel: Radial velocities with the best-fit jktebop models indicated by the red and blue curves. In each panel the best-fit residuals are plotted below. The structure in the residuals to the fit of the primary eclipse is likely due to inadequate modeling of limb darkening. . . 170 5.1 Left column: K2postage stamps showing the regions around the three
EB systems. Orientation is such that north is up and east is left. The K2plate scale is∼400/pixel. The magenta circles indicate the
photo-metric apertures used for light curve extraction. The points represent the nominal locations of the sources from the target pixel file header information and may not be centered on the star due to small errors in the WCS (World Coordinate System). For EPIC 203476597, the sec-ond, smaller aperture around the neighboring star to the west was used to compute the time-averaged flux which was ultimately subtracted from the raw EB light curve. Right column: DSS2 “infrared" views of the corresponding regions presented on the left. The potential for contamination in theK2 photometry due to either unresolved or spatially resolved nearby sources is discussed in the text individually for each EB system. . . 176 5.2 For each of the three eclipsing binary systems, raw K2(top panels)
5.3 Sections of the HIRES spectra showing a photospheric region (lower left), the Li I6707.8 Å and Ca I6717 Å lines (upper left) and the Hαline profiles (right). All three stars show Hα activity and have LiIabsorption. The spectra of EPIC 203710387 and EPIC 203868608 are clearly double-lined, as seen most prominently in the two com-ponents of Hα emission (each of which is double-peaked) and in the doubled Li Iabsorption, but also in the TiO bandhead regions. The red line indicates a second spectrum of EPIC 203476597, which differs from the black (first) that it overlays in its Hα profile and in the Li Iline, where a small absorption blueward of line center moves to become enhanced absorption redward of line center. The full time series of spectra is shown for EPIC 203476597 in the Hα panel; we interpret the profile variations as due to orbital motion of a faint young Hαemitting secondary, which is indeed revealed in the absorption lines from differences and ratios of the spectra. . . 182 5.4 PhasedK2light curves (black points) with best-fitting jktebop
mod-els (red curves). Residuals are plotted below the model fits. Observa-tional errors are determined by the RMS scatter in the out-of-eclipse portions of the light curves. From top to bottom, the periods of these three EBs are approximately 2.8 d, 4.5 d, and 1.4 d. . . 185 5.5 Available USNO BV, 2MASS J HK, UKIDSS ZY J HK, and WISE
W1,W2,W3,W4 photometry or 1σ upper limits (downward
point-ing triangles) compared to NextGen2 model atmospheres. For both EPIC 203710387 and EPIC 203868608, a model atmosphere with
Teff = 3000 K and logg = 4.0 fits the photometry well. Adopting
AV = 0.9 mag (red line) produces a better fit to the photometry than
5.6 For each EB studied here, the radial velocity curve (upper panel) and best-fit residuals (lower panel). The measurements are phase-folded on the best-fit period from simultaneous fitting of RVs and the K2 light curve with jktebop. The red and blue points and curves are the observations and best-fit model, for the primary and secondary components, respectively. Each point indicates the weighted mean radial velocity derived from measurements over several spectral or-ders within a single spectrum. Each measurement receives a weight equal to the inverse of the variance. The error bars represent the cor-responding standard deviation between the multiple measurements, which in the top panel are smaller than the points themselves. In the case of EPIC 203868608, which is a triple system, two measure-ments at essentially the mean systemic velocity of Upper Sco (∼-4 km s−1) are indicated by the black crosses. These measurements are likely compromised due to the low expected velocity separation that is comparable to the spectrograph resolution, and were consequently excluded from the RV fits in order to obtain a good fit. . . 191 5.7 Distributions of selected free and derived parameters and their pairs
5.8 Isochrones in the mass-radius (top) and temperature-luminosity (bot-tom) planes with the three EBs discussed here and two other low-mass systems in Upper Sco: both components of UScoCTIO 5 (Kraus et al., 2015) and the primary of the triple system ScoPMS 20 (Mace et al., 2012). The BHAC15, PARSEC v1.2s (Bressan et al., 2012; Chen et al., 2014), Siess et al. (2000), and Pisa (Tognelli et al., 2011) pre-MS evolutionary models at solar metallicity (Z=0.02) are considered for comparison. The two components of EPIC 203710387 are over-lapping in the mass-radius plane. UScoCTIO 5 and EPIC 203710387 have fundamentally determined masses and radii; errors are smaller than the points themselves. The eclipsing components of EPIC 203868608 also have fundamentally determined masses and radii, though large uncertainties remain for this system, particularly in the luminosities, for the reasons discussed in § 5.6.2. The tertiary of this system does not have fundamentally determined parameters and hence is represented by the filled black triangle. All other systems have parameters that depend on models and/or empirical relations. In the lower panel, the equal-temperature, equal-luminosity compo-nents of UScoCTIO 5 are offset for clarity. No single isochrone can reproduce the fundamentally determined masses and radii of both the EPIC 203710387 and the UScoCTIO 5 systems. . . 196 5.9 Above: A Lomb-Scargle periodogram analysis of the EPIC 203476597
raw light curve for 10,000 periods between 1 and 4 days, using the
lombscargleroutine in thescipy.signalPython package. The
5.10 BHAC15 isochrones showing an enhanced view of the mass-radius plane (left), as well as the Teff-log(L/L) (middle), and Teff-logg (right) planes. In each case the 3, 5, 8, 10, and 15 Myr isochrones are plotted, from darkest to lightest. The red points indicate the positions of both components of EPIC 203710387, while the black scatter points represent the components of UScoCTIO 5. The dark red shaded squares indicate the parameters of EPIC 203710387 from the eccentric orbit solution, while the light red open squares show the circular solution values. The components of UScoCTIO5 are assumed to have equal temperatures and luminosities, but are offset for clarity here. For both systems, the uncertainties in mass, radius, and loggare smaller than the points themselves. . . 207 5.11 BHAC15 isochrones in the mass-radius plane. Overplotted are
com-pilations of double-lined EBs with fundamentally determined masses and radii, either in the pre-MS phase of evolution (Stassun et al., 2014) or MS/post-MS phases of evolution (Torres et al., 2010). At a fixed mass, the radius evolves vertically downward in this diagram. We include recently characterized, double-lined eclipsing members of Upper Sco. For UScoCTIO 5, first characterized by Kraus et al. (2015), we overplot our revised parameters. We additionally input small offsets to our derived parameters for EPIC 203710387 and EPIC 203868608 for visual clarity. We do not include the tertiary for this latter system since a fundamental determination of the mass and radius for that component was not possible. We stress that unquan-tifiable uncertainties remain for EPIC 203868608, but we include the EB components here for illustrative purposes. The pink points correspond to the triply eclipsing system HD 144548 (Alonso et al., 2015). . . 216 5.12 Best-fit jktebop models to our detrendedK2light curve for
6.1 Color-magnitude diagram for Upper Sco, with EBs discovered inK2 data highlighted by the colored points. The black points are members suggested in Luhman & Mamajek (2012). We have not applied any corrections to the photometry based on our knowledge of the mass or flux ratios of the binaries and higher order multiples studied here. . . 237 6.2 Speckle imaging results for four of the EBs discussed here. The data
for EPIC 203476597 originate from the NESSI instrument on the WIYN telescope. For the rest, the speckle data were acquired with the DSSI instrument at Gemini South Observatory. EPIC 202963882 has a companion at 1.2300, and its contrast at 692 nm and 880 nm are represented as the red and blue points respectively. We determined from Keck/HIRES spectroscopy that this companion is the EB. . . 238 6.3 Joint fits to theK2photometry and radial velocity time series of HR
5934. The two most discrepant secondary radial velocities, with large errors, originate from Andersen & Nordstrom (1983). . . 243 6.4 K2photometry of USco 48 phase-folded on the rotational modulation
period, which is commensurate with the binary orbital period. The shallow, grazing eclipses are highlighted by dotted lines. . . 248 6.5 Joint fit ofK2 photometry and HIRES RVs for USco 48. In this fit
the radius ratio was fixed at unity. . . 249 6.6 Fit to the radial velocities of RIK-72. The 17.1 d orbit is much shorter
than the period of the EB, which is longer than theK2 campaign of 78.8 d. The period is also longer than the 10.5 rotation period inferred from the light curve modulation. . . 253 6.7 Joint fits to the K2 photometry and radial velocity time series of
UScoCTIO 5. . . 256 6.8 Joint fits to the radial velocity time series of the spectroscopic
bi-nary component of EPIC 203868608. The curves show fits using parameters from 100 randomly selected links in the Monte Carlo chain.258 6.9 Parameter covariances for the joint radial velocity fit of the
6.10 Mass-radius diagram. Colored curves are theoretical predictions from the MIST models (Dotter, 2016; Choi et al., 2016) in the non-rotating case (solid) and non-rotating case (dotted). Eclipsing binaries in the Upper Scorpius OB association are represented by the black points. The black crosses show previously published solutions for EPIC 203710387 (David et al., 2016b) and UScoCTIO5 (Kraus et al., 2015). . . 261 6.11 Chi-squared statistic as a function of age for non-rotating MIST model
fits to the eclipsing binary radii in Upper Scorpius. The χmin2 age of Upper Scorpius according to this model set is 7.4 Myr . . . 262 6.12 Probability density functions in age for individual stars in eclipsing
binaries in Upper Scorpius. Ages are derived from interpolation within MIST models. . . 263 7.1 Spectral energy distribution of RIK-210 along with a NextGen stellar
atmosphere model (Hauschildt et al., 1999b) normalized to the J-band point. Including a small amount of reddening (black) improves the fit over the unreddened model (green). . . 269 7.2 K2 light curve of RIK-210 in 20-day segments (black points). The
7.3 K2light curve of RIK-210. In each panel, the point color indicates the relative time of observation (with red corresponding to earlier times). Upper left: photometry folded on the rotational/orbital period of 5.67 d. Bottom left: same as above, showing an enhanced view of the dimming events. Middle: Same as the upper left, but with vertical offsets applied after each rotation of the star. Right: Same as middle, showing an enhanced view of the dimming events. There is clear evolution in the depth, duration, and overall morphology of the dimming events, a strong indication against a transit by or eclipse of a single solid body of any size. Some flares appear to occur at approximately the same rotational phase, shortly after the transit events.271 7.4 Individual dimming events within the K2 light curve of RIK-210,
after removing the starspot modulation. On the abscissa, the data are plotted in terms of time from the predicted minimum as determined from a linear ephemeris. The maximum depth, total duration, and time of minimum light are summarized in the lower right corner of each panel. . . 272 7.5 Top: Phase folded and binned K2 light curve of RIK-210 after
re-moving the starspot rotation signal via an iterative spline fit. Bottom: variance in the phased and binned light curve. Variability fit B was used to make this plot. . . 276 7.6 Waterfall diagram of RIK-210. Colors represent the K2light curve
intensity, with blue corresponding to higher flux and red to lower flux. The primary dimming events that are the focus of this work are clearly seen as the dark red stripe, which changes in intensity, duration, and timing. At top left, a series of light blue stripes between phases of 0.2 and 0.3 are observed to apparently drift in phase over the first four cycles. These are some of the shallow flux dips discussed in § 7.3.9. Linear interpolation was performed over data gaps where spacecraft thruster firings were excluded. . . 277 7.7 Correlation between the dimming timing variatons and egress slopes.
Ad hoc uncertainties of 0.25 hr in timing variation and fractional
7.8 Composite of two independent JKTEBOP model fits to the two min-ima in the first dimming event of RIK-210 in theK2photometry. At least some of the individual transits observed by K2 are reasonably well fit by one to three spherical occulting bodies with large size relative to the star. The fit to the deeper dip alone is referred to later as the “minimum obscuration fit.” Variability fit B was used to make this figure. . . 283 7.9 JKTEBOP model (red) overplotted on the flattened K2 light curve
of RIK-210 (black points). The model above was fit to the deepest component of the first dimming event in theK2campaign, then refit to the entire light curve allowing only the period and time of mid-transit to vary. Few observations lie above this fit, perhaps suggestive of an underlying, spherical occulting body surrounded by a stream of dust or swarm of planetesimals. Variability fit B was used to make this figure, though the conclusions drawn are independent of the fit used. . . 283 7.10 Evolution of the primary dips in the K2 light curve of RIK-210. In
both panels, the top row shows data from the first dip, proceeding consecutively downwards to the bottom row, which shows the last observed dip. Left: the “minimum obscuration fit,” obtained by fitting a model to the deepest component of the first dimming event, with respect to subsequent individual transits. Right: evolution of the residuals to the fits depicted on the left. . . 284 7.11 Example of shallow dimming events seen late in the K2 campaign.
Here we show two events (indicated by different colored points) sep-arated by 5.888 days with consistent depth, duration, and morphology. 286 7.12 Flattened and median filtered K2light curve of RIK-210. The data
7.13 Left: Phase-binned and averaged light curves of RIK-210 at three epochs from WASP,Kepler/K2, and LCOGT (in bothVandi0filters). Each light curve is phase-folded on the K2dip ephemeris. A broad depression in the WASP data between phases 0.3 and 0.5 is suggestive that the dip may have been present in previous years, but drifting in phase, becoming narrower, or both. However, inspection of the WASP data by year suggests this feature in the combined light curve may be due primarily to a combination of a questionable dip in 2006 and evolution of the spot pattern, most notable in the 2008 data. Right: WASP data ordered by year, phase-binned and averaged by weighting data points inversely to their photometric uncertainties. Data are offset vertically from the 2006 median value. Errorbars correspond to the standard deviation in a given phase bin. Only WASP data with photometric errors<0.4 mag were used. There are typically 2500–8000 measurements per year. Although there appear to be dimming events in prior years (e.g. at phases of 0.2 and 0.4 in 2006, phase 0.65 in 2008, or phase 0.45 in 2009), further inspection of the data indicate that many of the narrow structures above result from only one or two nights of observations. . . 290 7.14 Median-subtracted radial velocities for RIK-210 phased on the
pe-riod of theK2light curve. The dotted line indicates the approximate location of the deep dimming events present in K2photometry, but absent in ground-based follow-up acquired closer to the time of spec-troscopic observations. For illustrative purposes we show redundant phases with lighter shaded points. . . 293 7.15 Variations of the Hα profile (colored curves) as a function of
rota-tional phase, from the Keck-I/HIRES spectra. The black line repre-sents the phase-averagedK2light curve. We emphasize that follow-up photometry, acquired around the same time as the spectra, did not show the∼20% dimming at phase = 0.5 observed byK2. . . 295 7.16 Constraints on the brightness (top panel) or mass (lower panel) of
7.17 Minimum orbital period for grains of varying compositions to exist in the solid phase, as a function of the central star’s effective temper-ature. Dust sublimation temperatures are taken from Kobayashi et al. (2011), and the stellar parameters needed to calculate the correspond-ing orbital periods are obtained from the PARSEC v1.2s pre-main sequence models (Bressan et al., 2012; Chen et al., 2014). For each grain composition, the upper and lower boundaries of the shaded regions are set by the 5 and 10 Myr isochrones, respectively. The position of RIK-210 is shown by the black point. Dust grains with compositions ranging from carbon to obsidian could exist in the solid phase at the corotation radius, while iron grains may sublimate. . . . 307 7.18 Pericenter separation for a range of eccentricities assuming a
semi-major axis of 0.05 AU (black line). The colored lines reflect the limiting Roche radius for bodies of varying densities. Eccentricities greater than 0.4 would be required to bring a body interior to its Roche limit for any of the densities plotted here. . . 309 7.19 Expected depths and durations for equatorial transits of RIK-210 by
an optically thick Hill sphere for planets of various masses. Fiducial masses are plotted as black points and annotated with text. However, the planet mass and fraction of the Hill sphere that is optically thick is completely degenerate in this plane. Thus, we show the effect of how these fiducial planet masses move along this curve when only 90% of the Hill sphere is optically thick (open circles). The grey shaded region indicates the range of depths and durations observed in theK2light curve. . . 311 8.1 Light curve of K2-33. a-d,K2photometry in twenty-day segments.
8.2 Constraints on astrophysical false positive scenarios. To confirm the planetary nature of K2-33 b, we considered and eliminated nearly all false positive scenarios involving eclipsing stellar binaries. a, The domain of sky-projected separation and contrast of a putative unas-sociated eclipsing stellar binary, aligned with K2-33 by chance. The blue hatched region shows eclipsing stellar binaries eliminated using multi-epoch adaptive optics imaging, which leverages stellar proper motion to provide sensitivity at all separations within 5”. Green and purple regions represent constraints from optical spectra and seeing-limited imaging, respectively. Finally, eclipsing stellar binaries in the grey region cannot account for the observed transit depth and are eliminated. b, Limits on eclipsing stellar binaries associated with (that is, gravitationally bound to) K2-33. Constraints from imaging and spectroscopy are shown as a function of physical separation. The lack of detectable stellar acceleration provides an additional diagonal constraint at top left. ∆mag, difference in magnitude. . . 326 8.3 Extended Data Figure 1. K2 light curve for K2-33 phased on the
8.4 Extended Data Figure 2. Model-dependent age of K2-33. a, Solid lines show mean stellar density as a function of effective temperature for pre-main-sequence stars having different ages, according to theo-retical models (Baraffe et al., 2015). Grey points represent plausible combinations of density and temperature for K2-33 as determined by light-curve fits and stellar spectroscopy. b, Distribution of implied stellar age based on temperature, density, and pre-main sequence models. The implied age of 2–7 Myr is consistent with our adopted age of 5–10 Myr, derived independently. Dark and light grey shaded regions indicate 68% and 95% confidence intervals, respectively. . . 337 8.5 Extended Data Figure 3. Apparent radial velocity variations of
K2-33. Line-of-sight velocities and 1σ uncertainties (standard devia-tions) with respect to Solar System barycenter from Keck/HIRES are indicated. Radial velocities (RVs) are mean-subtracted, and the abscissa shows the orbital phase of K2-33 b measured fromK2 pho-tometry (mid-transit occurs at zero orbital phase). We rule out RV variations larger than 300 m s−1at 68.3% confidence, corresponding to a 1.2MJupiterplanet mass. Curves show the expected radial velocity variations for planets having circular orbits and different massesMP. Radial velocities due to a 1.0 Jupiter mass planet (blue) are consistent with our observations, while a 4.0 Jupiter-mass planet is ruled out at high confidence. . . 338 8.6 Extended Data Figure 4. Images of K2-33. a, K2 target pixel
file (TPF). b, Sloan Digital Sky Survey (SDSS) optical image. c, Keck/NIRC2 K-band image. Extents of theK2target pixel file,K2 photometric aperture, and NIRC2 image are shown respectively with black, green, and purple boundaries. In each image, north is up and east is left. Three other sources identified by SDSS reside within the K2photometric aperture, one of which is a galaxy. All are 7.3–10.1
8.7 Extended Data Figure 5. Sensitivity to non-comoving sources in the vicinity of K2-33. The blue X marks the star’s position in 2011. Between 2011 and 2016, the star moved by 0.”1228 ± 0.”0085 (red X) owing to proper motion. Contours show K-band sensitivity to non-comoving stars from adaptive optics imaging from both epochs. The 2011 data set included non-redundant aperture masking, and pro-vided tighter constraints. The combined sensitivity to non-comoving objects is the maximum contrast achieved for either data set. Owing to stellar proper motion, we achieved K-band contrasts of>3.3 mag throughout∆R.A.–∆Dec plane, even at the 2011 and 2016 positions of K2-33. . . 339 9.1 Spatial distributions of all stars observed during Campaign 2 of the
K2mission (grey points) and the subset of young stars considered in
this study (black points). The concentration of black points near the middle of the detector mosaic is due to the densely populated ρOph cloud. The two blank squares in the mosaic are due to non-operational CCD modules. . . 343 9.2 Number density of stars in proper motion space observed during
Campaign 2 of theK2mission. Blue points and contours indicate the region occupied by candidate members of the Upper Sco OB associ-ation, as determined with the machine-learning algorithm described in Riedel et al.,in prep.. . . 345 9.3 Hess diagrams for stars observed during Campaign 2 of theK2
9.4 Gaia G magnitude as a function of spectral type for Upper Sco members across a wide mass range (top) and for M-type stars only (bottom). Spectral types have been source from Preibisch et al. (2002), Slesnick et al. (2008), Luhman & Mamajek (2012), and Rizzuto et al. (2015). A 5th order polynomial fit is shown by the pink line. The standard error in the distance modulus from a normal distribution of distances with center 140 pc and width 20 pc is shown by the errorbar. . . 353 9.5 Histogram of the visual extinction in magnitudes as reported by three
large surveys of GKM type members of Upper Sco. . . 356 9.6 (G−Ks) vs. Gcolor-magnitude diagram for our sample, showing our
empirical fit to the


![Figure 2.7: Ratio of the uTvbyβ temperature to fundamental temperature as a function of[Fe/H]](https://thumb-us.123doks.com/thumbv2/123dok_us/966559.609835/96.612.216.400.73.245/figure-ratio-utvbyb-temperature-fundamental-temperature-function-fe.webp)