ABSTRACT— This paper discusses the results of a study conducted in Kerala, India, among 200 households, analyzing technical and behavioural patterns while selecting residential appliances. The end-use energy efficiency is analysed, focusing on the behaviour of customers and concepts of behavioural economics. A noticeable discrepancy was observed between different appliances and was found to bedependent more on biases and heuristics than efficient technologies. The study indicates that behavioural failures can make individuals act against overall social welfare and their own long‐term interest. Energy Policy and efforts to promote end use energy efficiency shall hence ensure that the set of choices that individuals make is for long term welfare‐maximizing. The Awareness-intent-action gap is one of the most important behaviour aspects to be addressed to, while devising energy efficient technology adoption policies and intervention strategies. Changing the behaviour and practices is probably more important than finding new sources of energy, as end-use energy efficiency through demand side management is a better option than supply side solutions. It is estimated that 3000 million units of electricity per annum can be saved by improving the energy efficiency of fans alone, in India.
Index Terms— Energy efficiency, behavioural economics, residential energy use, imperfect optimisation, bounded rationality.
I. INTRODUCTION
Many studies have been conducted on energy saving potential by adopting latest technologies, on various barriers and drivers that affect energy efficiency enhancement andend use energy efficiency, on energy management systems and on Demand Side Management (DSM) policies (Parikh J K, et al.1996, Thollander P, 2007,2013, Boegle A et al, 2010, Sorrell, S et al. 2000, Reddy B S, 2013, Sathaye, J A, et al. 2006). These studies evaluated drivers and barriers of energy efficient technologies based on direct cost, life cycle cost, cost of conserved energy, return on investments and quantum of energy saved. Most of these studies were relying on the concept that people are rational decision makers. According to this principle, in order to
This study was supported by Energy Management Centre, Government of Kerala for the purpose of providing assistance in the form of grants to initiate research work in energy studies with particular relevance to the State of Kerala, India, in the economic, social and industrial development
Manuscript received July06, 2018; revised July 29, 2018.
Jayaraman C is Co-founder and Immediate Past General Secretary of SEEM, and a PhD Student at Amrita Viswa Vidyapeetham (phone: 91-9447602966; e-mail: [email protected]).
Sasi K Kottayil isProfessor at Amrita School of Engineering, Coimbatore, India(phone: 91-9447340227;e-mail: [email protected]) SankeerthSanthosh is Assistant Manager – Projects at SEEM, Thiruvananthapuram, India
(phone: 91-9562964279; e-mail: [email protected])
make a rational choice consumer shall weigh the costs and benefits of various options, and need information on all the possible actions or goods they can choose from. This theory was used in much of the 1970’s energy conservation research, and intervention strategies mainly consisted of information campaigns and workshops as tools of highlighting the benefits of energy saving measures in the home (Martiskainen, M. , 2007)
However, recent research works demonstrate that people are rarely the rational decision makers as envisaged by traditional economic models and consumers’ choices and actions often deviate systematically from neoclassical economic assumptions of rationality (Frederiks, et al, 5102); one of the most plausible reasons for the failure of policy implementation is identified as behaviour (Stern P C, 1987). The changes in energy consumption are not influenced by technical aspects only, but also by users’ psychological aspects, (Poznaka L et al, 2015) and the potential source of market inefficiency is consumers’ cognitive limitations and psychological biases (Madrian B.C, 2014). It is also opined that, to change the trajectory of energy systems we need to go outside the physical sciences for input, mainly economics (Stern P.C, 2014). More recent research on behavioural economics identifies three broad categories of psychological biases such as imperfect optimisation, bounded self-control, and nonstandard preferences (Madrian, B. C. 2014).
This study is focusing on the behaviour and individual decision making at household level, in order to identify the gaps, so as to suggest policies and action plans that can be formulated to bridge these gaps and enhance adoption of energy efficient technologies. We are drawing insights from an exploratory study done among households, and map these insights to the overall residential electrical energy consumption in the State of Kerala to assess the potential energy saving and financial benefits to the utility.
II. EXPLORATORY STUDY TO IDENTIFY BEHAVIOUR PATTERNS OF ADOPTING TECHNOLOGIES FOR ELECTRICAL
APPLIANCES
A. Purpose
Household energy consumption is a function of many different factors. The purpose of this study was to analyze behavioural factors influencing adoption of energy efficient equipment among residential consumers. An understanding of end-user’s perspectives can help to improve adoption of energy efficient technologies and thusthe demand side management (DSM) potential. It will also help to identify
End Use Energy Efficiency in Residential
Sector- an Integrated Trans-disciplinary Study
which end-use equipment and/or which consumer sector and/or segment to be targeted. Hence, the first step was to identify the end-use applications that can potentially be targeted to reduce peak demand. Here, we focused on two end-uses such as lighting and fan. For each end-use we assessed the cost of one representative energy efficient technology. For lighting we evaluate the use of LEDs and for fans we used BLDC/Energy Efficient Fan technology.
B. Background
1) Average monthly electricity consumption
Residential electricity consumption in India is 24.32 % of the total power consumption, whereas that in the State of Kerala is 51%, which is very unique. Residential consumers in the State of Kerala represent 78% of the total consumer count of 1,16,68,031 Per-capita annual electrical energy consumption of the residential sector in the State is 280 units (kWh). Average monthly consumption per consumer during 2015-16 is 91 kWh. (KSEBL, 2016). The average monthly consumption of the State is equal to the national average, three-fourths of the average monthly household consumption in China, a tenth of that in the USA, and a third of the world average. The overall distribution of domestic consumers of Kerala, their average monthly consumption and that among the sample group surveyed are given in Table I.
Average monthly electricity consumption of consumers: comparison between population and sample
Utility billing slabs (in kWh)
Population (KSEBL
Consumers) N=1,16, 68,031 Sample Group N=200
Consumers %
Average monthly consumption
(kWh)
Consumers %
Average monthly consumption
(kWh) 0-40 26.3 25 1 39 41-80 31.6 64 15 62 81-120 22.9 100 28 105 121-150 8.5 143 17 142 151-200 6.3 185 16 173 201-300 3.7 282 19 231 301-500 0.5 411 4 354 Above 500 0.2 900 0 0
Those who consume upto 120 kWh per month among the Sample Group were categorised as low consumption group (LCG), those between 121 and 150 units as Medium Consumption Group (MCG) and the rest as the High consumption group (HCG). It can be seen that the strength of 0-40 unit category is very low in the Sample Group. The medium and high group representation are high with respect to the State population.
2) End Use Equipment Penetration data
An understanding of end-uses of electricity was assessed through across sectional survey. This helped to identify end-use options that offer the highest DSM potential. It also helped to identify which end-use equipment and/or which consumer sector and/or segment is to be targeted. Fig 1 shows the end use equipment penetration in the Sample
Group and the average number per total sample population of 143 consumers. (Out of 200 households surveyed, only 143 are considered for evaluation after data cleaning). Figs 1 and 2 give the details of the penetration of the most common electrical appliances among the sample population.
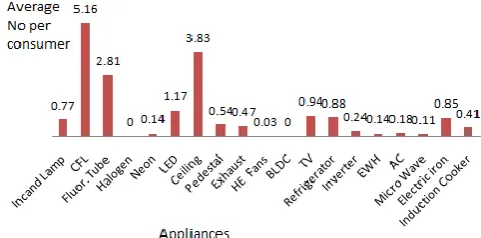
[image:2.595.312.553.135.254.2]Fig1: End use equipment penetration data: Average number of appliance/consumer among the sample population
Fig 2: End use appliance penetration data of sample population (Excluding Lights and Fans) with respect to High, Medium and Low consumption groups.
Fig 1 shows that the penetration of each of the energy efficient lamps such as Compact Fluorescent Lamps (CFL), Light Emitting Diodes (LED) and Fluorescent Lamps, is more than that of low efficient Incandescent lamps. The numbers of High Efficient and Brush Less DC (BLDC) fans are almost nil, even though the average number of fans per consumer is 3.85. All the groups have more than 80% penetration of TV, Refrigerators and Iron Box. Inverters, Electric Water Heaters and Induction cookers have penetration of more than 40%among the HCG group. Air Conditioners (AC) have high penetration among the HCG. High penetration of Inverters is due to the low reliability of the utility power. Increase in usage of Induction Cookers has created a new morning peak in the state apart from the evening peak hours. Very low penetration of Solar PV and Solar Water Heaters among the consumers in a State where the annual average solar insolation is 5.6 kWh/m2/day with favourable government policies inrenewable energy, is a matter of concern.
III. INCREASING END USE EFFICIENCY IN LIGHTING AND
FAN SYSTEMS
A. Energy Share of Light and Fan
shown in Table II. It can be seen that fans consume almost twice the energy used for lighting.
Table II
Comparison of Average Energy consumed for Lighting and Ceiling Fan by the sample group
Average energy for lighting # kWh /year/consumer
Average energy for ceiling fans ## kWh /year/ consumer 168 345
# assuming 50% of lamps operatefor 4 hours per day for 365 days in a year
## assuming fans operate for 8 hours per day for 300 days in a year
B. Choice preference
A survey was conducted among 200 households focusing on selected end use energy equipment and utility gadgets to understand the consumer behaviour, attitude, awareness and intent. The decision makers of the houses were interviewed further to get more details. Table III a and III b show the summary of the survey with regard to the selection of lighting appliances.
Table III a
Past preference while selecting the light fixture (How did you choose your existing Lighting Fixtures?) N=143
Choice Preference HCG (%) MCG(%) LCG(%) Colour of light 9 2 2 Brand 31 38 35 Electrician's choice 13 6 13 Suggested by
friend/relative/expert 0 3 1 Efficiency 28 34 33 Cost 19 17 16
Table III b
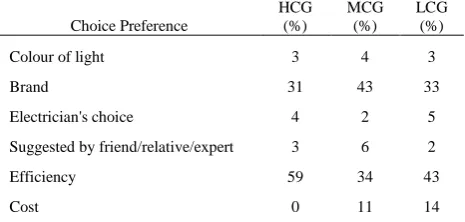
Future preference while selecting the Light Fixture (How will you choose your Lighting Fixtures while planning replacement?) N=143
Choice Preference
HCG (%)
MCG (%)
LCG (%) Colour of light 3 4 3 Brand 31 43 33 Electrician's choice 4 2 5 Suggested by friend/relative/expert 3 6 2 Efficiency 59 34 43 Cost 0 11 14
Table III a and III b show that choice preference did not vary much with the High, Medium or Low income groups and the Brand played a major role in selecting the equipment. When the respondents were asked to spell out their preferences for the future purchases (whenever the light fixtures are replaced) Brand of equipment continued to play a dominant role in the selection process. There was an increase in percentageofhigh efficiency among high and low consumption groups. Contrary to the neo classical theories of economics, initial cost did not factor as the major choice preference.
Brand played a major role in the selection process of the
existing fans and continued to be the most dominant choicefactor for replacement, as seen in Tables IV a and b. Efficieny as a choice for the repalcement showed that intent to adopt energy efficient technologies had increased. 38% of the HCG favoured energy efficiency while it was30% among the LCG.
Table IV a
Past preference while selecting the Fan (How did you choose your existing Fans?)N =143 Choice Preference
HCG
(%) MCG(%) LCG(
%) Colour of Fan 3 4 0
Brand 41 57 43 Electrician's choice 9 7 14
Suggested by
Friend/Relative/expert 6 6 5 Efficiency 28 9 19
Cost 13 17 19
Table IV b
Future preference while selecting a new fan (How will you choose a fan while planning a replacement?) N=143
Choice Preference
HCG
(%) MCG(%) LCG
(%)
Colour of Fan 3 6 2 Brand 44 62 43 Electrician's choice 3 4 6
Suggested by
Friend/Relative/expert 3 2 2 Efficiency 38 15 30
Cost 9 11 17
C. Awareness – Intent Gap
Energy Awareness among the respondents was assessed based on the responses to the questions given below: 1. Are you aware of Energy Labeling?
2. Do you have energy labeled equipment in your house? 3. Are you familiar with the Awareness programmes carried out by Energy Management Centre?
[image:3.595.47.280.525.636.2]Among the HCG and MCG, 40-45% are in the Excellent and Good categories, whereas it is 20% for LCG.
Fig 3: Energy Awareness among different consumption groups
[image:4.595.47.264.329.474.2]Fig 4a and Fig 4b show the awareness intent gap for lighting and fan.
Fig 4a: Awareness- Intent Gap: Lighting Replacement
[image:4.595.307.551.381.506.2]Out of the 103 consumers who are energy aware (considering only the satisfactory, good and excellent groups, excluding the poor), 56 (52%) showed intent to replace the lamps with energy efficient ones, showing a Gap of 48%.
Fig 4b: Awareness- Intent Gap: Fan Replacement
Only 33 members (32%) of the energy aware group(excluding the poor) showed intent to adopt energy
efficient fans when they plan to replace them showing a gap of 68%.
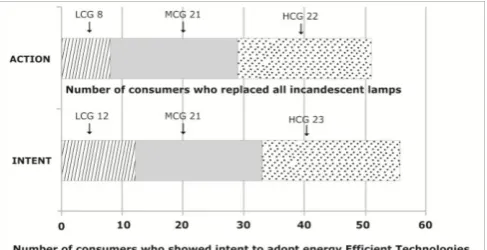
D. Intent - Action Gap
Among those who had shown the intent to replace the lamp with energy efficient lamps, it is expected that all the inefficient Incandescent lamps will be replaced with more efficient lamps (either CFL/Fluorescent or LED). We analysed the Intent-Action gap in lighting by finding the number of consumers who had shown the intent to choose energy efficiency as their first choice and are yet to replace the low efficient Incandescent lamp. Among those who had shown the intent to replace the fans with energy efficient ones, it is expected that all the conventional ceiling fans will be replaced with more efficient fans (either 5 Star or BLDC) even before it is due for replacement or when it fails. Also, it is expected that those who are aware will opt for high efficiency fans when a fan fails, instead of repairing or rewinding it. The Intent - Action gap in the case of fans is analysed, finding the difference in number of consumers who had shown the intent to adopt energy efficient fans and the number of consumers who will not wait for the fan to fail when they plan for replacement (in other words, who will replace it for increasing efficiency or since it is old). It is also expected that the energy aware group will consider the high running cost of old or rewound fans (due to low efficiency) and will not opt for repair or rewinding of a failed fan.
Fig 5a: Intent – Action Gap: Lighting Replacement
Fig 5 a shows that the intent to have energy efficient lighting system is translated into action, in almost 100% of the cases among the HCG and MCG and 80% of the LCG.
[image:4.595.47.265.571.707.2] [image:4.595.305.551.582.754.2]Fig 5b shows that intent- action gap is very high in case of adopting energy efficient technology for fans as only 31 % of the consumers who showed the intent to adopt energy efficient technology were willing to replace a fan when it is old and less efficient. Similarly only 22% of the group was willing to buy a new fan when it fails and had plans to repair or rewind the fans for re-use.
IV. FACTORS INFLUENCING ADOPTION AND NON ADOPTION OF ENERGY EFFICIENT TECHNOLOGIES
A. Enabling Factors
In the case of LED lights, major factors that can enhance adoption are low cost of conserved energy, longer Life (15-25 times), improved energy efficiency (10 times more), low carbon foot print, reduced pollution compared to CFL and Fluorescent lamps, lower initial cost, suitability for both AC and DC electrical supply systems, wide variety of available power ranges, low Intent-Action Gap, quick pay back, easy retrofit and low life cycle cost.
Fans consume almost two times the energy when compared to lights in almost all non-air conditioned buildings. Latest market data shows that 35 million ceiling fans are sold in India every year. The power consumption of these fans varies from 80 W for a non-branded low-cost one (Rs. 600/-) to 60 W for a branded economy model (Rs 1200/-). There is a very tiny segment of energy efficient fans in the market, whose power consumption is much lower and varies from 50 W for a 5-star fan (premium) that costs Rs 2200/- to 28 W for a BLDC fan, that costs Rs 3300/-. The power consumption of a BLDC fan can be as low as 10 W at low speed. Considering an average reduction of power to the tune of 40-50 W per fan, running on an average for 8 hours per day for 300 days per annum, replacing a conventional fan with super-efficient fans can save not less than 3000 million units of electricity per annum in India.
Low power consumption is the major enabling factor in the case of Energy Efficient fans as fans consume two times more energy in most of the houses. The service value of fan is determined by just one factor -the free air delivery- unlike the lamps that have several characteristics that determine its service value such as colour rendering index (CRI), colour of light, mountability, aesthetics, etc. The versatility is very high for BLDC fans as they can be used as a perfect choice for Solar PV based DC applications, which is going to be the most potent energy conservation measure in the coming decade. It also has very low energy consumption at low speeds and can be controlled by remote operating switch avoiding the need for speed regulators and this can lead to considerable amount of saving in house wiring.
B. Barriers
Detailed discussions were carried out with the consumers during the survey and various factors were identified that act as barriers for adoption of energy efficient technologies. One major difference identified in the case of Fans, when compared with lighting devices, is that the decision maker while purchasing a fan is more often a third party (Contractor or Electrician). Also, in the case of fans it is possible to repair and reuse a defective fan, increasing its utility time and value, unlike most of the lighting appliances. Since the initial cost of energy efficient fans and BLDC fans
are comparatively high, consumers tend to opt for products with lower initial cost. All these factors imply that the intervention strategies to overcome barriers to the adoption of energy efficient fans are to be different from those for lighting devices. Among fans, two types are to be treated in different ways as the costs of conserved energy of BLDC fans are high when compared to energy efficient fans.
1) LED Technology
There are several factors that act as barriers. Transaction cost of LED is high in comparison to that of Incandescent lamps. Variation in quality is very large among various models of LEDs available in the market, making it difficult for the consumer to find out which is the best option. There is no such issue with an incandescent lamp where the make, model or type do not grossly affect the quality of the device or its output. The cost of an incandescent lamp is more or less the same across the country and the consumers never have feeling of being cheated by one vendor through over pricing or fooled by one manufacturer through false promises. There are many technical specifications in the case of LED that a consumer cannot easily measure, such as the Power Factor, CRI, or the Total harmonic Distortion (THD). Eventhough the light measured in technical term such as “Lumens” is better for LED, the quality perceived by the consumer was not the same. Low CRI of LED lamps and the low spread (LED produces a more focused stream of light when compared to incandescent lamps) can give a feeling of discomfort to the usermaking it unfit in certain applications. Also, there are some reports published in the media on the ill effects of getting exposed to LED lights. LED manufacturers state that inorder to provide more information and create more awareness thay are bound to incur more cost and such transaction costs subsequently increase the product cost. Availability in abundance of low quality, low cost products in the market, without any strong regulatory measures to ensure quality, also creates market imperfection and inefficiency. A major factor cited by the traders regarding the low adoption of LEDs is the low initial cost of incandescent lamps. There exists a tendency of giving more importance to present value of money over the future prospects of saving, believe many.
2. Energy Efficient Fans
whenever the fan fails. Since, most of the lamps are not repairable and reusable and the replaement frequencies are higher than that of fans, customers pay more attention to the techncial and finacial aspects of light fixtures.As replacement of fans require the support of electricians,who generally promoterepair rather than replacement, rate of adoption of energy efficient fanis low.
3. Comon Factors
This study shows that choice of fans and lights are dominated by non-technical factors such as Brand, opinion of contractors and electricians. This is leading to imperfect optimization that arises because consumers have limited attention and cannot possibly focus on all of the information relevant for all of the decisions they are called upon to make. They might have limited computational capacity, which can lead them to apply simplified heuristics to complicated choice problems and opt for brand instead of efficiency and life cycle cost. Lack of proper information on the technology, lack of trust in the sources of information, false claims of non-standard manufacturers, inertia among consumers for retrofits due to endowment effect and lack of awareness are some of the barriers to adoption of energy efficient technologies. Since, Energy Efficient fans are not widely available in the market, especially those made by the reputed brands, the customer opts rewinding and repairs that do not promote energy efficiency.
V. CONCLUSION
Data analysis shows that Energy efficiency awareness has not gone beyond replacing Incandescent lamps with CFL and Fluorescent lamps in many houses. Installation of Energy Efficient fans such as 5-Star Fans and BLDC fans are almost zero. The knowledge-action-intention gap is one of the most important behaviour aspects to be addressed while devising policies and intervention strategies.
This study was effective in providing various insights on the choices of people and was also useful in confirming the theoretical and research findings that behaviour plays a major part in decision making and shall be an integral part of the policymaking. Enforcing efficiency standards for the branded equipment in the market through regulatory and supportive measures could be one of the important strategies that could be adopted by the government while formulating policies to enhance adoption of energy efficient equipment.
REFERENCES
[1] Boegle, A., Singh, D., & Sant, G. 2010. “Energy saving potential in Indian households from improved appliance efficiency”. Prayas Energy Group, Pune, India
[2] Frederiks, E. R., Stenner, K., & Hobman, E. V. 2015. “Household energy use: Applying behavioural economics to understand consumer decision-making and behaviour”, Renewable and Sustainable Energy Reviews, 41, pp1385-1394.
[3] Madrian, B. C. 2014. “Applying insights from behavioral economics to policy design”. Annu. Rev. Econ., 6(1), pp 663-688.
[4] Martiskainen, M. 2007. “Affecting consumer behaviour on energy demand”. Sussex: SPRU–Science and Technology Policy Research, p 81.
[5] Parikh, J. K., Reddy, B. S., Banerjee, R., & Koundinya, S. 1996. “DSM survey in India: awareness, barriers and implementability”. Energy, 21(10), pp955-966.
[6] Poznaka, L., Laicane, I., Blumberga, D., Blumberga, A., & Rosa, M. 2015. “Analysis of electricity user behavior: case study based on results from extended household survey”. Energy Procedia, 72,pp 79-86.
[7] KSEBL,2016, Annual Administration Report 2015-16, Kerala State Electricity Board, Limited, Trivandrum, Kerala, India pp 36-40 [8] Reddy, B. S. 2013. “Barriers and drivers to energy efficiency–A new
taxonomical approach”. Energy Conversion and Management, 74, pp403-416.
[9] Sathaye, J. A., Can, S. R., Kumar, S., Iyer, M., Galitsky, C., Phadke, A., & Padmanabhan, S. 2006. “Implementing end-use efficiency improvements in India: drawing from experience in the US and other countries”. Paper for the US–India energy efficiency conference, New Delhi, India (Vol. 2).
[10] Sorrell, S., Schleich, J., Scott, S., O’malley, E., Trace, F., Boede, U &Radgen, P. 2000. “Reducing barriers to energy efficiency in public and private organizations”. Science and Policy Technology Research (SPRU), University of Sussex, Sussex, UK.
[11] Stern, P. C. 2014. “Individual and household interactions with energy systems: toward integrated understanding”. Energy Research & Social Science, 1, pp41-48.
[12] Stern, P. C., Aronson, E., Darley, J. M., Kempton, W., Hill, D. H., Hirst, E., & Wilbanks, T. J. 1987. “Answering behavioral questions about energy efficiency in buildings”. Energy, 12(5),pp 339-353. [13] Thollander, P., Backlund, S., Trianni, A., & Cagno, E. 2013. “Beyond
barriers–A case study on driving forces for improved energy efficiency in the foundry industries in Finland”, France, Germany, Italy, Poland, Spain, and Sweden. Applied Energy, 111, pp636-643. [14] Thollander, P., Danestig, M., & Rohdin, P. (2007). “Energy policies