Dissociation in performance of children with ADHD and
high-functioning autism on a task of sustained attention
Katherine A. Johnson
a
,
b
,
∗
, Ian H. Robertson
a
, Simon P. Kelly
a
,
c
, Timothy J. Silk
d
,
e
,
f
,
Edwina Barry
b
, Aoife D´aibhis
a
, Amy Watchorn
a
, Michelle Keavey
a
, Michael Fitzgerald
b
,
Louise Gallagher
b
, Michael Gill
b
, Mark A. Bellgrove
a
,
g
aSchool of Psychology and Trinity College Institute of Neuroscience, Trinity College Dublin, Dublin 2, Ireland bSchool of Medicine and Health Sciences and Trinity College Institute of Neuroscience, Trinity College Dublin, Dublin 2, Ireland
cCognitive Neurophysiology Laboratory, Nathan S. Kline Institute, Orangeburg, NY 10962, United States dHoward Florey Institute and Centre for Neuroscience, University of Melbourne, Australia eAcademic Child Psychiatry Unit, Department of Pediatrics, University of Melbourne, Australia
fDepartment of Psychology, Monash University, Australia
gCognitive Neuroscience Laboratory, School of Psychology and Queensland Brain Institute, University of Queensland, Brisbane, Australia
Received 18 August 2006; received in revised form 13 February 2007; accepted 19 February 2007 Available online 4 March 2007
Abstract
Attention deficit hyperactivity disorder (ADHD) and autism are two neurodevelopmental disorders associated with prominent executive
dysfunc-tion, which may be underpinned by disruption within fronto-striatal and fronto-parietal circuits. We probed executive function in these disorders
using a sustained attention task with a validated brain-behaviour basis. Twenty-three children with ADHD, 21 children with high-functioning autism
(HFA) and 18 control children were tested on the Sustained Attention to Response Task (SART). In a fixed sequence version of the task, children
were required to withhold their response to a predictably occurring no-go target (3) in a 1–9 digit sequence; in the random version the sequence
was unpredictable. The ADHD group showed clear deficits in response inhibition and sustained attention, through higher errors of commission
and omission on both SART versions. The HFA group showed no sustained attention deficits, through a normal number of omission errors on both
SART versions. The HFA group showed dissociation in response inhibition performance, as indexed by commission errors. On the Fixed SART, a
normal number of errors was made, however when the stimuli were randomised, the HFA group made as many commission errors as the ADHD
group. Greater slow-frequency variability in response time and a slowing in mean response time by the ADHD group suggested impaired arousal
processes. The ADHD group showed greater fast-frequency variability in response time, indicative of impaired top-down control, relative to the
HFA and control groups. These data imply involvement of fronto-parietal attentional networks and sub-cortical arousal systems in the pathology
of ADHD and prefrontal cortex dysfunction in children with HFA.
© 2007 Elsevier Ltd. All rights reserved.
Keywords: Response time; Fast Fourier transform; Variability; Arousal; Response inhibition; Executive function
1. Introduction
Autism and attention deficit hyperactivity disorder (ADHD)
are two common, largely genetic, childhood-onset psychiatric
disorders affecting key fronto-striatal and fronto-parietal
cir-∗Corresponding author at: School of Psychology and Trinity College Institute of Neuroscience, Trinity College Dublin, Dublin 2, Ireland.
Tel.: +353 1 896 8403; fax: +353 1 671 2006.
E-mail address:[email protected](K.A. Johnson).
cuits that are important for executive function (
Courchesne &
Pierce, 2005
;
Filipek et al., 1997
;
Mostofsky, Cooper, Kates,
Denckla, & Kaufmann, 2002
;
Schmitz et al., 2006
). These two
disorders differ substantially in symptom presentation, but they
also share a number of important features (
Sturm, Fernell, &
Gillberg, 2004
). Despite the exclusion of one disorder in the
formal diagnosis of the other, there appears to be a degree
of comorbidity (or a sharing of symptoms) between the two
disorders (
Goldstein & Schwebach, 2004
;
Holtmann, B¨olte,
& Poustka, 2005
;
Stahlberg, Soderstrom, Rastam, & Gillberg,
2004
). Both disorders have a strong genetic component to their
aetiology, with heritability estimates of 0.9 for autism and 0.7
for ADHD (
Baron-Cohen & Belmonte, 2005
;
Faraone et al.,
2005
); indeed there is preliminary evidence of genetic linkage
in autism and ADHD at chromosomal locations 2q24 and 16p13
(
Fisher et al., 2002; International Molecular Genetic Study of
Autism Consortium, 2001
). Executive dysfunction is
associ-ated with both autism (
Geurts, Verte, Oosterlaan, Roeyers, &
Sergeant, 2004
) and ADHD (
Willcutt, Doyle, Nigg, Faraone,
& Pennington, 2005
). Some very specific aspects of executive
dysfunction have recently been proposed as endophenotypes in
genetic association studies in ADHD: one in particular is
vari-ability in response time (RT) on tasks that measure sustained
attention capabilities (
Castellanos & Tannock, 2002
;
Kuntsi
& Stevenson, 2001
). Increasingly, response time variability is
being seen as a legitimate marker of brain pathology,
particu-larly in the frontal areas (
Bellgrove, Hester, & Garavan, 2004
;
MacDonald, Nyberg, & B¨ackman, 2006
;
Stuss, Murphy, Binns,
& Alexander, 2003
). It would be extremely useful to know if
a candidate endophenotype is able to distinguish between two
neurodevelopmental disorders. Dissociating autism and ADHD
on a task of executive function may help to define
disorder-specific markers for use in genetic association studies. In this
context we sought to determine whether children with ADHD
and autism differed on archetypal executive functions, that of
sustained attention and response inhibition, and particularly if
variability in RT specifically differentiated these two groups.
Sustained attention is the endogenous ability to mindfully
and consciously process stimuli, whose non-arousing qualities
would otherwise lead to habituation and distraction (
Robertson,
Manly, Andrade, Baddeley, & Yiend, 1997
). The ability to
sus-tain attention to a task and produce an appropriate response
entails the functioning of the fronto-parietal circuit. The right
dorsolateral prefrontal cortex and the right inferior parietal
cortex are activated during sustained attention tasks (
Coull,
Frackowiak, & Frith, 1998
;
Coull, Frith, Frackowiak, & Grasby,
1996
;
Fassbender et al., 2004
;
O’Connor, Manly, Robertson,
Hevenor, & Levine, 2004
;
Pardo, Fox, & Raichle, 1991
). In
addition, the anterior cingulate, basal ganglia and thalamus are
likely to be involved in regulating and co-ordinating
appropri-ate responses during attentional tasks (
Bradshaw, 2001; Bush et
al., 1999; Coull et al., 1998
;
Konrad, Neufang, Hanisch, Fink,
& Herpertz-Dahlmann, 2006
). Finally, areas of the midbrain
involved in arousal, including the reticular formation and the
locus coeruleus, may sub-serve the ability to maintain attention
to a task over time (
Coull, 1998; Sturm et al., 1999
).
There is evidence of anatomical and physiological
dysfunc-tion in the fronto-parietal and fronto-striatal networks in ADHD.
Researchers have found bilateral reductions in prefrontal
vol-ume (
Castellanos et al., 2002; Filipek et al., 1997; Mostofsky
et al., 2002; Sowell et al., 2003
), reduced white matter in the
parietal–occipital regions (
Filipek et al., 1997
) and increased
grey matter in the inferior parietal cortices (
Sowell et al., 2003
).
Subcortically, there is reduced anatomical volume of the
cau-date nucleus, putamen and cerebellum (
Castellanos et al., 1994,
1996, 2002
). Functionally, the dorsal anterior cingulate has been
found to be hypoactive (
Bush et al., 1999; Durston et al., 2003;
Rubia et al., 1999
) and functioning of the fronto-striatal circuit
(
Schweitzer et al., 2003
) and prefrontal cortices are abnormal
(
Bush et al., 1999; Durston et al., 2003; Rubia et al., 1999
).
Dysfunction within the parietal lobe, particularly of the
right-hemisphere, has been noted in a number of recent reports (
Booth
et al., 2005; Silk et al., 2005
). Please refer to (
Bush, Valera, &
Seidman, 2005
) for a recent review.
There is also anatomical and physiological evidence of
fronto-striatal (
Abell et al., 1999
;
Carper & Courchesne, 2005
;
Courchesne et al., 2001; McAlonan et al., 2005; Silk et al.,
2006
;
Voelbel, Bates, Buckman, Pandina, & Hendren, 2006
) and
fronto-parietal dysfunction in autism (
Just, Cherkassky, Keller,
Kana, & Minshew, in press
;
Schmitz et al., 2006
).
Anatomi-cal research suggests that children with autism have abnormally
large frontal lobe volumes (
Carper & Courchesne, 2000, 2005
;
Courchesne et al., 2001; Schmitz et al., 2006
) that might reflect
a lack of synaptogenesis early in life (
Belmonte et al., 2004
).
There appears to be diminished grey matter in fronto-striatal
and parietal networks (
Courchesne et al., 2001
) although there is
some debate as to whether anatomical abnormalities exist in the
parietal lobes (
Abell et al., 1999
;
Courchesne, Press, &
Yeung-Courchesne, 1993
;
Koshino et al., 2005; McAlonan et al., 2002;
Schmitz et al., 2006
). Functionally, people with autism show
a decrease in regional cerebral blood flow (rCBF) in left
pre-frontal cortices (
Ohnishi et al., 2000
). During response inhibition
tasks, adults with autism show increased activation of the frontal
and parietal cortices, compared with controls, despite
show-ing normal behavioural performance on these tasks (
Schmitz
et al., 2006
). Greater left hemisphere activity in the inferior
and orbitofrontal cortices may indicate an alternative,
compen-satory mechanism in adult autism (
Schmitz et al., 2006
). The
recruitment of additional areas of the brain to aid in task
perfor-mance and to off-set the negative effects of a deficient network
has been illustrated in recent studies, including those
investigat-ing aged individuals (
Nielson, Langenecker, & Garavan, 2002
)
and first-degree relatives of patients with schizophrenia (
Yeap et
al., 2006
). Executive dysfunction in ADHD and autism may be
related to the compromised workings of the fronto-striatal and
fronto-parietal circuits.
Equivocal evidence exists for sustained attention deficits in
both ADHD and autism, although a greater amount of research
has been directed at elucidating sustained attention deficits in
ADHD, when compared with autism (e.g.
Bellgrove, Hawi, Gill,
& Robertson, 2006
;
Manly et al., 2001
). Some researchers have
argued that in order to show a deficit in sustained attention,
a time-on-task effect for the number of errors must be shown
(
van den Bergh et al., 2006
). In ADHD research, a number of
studies have failed to show time-on-task effects with children
with ADHD (
Stins et al., 2005
;
van der Meere, Wekking, &
Sergeant, 1991
), although other studies have demonstrated
sig-nificant deficits in performance over the duration of the task
(
Epstein et al., 2003; Heinrich et al., 2001; Johnson et al.,
2007
). Only a few studies have investigated sustained attention
in children with autism. Most studies have used the continuous
performance task (CPT) and reported intact sustained attention
in autism. Unfortunately, RT was not recorded in three studies
(
Buchsbaum et al., 1992
;
Garretson, Fein, & Waterhouse, 1990
;
median RT was analysed in one study (
Noterdaeme, Amorosa,
Mildenberger, Sitter, & Minow, 2001
) and two studies used
food or money as obvious (and thus attention-attracting) rewards
every time a correct hit was made by the child (
Garretson et al.,
1990
;
Pascualvaca, Fantie, Papageorgiou, & Mirsky, 1998
). One
recent study has directly compared the performance of children
with ADHD and HFA on the Integrated Visual and Auditory
(IVA) Continuous Performance Test (IVA), a test that combines
inattention and impulsivity in the visual and auditory domains
(
Corbett & Constantine, 2006
). Unfortunately, the dependent
variables for this task are a combination of re-weighted
depen-dent variables (
Corbett & Constantine, 2006
). Nevertheless,
this study found little difference in performance of the ADHD
and HFA groups except on a measure containing elements of
impulsivity, consistency of RT and sustained attention (VRCQ)
(
Corbett & Constantine, 2006
). It is difficult to determine which
element of the VRCQ was driving this difference in performance
between the two groups. Thus, the nature of sustained attention
deficits in autism remains to be fully determined. Error rates and
RT performance both have the capability of furthering our
under-standing of sustained attention deficits in children with ADHD,
with autism and in control children.
Recently we described a new procedure to analyse RT data
to dissociate variability in RT into temporal components of fast
(moment-to-moment) and slow variability using a Fast Fourier
Transform (FFT) (
Johnson et al., 2007
), based on the work of
Castellanos et al. (2005)
. The task employed was the Sustained
Attention to Response Task (SART), which requires
partici-pants to withhold a response to an infrequent target and respond
to all other stimuli (
Robertson et al., 1997
). This task differs
substantially from the traditional CPTs, in which participants
monitor a stream of stimuli for the occurrence of an infrequent
target, which by its very nature has an attention-arousing quality.
Instead, the SART tests the ability of the participant to inhibit
the automatised act of button pressing when the target appears.
Withholding
to a rare target, as opposed to
responding
to a rare
target in CPT tasks, shifts the automatic response set to the
non-targets. Successful withholding of the primed response places
greater demand on the sustained attention system in order to
interrupt the ongoing action (
Bellgrove, Hawi, Kirley, Gill, &
Robertson, 2005
;
Robertson et al., 1997
). In addition, the SART
provides an ample amount of time-series RT data for analysis
using the FFT. Different forms of variance can be measured
from the FFT spectrum, distinguishing distinct components of
RT variability: (1) gradual variability, which has a slow
tem-poral characteristic and (2) trial-to-trial variability, which has
a fast temporal characteristic. In contrast, variability measured
simply as standard deviation over a task run represents the
com-bined influence of these components but provides no indication
of relative contributions. Slow variability is thought to reflect
declining arousal over the course of the task, whereas fast
vari-ability may reflect fluctuations in top-down attentional control
(
Johnson et al., 2007
).
The SART activates the same right fronto-parietal
atten-tional network (
Fassbender et al., 2004; Manly et al., 2003
) that
appears dysfunctional in ADHD and autism (
Giedd, Blumenthal,
Molloy, & Castellanos, 2001
;
McAlonan et al., 2005; Silk et al.,
2005
). In this study we employed fixed- and random-sequence
versions of the SART. The Random SART has a greater response
inhibition loading than the Fixed SART, due to the random
stimuli presentation. The Fixed SART places a larger
endoge-nous demand upon the sustained attention system, due to the
predictability of the stimuli presentation. Errors of commission
(responding to the no-go stimuli) on the Fixed SART primarily
reflect lapses of sustained attention and to a lesser degree deficits
in response inhibition. Commission errors on the Random SART
reflect to a greater degree response inhibition deficits, in
addi-tion to lapses of sustained attenaddi-tion. Errors of omission (failure
to respond to the go-stimuli) in either SART reflect a break from
task engagement and thus are reflective of lapsing attention. The
current study therefore employed both the fixed and random
ver-sion of the SART to examine the dissociation between sustained
attention and response inhibition in children with ADHD, autism
and controls.
The central aim of this study was to assess the ability of
children with ADHD, with autism and normal healthy children
on these tasks, in order to examine if these groups differed on
aspects of sustained attention, response inhibition and response
time variability (fast and slow). Based on the previous
experi-mental literature, we hypothesised that the ADHD group would
make more errors of commission and omission and show greater
fast and slow variability in RT than the control group, on both
versions of the SART. Based on anatomical and physiological
evidence, we hypothesised that the HFA group, on both versions
of the SART, would make more errors of commission and
omis-sion and show greater fast and slow variability in RT than the
control group and in a similar manner as the ADHD group, but
that there may be some evidence of compensatory mechanisms
in the measures.
2. Method
2.1. Participants
Twenty three children with ADHD (3 females), 21 children with HFA (1 female) and 18 control children (3 females) participated in the study (seeTable 1). There was no significant difference between the mean ages or in IQ, as measured using four subtests (picture completion, vocabulary, information, block design) of the Weschler Intelligence Scale for Children (Weschler, 1992), between the three groups. The data of 15 of the children with ADHD and 5 controls had previously been published and these children were randomly chosen to match the children with HFA according to age and IQ (Johnson et al., 2007).
Exclusion criteria for participation in the study included known neurolog-ical conditions or pervasive developmental disorders (apart from the presently studied disorders for each group), serious head injuries and below average intel-ligence (below 70 on the WISC-III) (Weschler, 1992). Control children were also excluded if they had first degree relatives with ADHD or HFA. Handedness was measured using the Edinburgh Handedness Inventory (Oldfield, 1971).
The participants with ADHD and HFA were recruited as part of ongoing genetic studies (Gallagher, Hawi, Kearney, Fitzgerald, & Gill, 2004;Kirley et al., 2002). These participants were either referred by consultant psychiatrists or recruited through support groups.
Table 1
Information on the ADHD, HFA and Control children
Group ADHD HFA Control
Number 23 21 18
Age (mean, S.D.) 10.5 (2.4) 12.2 (2.4) 11.1 (1.9)
IQ (mean, S.D.) 98.7 (14.6) 97.3 (12.3) 107.7 (11.6)
Left-handers 4 2 0
Number of Conners’ Parental responses 23 21 18
Conners’ ADHD Index (mean, S.D.) 78.8 (6.2)*ˆ 65.5 (11.6)*# 45.0 (4.8)ˆ#
Conners’ Hyperactive Subscale (mean, S.D.) 84.5 (5.8)*ˆ 67.0 (13.6)*# 47.1 (7.7)ˆ#
Conners’ Restless/Impulsive Subscale (mean, S.D.) 76.9 (8.2)*ˆ 64.0 (11.4)*# 44.6 (4.8)ˆ#
Number of ASDI Parental responses 23 21 17
ASDI Total score (mean, S.D.) 0.87 (1.0)*ˆ 5.0 (0.9)*# 0.06 (0.2)ˆ*
No. included in Fixed SART FFAUS analysis 13 20 18
No. included in Random SART FFAUS analysis 16 19 18
No. included in Fixed & Random SART SFAUS analysis 17 20 18
ADHD: Attention deficit hyperactivity disorder; HFA: high-functioning autism; IQ: intelligence quotient; ASDI: Asperger Syndrome Diagnostic Interview; SART: Sustained Attention to Response Task; FFAUS: fast-frequency area under the spectra; SFAUS: slow-frequency area under the spectra;*significant difference between
ADHD and HFA;∧significant difference between ADHD and controls;#significant difference between HFA and controls; alpha level set at 0.05.
Short Version (CPRS-R:S) (Conners, 1997) and all had ADHD Index T-scores greater than 65 (mean 79, S.D. 6). In addition, parents completed the Asperger Syndrome (and high-functioning autism) Diagnostic Interview (ASDI) (Gillberg, Gillberg, R˚astram, & Wentz, 2001), either at the time of testing (for 16 children) or retrospectively (for 7 children) approximately 24 months post-testing. The mean of the whole ADHD group on the ASDI was 0.9 (S.D. 1.0). Fifty-six percent of the children with ADHD met diagnostic criteria for oppositional defiant disorder and 13% met diagnostic criteria for conduct disor-der. Any stimulant medication was withdrawn for at least 24 h prior to testing. Seventy-four percent of the children with ADHD were stimulant na¨ıve.
Diagnosis for the participants with HFA was confirmed by psychiatrists using the Autism Diagnostic Interview–Revised (ADI-R) (Lord, Rutter, & Le Couteur, 1994) and Autism Diagnostic Observation Schedule–Generic (ADOS-G) (Lord et al., 2000) criteria for autism/autism spectrum disorder. Exclusion criteria included known medical causes of autism, chromosomal abnormalities, or fragile X syndrome. Two participants were on psychotropic medications at the time of the study.1One participant refused to complete the WISC. All parents of the children with HFA completed the ASDI and the CPRS-R:S. For eleven children this was done in a retrospective fashion, approximately 24 months post-testing and for 10 children this was completed at the time of post-testing. The mean score on the ASDI of the children with HFA was 5.0 (S.D. 0.9). Twelve children (57%) with HFA scored greater than 65 on the ADHD Index (group mean 66, S.D. 12).
The control children were recruited from Dublin schools. Parents of control children completed the CPRS-R:S (Conners, 1997) at the time of testing and all had ADHD Index T-scores less than 60 (mean 45, S.D. 5). Seventeen parents also completed the ASDI, retrospectively, approximately 6 months post-testing (mean 0.1, S.D. 0.2). Consent was obtained from parents of all children and the experimental work was conducted under the approval of local ethical committees in accordance with the Declaration of Helsinki.
2.2. Apparatus and procedure
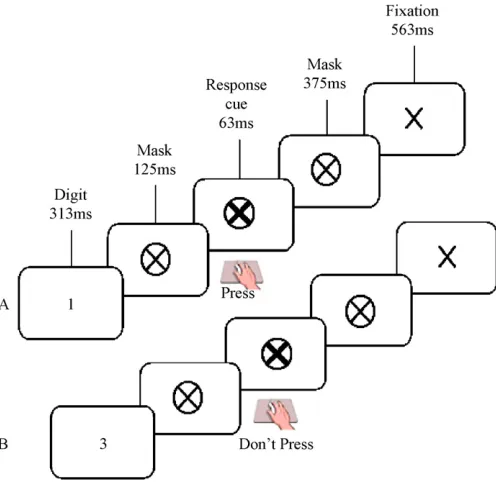
All participants performed the Fixed and Random versions of the Sustained Attention to Response Task, presented on a laptop computer (Robertson et al., 1997) (please seeFig. 1). In the Fixed version, a repeating fixed sequence of digits (1–9) was presented. In the Random version, the digits appeared in a pseudorandom order. For both versions, a single digit appeared on the screen for 313 ms; a mask was then presented for 125 ms, after which a response cue (a bold cross) appeared for 63 ms, followed by a second mask for 375 ms and a
fix-1 One child was taking 0.5 ml Risperidol per day. One child was taking 30 mg
Cipramil per day.
ation cross for 563 ms. The total inter-stimulus interval was 1439 ms (digit onset to digit onset). Participants were instructed to respond, using a button press, to every digit (go-trial) except ‘3’ (no-go trial). They were asked to respond when the response cue appeared on screen 125 ms after the digit was extinguished, or 438 ms from the start of the trial. The response cue was used to limit the impul-sive response style of the ADHD children and to reduce any speed/accuracy trade-offs (Bellgrove et al., 2005). For each of the Fixed and Random SARTs, participants performed 225 trials, representing 25 runs of the 1–9 sequence, last-ing approximately 5.5 min. The presentation of the Fixed and Random SARTs was counterbalanced across participants.
[image:4.595.313.561.416.657.2]2.3. Data analysis
For both the Fixed and Random SARTs, errors of commission (responses made on the no-go digit 3) and omission (non-responses on the go-trials) were calculated both for the entire trial (“full-run”) and for the first and second halves of the trial (“half-by-half”). The Mean and standard deviation (S.D.) of the RTs on the go-trials were calculated for the full-run and half-by-half analyses. The sequence of 225 RTs was also analysed using a fast Fourier transform (FFT), following the methodology ofJohnson et al. (2007). Grand average FFT spectra were also calculated per group for descriptive purposes.
Data preparation for FFTs: To calculate the FFTs, the RTs for the digit 3 and RTs of less than 100 ms were linearly interpolated from the immediately preced-ing and followpreced-ing RTs. For the fast-frequency area under the spectra (FFAUS), individual RT data were detrended, subtracting out any linear components, which were analysed separately.
[image:5.595.308.545.65.453.2]Derivation of FFT spectra: The RT data were analysed according to Welch’s averaged, modified periodogram method. The RT data were analysed both over the full-run (225 data points per individual) and in the half-by-half analysis. The full time-series was first divided into 7 segments of 75 data points, with an overlap of 50. Each segment was Hamming-windowed and zero-padded to length 450.2The FFT was then calculated for each segment. For the full-run analyses, the FFT for each segment was averaged across the 7 segments to provide a spectrum per individual. For the half-by-half analysis, the first three FFT segments were averaged in the first half and the last three seg-ments were averaged in the second half. All RT data points were represented in this analysis, due to the 50 data point overlap. Any segments of 75 data points where there were over 10 errors of omission (not necessarily occur-ring together) were excluded in the FFT. Subsequently, for both the full-run and half-by-half analyses, a small number of participants were excluded (see
Table 1).
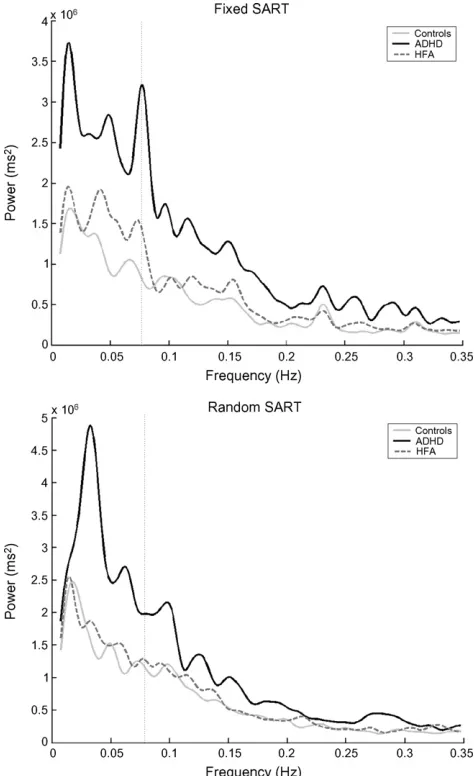
RT variance may be measured by calculating the area under the spectrum (AUS) over a broad band of interest. The AUS represents a measure of the ‘power’ or overall variance in the signal. The peak power at a particular point in the spectra measures consistency and distinctness of a particular RT pattern. Healthy adult control participants often show a slowing in RT on digit 1 relative to digits 9 and 2 in preparation for the upcoming no-go response on the Fixed SART (Dockree et al., 2004). If this average pattern is consistently reproduced on every 1–9 sequence, a peak in the spectra at 0.0772 Hz is found (reciprocal of 9 digits×1.439 second inter-stimulus interval) (see dotted line inFig. 2). This peak was used as a marker to divide the variability into two components. The fast-frequency area under the spectra encompassed all sources of variability faster than once per SART cycle (0.0772 Hz) (area under curve to the right of dotted line inFig. 2). Any trial-to-trial variability was captured in this calculation. The slow-frequency AUS (SFAUS) encompassed all sources of variability slower than once per SART cycle (area under curve to the left of dotted line inFig. 2). Any variability that occurred over any time period greater than one SART cycle was captured in this calculation. To ensure that all low frequencies were encompassed in the SFAUS, the time series was not divided into segments. Any RT time series where there were greater than 5 errors of omission in a row were excluded in the FFT (seeTable 1). The data were not detrended in the SFAUS analysis, as the linear components of the RT variation over the run were of analytical interest.
In a separate test, the linear component in isolation was analysed by fitting regression lines to the RTs of each participant using a first order polynomial fit (linear). The slope of the regression line was then calculated.
Statistics: All dependent variables were calculated per participant and aver-aged per group for the Fixed and Random SARTs. The number of errors of commission and omission, mean RT and S.D. of RT were analysed in a Group (ADHD versus HFA versus Control) by Half (first half of trial versus sec-ond half) by SART (Fixed versus Random) three-way mixed factorial ANOVA design. The FFAUS was analysed in a Group by Half two-way mixed facto-rial ANOVA design for the Fixed and Random SARTs separately, to ensure the largest number of participants in each analysis. This was due to the
exclu-2 Hamming-windowing and zero-padding are standard preliminary steps in
calculating FFTs and are explained in text books on time-series analyses, e.g. (Oppenheim, Schafer, & Buck, 1999).
Fig. 2. Grand average of the fast Fourier transform (FFT) of the mean response time (RT) data on the Fixed and Random versions of the Sustained Atten-tion to Response Task (SART) for the attenAtten-tion deficit hyperactivity disorder (ADHD), high-functioning autism (HFA) and control groups. TheY-axis rep-resents the power of periodic changes in RT data. TheX-axis represents the different temporal frequencies, in Hertz (Hz). The peak at 0.0772 Hz (reciprocal of 9 digits×1.439 second inter-stimulus interval and marked by the dotted line) in the Fixed version of the SART is the Principle SART peak, and represents a consistent and distinct pattern of RT performance, such as a slowing in RT in response to digit 1, relative to digit 9 and 2, in preparation for the no-go response on digit 3 (Johnson et al., 2007). This peak is not present in the Random version, due to the random presentation of stimuli. Grand average spectra were calcu-lated per group using the FFT function in MatLab 7.0 (The MathWorks, Natick, Massachusetts).
sion criteria of the FFAUS (see above). The SFAUS and slope of regression line were analysed in a Group by SART two-way mixed factorial ANOVA. The alpha level was set at 0.05 and Bonferroni adjustments were used throughout the analysis.
3. Results
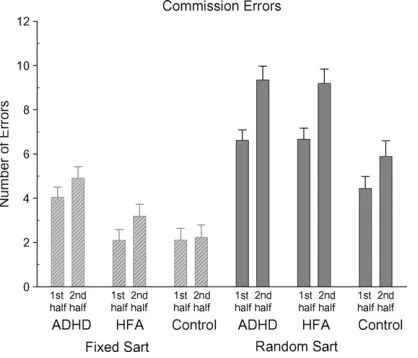
Fig. 3. Mean commission errors (with standard errors) for the Fixed and Random SARTs for each participant group for the first and second halves of the task.
groups also differed significantly (p
< 0.001). The HFA group
(mean 5.0, S.D. 0.9) scored significantly more highly on the
ASDI than the ADHD (mean 0.9, S.D. 1.0) (p
< 0.001) and
con-trol groups (mean 0.1, S.D. 0.2) (p
< 0.001), [F(2,58) = 197.0,
p
< 0.001]. The ADHD and control groups also differed
signifi-cantly (p
< 0.01). The higher than normal ratings of the ADHD
and HFA groups on the ASDI and Conners’ ADHD Index,
respectively, suggest that these groups may share some common
symptoms. The significantly greater scores of the two groups on
their respective symptom-rating scales nevertheless suggest that
the two groups are distinct.
3.1. Commission errors
[image:6.595.332.542.67.243.2]A significant Group and a significant SART version main
effect were further explained by a significant Group by SART
interaction, [F(2,59) = 5.39,
p
< 0.007] (see
Fig. 3
). On the Fixed
SART, the ADHD group (mean 9.2, S.D. 5.6) made
signifi-cantly more commission errors than the control (mean 4.4, S.D.
2.9) (p
< 0.002) or HFA groups (mean 5.3, S.D. 3.4) (p
< 0.011).
There was no significant difference between the HFA and
con-trol groups. On the Random SART, the HFA group (mean
16.3, S.D. 5.2) made as many commission errors as the ADHD
group (mean 16.8, S.D. 5.2). The control group (mean 10.5,
S.D. 3.6) made significantly less errors than either the ADHD
(p
< 0.01) or HFA (p
< 0.01) groups. The increase in
commis-sion errors in the Random SART by the HFA group was driving
this interaction. All groups made significantly more errors on
the Random SART compared with the Fixed SART. A
signif-icant Half main effect was further explained by a signifsignif-icant
Half by SART interaction, [F(1,59) = 15.76,
p
< 0.001]. More
commission errors were made in the second half of the Fixed
(mean 3.5, S.D. 2.6) and the Random SARTs (mean 8.3, S.D.
3.3) compared with the first half of the Fixed (mean 2.8, S.D.
2.4) and Random SARTs (mean 6.0, S.D. 2.5). More
commis-sion errors were made in the Random SART compared with
the Fixed SART during both the first and second halves of the
task.
Fig. 4. Mean omission errors (with standard errors) for the Fixed and Random SARTs for each participant group for the first and second halves of the task.
3.2. Omission errors
The ADHD group (mean 16.0, S.D. 11.0) (p
< 0.0001)
made significantly more omission errors than the HFA group
(mean 4.8, S.D. 6.5) (p
< 0.001) and the control group (mean
2.6, S.D. 2.4) across both the Fixed and Random SARTs
[F(2,59) = 15.679,
p
< 0.001] (see
Fig. 4
). The HFA and control
groups did not differ significantly. Across both SART versions,
more omission errors were made in the second half of the task
(mean 4.9, S.D. 6.7) compared with the first half (mean 4.0, S.D.
5.8), [F(1,59) = 4.56,
p
< 0.037]. The number of omission errors
did not vary between the Fixed and Random SARTs.
3.3. Mean RT
A significant Half main effect was further explained by a
sig-nificant Half by Group interaction, [F(2,59) = 3.516,
p
< 0.036]
(please see
Fig. 5
). The ADHD group (mean first half 463 ms,
S.D. 93; mean second half 492, S.D. 93) significantly slowed
in RT over the course of both the Fixed and Random SARTs.
The control (mean first half 484 ms, S.D. 95; mean second half
495, S.D. 99) and the HFA groups (mean first half 469 ms, S.D.
111; mean second half 464, S.D. 115) maintained a consistent
RT across both the SARTs. There was no difference in mean RT
between the three groups during either the first or second halves.
For all participants, the RT on the Random SART was slower
(mean 493 ms, S.D. 99) compared with the Fixed SART (mean
461, S.D. 101), [F(1,59) = 8.352,
p
< 0.005].
3.4. Linear regression of RT
Fig. 5. Mean response time (with standard errors) for the Fixed and Random SARTs for each participant group for the first and second halves of the task.
3.5. Standard deviation of RT
A significant Half main effect was further explained by a
sig-nificant Half by Group interaction, [F(2,59) = 5.25,
p
< 0.008].
The variability in RT of the ADHD group (mean S.D. first half
200, S.D. 74; mean S.D. second half 229, S.D. 74) significantly
increased over the course of both the Fixed and Random SARTs.
The control (mean S.D. first half 136 ms, S.D. 39; mean S.D.
sec-ond half 149, S.D. 37) and the HFA groups (mean S.D. first half
154, S.D. 58; mean S.D. second half 156, S.D. 59) maintained a
consistent S.D. of RT across both the Fixed and Random SARTs.
The ADHD group was significantly more variable in RT than the
control (p
< 0.001) and HFA (p
< 0.001) groups, for both the first
and the second halves of the task. There was no significant
dif-ference in S.D. of RT between the control and HFA groups. The
S.D. of RT did not vary between the Fixed and Random SARTs.
3.6. Slow-frequency area under the spectra
The average FFT spectrum for each group is shown in
Fig. 2
;
the SFAUS is the area under the curve to the left of the dotted
line. The SFAUS of the ADHD group (mean 831, S.D. 677) was
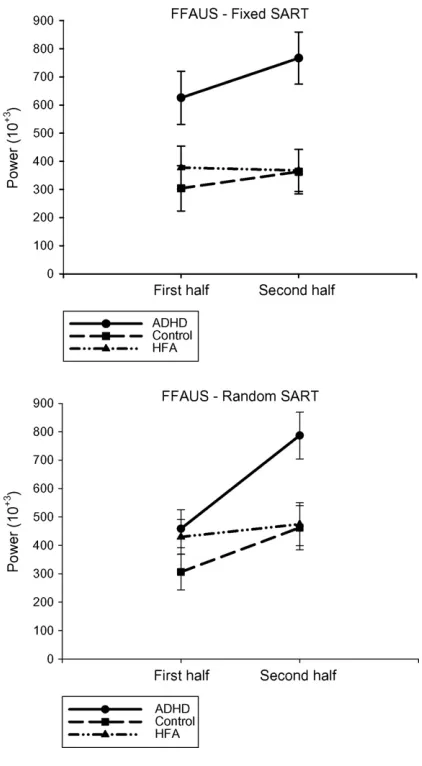
Fig. 6. Fast-frequency Area Under Spectra scores (with standard errors) for each participant group for the first and second halves of the Fixed and Random SARTs.
significantly greater than that of the HFA (mean 425, S.D. 335)
(p
< 0.011) and control groups (mean 378, S.D. 229) (p
< 0.007),
[F(2,52) = 6.352,
p
< 0.003]. The HFA and control groups did
not differ significantly. There was no significant effect of SART
version on the SFAUS.
3.7. Fast-frequency area under the spectra—fixed SART
The FFAUS is the area under the curve to the right of the
dotted line in
Fig. 2
. The ADHD group (mean 696,265; S.D.
544,577) was significantly more variable in terms of
moment-to-moment variability than the control group (mean 333,657; S.D.
167,110) (p
< 0.004) and the HFA group (mean 372,557; S.D.
263,678) (p
< 0.009), [F(2,48) = 6.753,
p
< 0.003] (see
Fig. 6
).
The control and HFA groups did not differ significantly. There
was no significant Half main effect or a significant interaction.
3.8. Fast-frequency area under the spectra—random SART
[image:7.595.322.533.64.447.2][F(2,50) = 3.932,
p
< 0.026] (please see
Fig. 6
). In the first half of
the Random SART, there was no difference between the ADHD
(mean 458,610; S.D. 223,597), control (mean 306,117; S.D.
151,668) or HFA (mean 429,702; S.D. 367,510) groups. In the
second half, the ADHD group (mean 768,721; S.D. 436,102)
was significantly more variable in the fast frequency domain
than either the control group (mean 462,119; S.D. 229,476)
(p
< 0.028) or the HFA group (mean 474,451; S.D. 305,024)
(p
< 0.034). The control and HFA groups did not differ
sig-nificantly. Both the ADHD (p
< 0.001) and control (p
< 0.022)
groups significantly increased the fast moment-to-moment
vari-ability in RT from the first to the second halves of the Random
SART, whereas the HFA group did not change.
4. Discussion
The lack of consensus in the literature as to whether children
with ADHD or autism have sustained attention and/or response
inhibition deficits may reflect differences in task characteristics.
By manipulating the predictability of stimulus presentations in
the current study, dissociation in error and RT performance was
noted between children with ADHD, HFA and controls. The
children with ADHD demonstrated clear deficits in response
inhibition and sustained attention, as measured by the
num-ber of commission and omission errors, the S.D. in RT and
the fast, moment-to-moment variability in RT. In addition, they
demonstrated waning performance over the course of the task,
suggestive of deficits in arousal levels. The children with HFA,
in contrast, performed normally on every measure of the SARTs
except for the large number of commission errors made on the
Random SART. This suggests that children with HFA have intact
sustained attention but deficient response inhibition. Since
sus-tained attention is known to be sub-served by fronto-parietal
networks of the right-hemisphere (
Coull et al., 1998, 1996; Pardo
et al., 1991
), as has been demonstrated specifically in imaging
studies using the present SART paradigm (
Fassbender et al.,
2004; O’Connor et al., 2004
), our behavioural data is suggestive
of greater dysfunction within these circuits in ADHD than in
autism.
The children with ADHD made a greater number of
commis-sion errors compared with the children with HFA and control
children on the Fixed SART, suggesting sustained attention
deficits. In contrast, the HFA group performed comparably with
controls, possibly by making use of the externally cued,
regu-lar and predictable pattern of the Fixed SART. It is suggested
that the children with HFA made special use of the regularly
recurring sequence of digits leading up to the no-go “3”, in a
systematic way, possibly by utilising compensatory cognitive
mechanisms.
Schmitz et al. (2006)
recently reported that adults
with autism demonstrated normal behavioural performance on
executive function tasks, but significantly increased brain
acti-vation in the frontal, insular and parietal brain regions. The
recruitment of additional areas of the brain to aid in task
per-formance may be occurring in this group of children with HFA,
possibly through the use of the external stimuli provided by the
Fixed SART.
With the unpredictable stimulus presentation of the Random
SART, the children with HFA made as many commission errors
as the ADHD group. Indeed, the similarity in the number of
commission errors made by the two groups was striking. The
nature of response inhibition deficits in participants with HFA
appears to be task-dependent. The children with HFA may be
demonstrating a response inhibition deficit when external cues
are unavailable for use, as the Random SART has a greater
response inhibition component, when compared with the Fixed
SART (
Fassbender et al., 2004
). Response inhibition deficits
have previously been shown in children with HFA, particularly
if the task tests prepotent inhibition, such as when an alternative
response is needed to the primed response. Examples include
the circle-drawing task (
Geurts et al., 2004
), the oculomotor
anti-saccade task (
Luna, Doll, Hegedus, Minshew, & Sweeney,
2007
), the oculomotor delayed-response task (
Minshew, Luna,
& Sweeney, 1999
) and the Go/No-Go task (
Ozonoff & McEvoy,
1994
). Children with HFA may not necessarily show deficits
in a non-primed response inhibition task, such as the Stroop
(
Goldberg et al., 2005
) and the visually guided saccade task
(
Minshew et al., 1999
). Response inhibition deficits are
sug-gestive of prefrontal and possibly parietal cortex dysfunction
(
Garavan, Ross, & Stein, 1999
).
The sustained attention deficit of the children with ADHD
was clearly shown by the high number of omission errors, made
both during the Fixed and Random SARTs. In contrast, the
chil-dren with HFA and the control chilchil-dren made a similar, lower
number of omission errors. All children showed an increase in
omission errors as the task progressed, suggesting that a
pro-gressive decline in performance is normal at this age.
The ADHD group showed a particular diminution in RT
performance over the course of both the Fixed and Random
SARTs, which was not shown by either the HFA or the
con-trol groups. The children with ADHD slowed in RT over the
two halves of the tasks, as demonstrated by the mean RT and
the linear regression analyses. The slow frequency variability in
RT was significantly higher for the ADHD group. In
compar-ison, the children with HFA and the control group maintained
a steady performance across the tasks. The ADHD group may
be affected by declining arousal. The SART runs for 5.5 min,
which is a considerably shorter period compared with
tradi-tional vigilance tasks in which subjects must sustain attention
for 15 (
Teichner, 1974
), 30 (
Mackworth, 1968
) or even 60 min
periods (
Paus et al., 1997
). Nevertheless it is noteworthy that
time-on-tasks effects are apparent even over this relatively short
task duration. These results imply that arousal deficits may be
one key driver of the ubiquitous findings of RT variability in
the ADHD literature. This interpretation is consistent with the
hypoarousal (
Satterfield, Cantwell, & Satterfield, 1974
) and the
Cognitive Energetic models of ADHD (
Sergeant, 2005
). EEG,
PET and rCBF studies have all provided evidence of cortical
hypoarousal in ADHD (e.g.
Lou, Henriksen, & Bruhn, 1984
;
A number of recent genetic studies have shown associations
between ADHD and allelic variation in genes controlling
neuro-transmitter systems that regulate arousal, such as noradrenaline
(
Madras, Miller, & Fischman, 2005
), serotonin (
Sheehan et al.,
2005
) and corticotrophin (
Winsky-Sommerer, Boutrel, & de
Lecea, 2005
). Whether slow variability indexes arousal levels
and is able to index genetic susceptibility in ADHD will be an
important question for future research to address.
The ADHD group performed the Fixed and Random SARTs
with greater fast-frequency (moment-to-moment) variability in
RT and S.D. of RT than the children with HFA and the
con-trol children. The children with HFA and the concon-trol children
performed the two SARTs with a similar amount of
variabil-ity. Interestingly, the children with ADHD and control children
showed greater fast-frequency variability in the second half of
the Random SART compared with the first half, suggesting a
time-on-task effect during this more difficult task. The HFA
group, in both the Fixed and Random SARTs, appeared to have
the capacity to maintain consistent fast-frequency variability
in RT over the course of the task. Fast-frequency variation in
RT likely reflects lapses in top-down attentional control that
occur over relatively short time frames, up to the period of
one SART cycle (13 s). There are suggestions that the areas
of the fronto-parietal circuit are refreshed over time-spans of
between 10 and 40 s (
Parasuraman, Warm, & See, 1998
;
Pardo
et al., 1991; Whitehead, 1991
). The ADHD group’s greater
fast-frequency variability suggests fluctuating top-down attentional
control, which in a harder task is also subject to time-on-task
effects. Deficits in sustained attention in ADHD may reflect
dysfunction of this executive control system (
Silk et al., 2005;
Sowell et al., 2003
). The children with HFA did not demonstrate
this greater fluctuation in fast-frequency variability, suggesting
that they do not have deficits in top-down attentional control.
The ability to sustain attention to a routine task is an important
aspect of executive control. There may be at least two different
processes involved in the behavioural manifestation of deficient
sustained attention: a gradual deterioration in attention to a task
and a fast phasic variation in top-down attentional control. An
incremental worsening in attention to a task, as reflected by
slow-frequency variability in RT (SFAUS), may be linked to a deficit
in brain arousal levels, related to the functioning of sub-cortical
structures (locus coeruleus, pulvinar, the basal forebrain,
thala-mus, brain stem reticular formation), the anterior cingulate and
neurotransmitter dysfunction (noradrenergic, cholinergic and
serotonergic) (
Biederman & Spencer, 1999
;
Moruzzi & Magoun,
1949
;
Paus, 2001; Paus et al., 1997
). These systems might be
more dysfunctional in ADHD than in HFA, especially if the task
is endogenously taxing. Top-down attentional control may also
wax and wane throughout the course of a task in a phasic
fash-ion, affecting the ability to maintain concentration on a task.
Sustained attention is thought to reflect the activity of the
right-lateralised fronto-parietal attentional networks (
Manly et al.,
2003
), which may be affected in ADHD to a far greater degree
than in HFA. There may be a multisecond oscillatory cycle of
sustained attention that is linked to physiological processes such
as basal ganglia neuronal activity and cerebral hemodynamic
response (
Castellanos et al., 2005
). Future research will need to
determine the neural substrates of these two distinct processes
and their functioning in ADHD and HFA and control children.
In addition, it would be interesting to investigate how these two
proposed processes vary in the sub-groups of ADHD, to enable
a greater understanding of the heterogeneity of this disorder.
The clear distinction in performance between the children
with ADHD and HFA on the Fixed and Random SARTs
sug-gests that sustained attention may not be a deficit shared by the
two disorders. Response inhibition may be a shared feature of
the two disorders, especially in tasks when external cues that
provide some structure are unavailable for children with HFA.
These clear findings highlight the potential usefulness of
CPT-like tasks in the assessment and conceptualisation of children
with psychiatric disorders. The response inhibition, sustained
attention and arousal deficits of children with ADHD should be
addressed when designing cognitive behavioural therapies. The
usefulness of external cues in providing a structure for cognition
in children with HFA has been highlighted in this comparison
of performance on the Fixed and Random SARTs.
dysfunction in ADHD than in HFA. This behavioural deficit
in ADHD may be underpinned by greater dysfunction within
fronto-parietal areas and the subcortical arousal system.
Acknowledgements
The work herein was supported by grants from the Health
Research Board of Ireland, Science Foundation Ireland, the
Irish Higher Education Authority’s Programme for Research
in Third-Level Institutions, The Wellcome Trust International
Biomedical Research Collaboration scheme and the National
Alliance for Autism Research (LG). K.A.J. is supported by
the Health Research Board of Ireland. M.A.B. is supported by
an Australian National Health and Medical Research Council
Howard Florey Centenary Fellowship. The authors would like
to thank all the children and parents who took part in the study.
References
Abell, F., Krams, M., Ashburner, J., Passingham, R., Friston, K., Frackowiak, R., et al. (1999). The neuroanatomy of autism: A voxel-based whole brain analysis of structural scans.Neuroreport,10(8), 1647–1651.
American Psychiatric Association. (1995).Diagnostic and statistical manual of mental disorders(4th ed.). Washington, DC: American Psychiatric Associ-ation.
Angold, A., Predergast, M., Cox, A., Harrington, R., Simonoff, E., & Rut-ter, M. (1995). The Child and Adolescent Psychiatric Assessment (CAPA).
Psychological Medicine,25, 739–753.
Baron-Cohen, S., & Belmonte, M. K. (2005). Autism: A window onto the devel-opment of the social and the analytic brain.Annual Review of Neuroscience,
28, 109–126.
Bellgrove, M. A., Hawi, Z., Gill, M., & Robertson, I. H. (2006). The cogni-tive genetics of attention deficit hyperactivity disorder (ADHD): Sustained attention as a candidate phenotype.Cortex,42(6), 838–845.
Bellgrove, M. A., Hawi, Z., Kirley, A., Gill, M., & Robertson, I. H. (2005). Dissecting the attention deficit hyperactivity disorder (ADHD) phenotype: Sustained attention, response variability and spatial attentional asymmetries in relation to dopamine transporter (DAT1) genotype.Neuropsychologia,
43(13), 1847–1982.
Bellgrove, M. A., Hester, R., & Garavan, H. (2004). The functional neuroanatom-ical correlates of response variability: Evidence from a response inhibition task.Neuropsychologia,42(14), 1910–1916.
Belmonte, M. K., Cook, E. H. J., Anderson, G. M., Rubenstein, J. L., Gree-nough, W. T., Beckel-Mitchener, A., et al. (2004). Autism as a disorder of neural information processing: Directions for research and targets for therapy.Molecular Psychiatry,9(7), 646–663.
Biederman, J., & Spencer, T. (1999). Attention-deficit/hyperactivity disor-der (ADHD) as a noradrenergic disordisor-der. Biological Psychiatry, 46(9), 1234–1242.
Booth, R., Burman, D. D., Meyer, J. R., Lei, Z., Trommer, B. L., Davenport, N. D., et al. (2005). Larger deficits in brain networks for response inhibition than for visual selective attention in attention deficit hyperactivity disorder (ADHD).Journal of Child Psychology and Psychiatry,46(1), 94–111. Bradshaw, J. L. (2001).Developmental disorders of the frontostriatal system:
Neuropsychological, neuropsychiatric and evolutionary perspectives. Hove, East Sussex: Psychology Press Ltd.
Buchsbaum, M. S., Siegel, B. V., Jr., Wu, J. C., Hazlett, E., Sicotte, N., Haier, R., et al. (1992). Brief report: Attention performance in Autism and regional brain metabolic rate assessed by positron emission tomography.Journal of Autism & Developmental Disorders,22(1), 115–125.
Bush, G., Frazier, J. A., Rauch, S. L., Seidman, L. J., Whalen, P. J., Jenike, M. A., et al. (1999). Anterior cingulate cortex dysfunction in attention-deficit/hyperactivity disorder revealed by fMRI and the Counting Stroop.
Biological Psychiatry,45(12), 1542–1552.
Bush, G., Valera, E. M., & Seidman, L. J. (2005). Functional neuroimaging of Attention-Deficit/Hyperactivity Disorder: A review and suggested future directions.Biological Psychiatry,57, 1273–1284.
Carper, R. A., & Courchesne, E. (2000). Inverse correlation between frontal lobe and cerebellum sizes in children with autism.Brain,123(Pt 4), 836–844. Carper, R. A., & Courchesne, E. (2005). Localized enlargement of the frontal
cortex in early autism.Biological Psychiatry,15(57), 126–133.
Castellanos, F. X., Giedd, J. N., Eckburg, P., Marsh, W. L., Vaituzis, A. C., Kaysen, D., et al. (1994). Quantitative morphology of the caudate nucleus in attention deficit hyperactivity disorder.American Journal of Psychiatry,
151(12), 1791–1796.
Castellanos, F. X., Giedd, J. N., Marsh, W. L., Hamburger, S. D., Vaituzis, A. C., Dickstein, D. P., et al. (1996). Quantitative brain magnetic resonance imaging in attention-deficit hyperactivity disorder.Archives of General Psychiatry,
53(7), 607–616.
Castellanos, F. X., Lee, P. P., Sharp, W., Jeffries, N. O., Greenstein, D. K., Clasen, L. S., et al. (2002). Developmental trajectories of brain volume abnor-malities in children and adolescents with Attention-Deficit/Hyperactivity Disorder.Journal of the American Medical Association,288(14), 1740– 1748.
Castellanos, F. X., Sonuga-Barke, E. J., Scheres, A., Di Martino, A., Hyde, C., & Walters, J. R. (2005). Varieties of Attention-Deficit/Hyperactivity Disorder-related intra-individual variability.Biological Psychiatry,57(11), 1416–1423.
Castellanos, F. X., & Tannock, R. (2002). Neuroscience of attention-deficit/hyperactivity disorder: The search for endophenotypes. Nature Reviews Neuroscience,3(8), 617–628.
Conners, C. K. (1997).Conners’ rating scales—revised: Technical manual. New York: Multi-Health Systems Inc.
Corbett, B. A., & Constantine, L. J. (2006). Autism and Attention Deficit Hyperactivity Disorder: Assessing attention and response control with the integrated visual and auditory continuous performance test.Child Neuropsy-chology,12, 335–348.
Coull, J. T. (1998). Neural correlates of attention and arousal: Insights from elec-trophysiology, functional neuroimaging and psychopharmacology.Progress in Neurobiology,55, 343–361.
Coull, J. T., Frackowiak, R. S. J., & Frith, C. D. (1998). Monitoring for target objects: Activation of right frontal and parietal cortices with increasing time on task.Neuropsychologia,36(12), 1325–1334.
Coull, J. T., Frith, C. D., Frackowiak, R. S. J., & Grasby, P. M. (1996). A fronto-parietal network for rapid visual information-processing: A PET study of sustained attention and working memory.Neuropsychologia,34, 1085–1095.
Courchesne, E., Karns, C. M., Davis, H. R., Ziccardi, R., Carper, R. A., Tigue, Z. D., et al. (2001). Unusual brain growth patterns in early life in patients with autistic disorder: An MRI study.Neurology,57(2), 245–254. Courchesne, E., & Pierce, K. (2005). Why the frontal cortex in autism might be
talking only to itself: Local over-connectivity but long-distance disconnec-tion.Current Opinion in Neurobiology,15, 225–230.
Courchesne, E., Press, G. A., & Yeung-Courchesne, R. (1993). Parietal lobe abnormalities detected with MR in patients with infantile autism.American Journal of Roentgenology,160, 387–393.
Dockree, P. M., Kelly, S. P., Roche, R. A. P., Hogan, M. J., Reilly, R. B., & Robertson, I. H. (2004). Behavioural and physiological impairments of sus-tained attention after traumatic brain injury.Cognitive Brain Research,20(3), 403–414.
Durston, S., Tottenham, N. T., Thomas, K. M., Davidson, M. C., Eigsti, I. M., Yang, Y., et al. (2003). Differential patterns of striatal activation in young children with and without ADHD.Biological Psychiatry,53(10), 871–878. Epstein, J. N., Erkanli, A., Conners, C. K., Klaric, J., Costello, J. E., & Angold, A. (2003). Relations between Continuous Performance Test performance measures and ADHD behaviours.Journal of Abnormal Child Psychology,
31(5), 543–554.
Faraone, S. V., Perlis, R. H., Doyle, A. E., Smoller, J. W., Goralnick, J. J., Holmgren, M. A., et al. (2005). Molecular genetics of Attention-Deficit/Hyperactivity Disorder.Biological Psychiatry,57, 1313–1323. Fassbender, C., Murphy, K., Foxe, J. J., Wylie, G. R., Javitt, D. C., Robertson,
interac-tions revealed by functional Magnetic Resonance Imaging.Cognitive Brain Research,20(2), 132–143.
Filipek, P. A., Semrud-Clikeman, M., Steingard, R. J., Renshaw, P. F., Kennedy, D. N., & Biederman, J. (1997). Volumetric MRI analysis comparing sub-jects having attention-deficit hyperactivity disorder with normal controls.
Neurology,48(3), 589–601.
Fisher, S. E., Francks, C., McCracken, J. T., McGough, J. J., Marlow, A. J., MacPhie, I. L., et al. (2002). A genomewide scan for loci involved in attention-deficit/hyperactivity disorder.American Journal of Human Genet-ics,70(5), 1183–1196.
Gallagher, L., Hawi, Z., Kearney, G., Fitzgerald, M., & Gill, M. (2004). No asso-ciation between allelic variants of HOXA1/HOXAB1 and autism.American Journal of Medical Genetics Part B: Neuropsychiatric Genetics,124(1), 64–67.
Garavan, H., Ross, T. J., & Stein, E. A. (1999). Right hemisphere dominance for inhibitory control: An event-related functional MRI study.Proceedings of the National Academy of Sciences, USA,96(14), 8301–8306.
Garretson, H. B., Fein, D., & Waterhouse, L. (1990). Sustained attention in chil-dren with autism.Journal of Autism and Developmental Disorders,20(1), 101–114.
Geurts, H. M., Verte, S., Oosterlaan, J., Roeyers, H., & Sergeant, J. A. (2004). How specific are executive functioning deficits in attention deficit hyper-activity disorder and autism?Journal of Child Psychology and Psychiatry,
45(4), 836–854.
Giedd, J. N., Blumenthal, J., Molloy, E., & Castellanos, F. X. (2001). Brain imaging of attention deficit/hyperactivity disorder.Annals of the New York Academy of Sciences,931, 33–49.
Gillberg, C., Gillberg, C., R˚astram, M., & Wentz, E. (2001). The Asperger Syndrome (and high-funtioning autism) Diagnostic Interview (ASDI): A preliminary study of a new structured clinical interview. Autism, 5(1), 57–66.
Goldberg, M. C., Mostofsky, S. H., Cutting, L. E., Mahone, E. M., Astor, B. C., Denckla, M. B., et al. (2005). Subtle executive impairment in children with Autism and children with ADHD.Journal of Autism & Developmental Disorders,35(3), 279–293.
Goldstein, S., & Schwebach, A. J. (2004). The comorbidity of pervasive devel-opmental disorder and Attention Deficit Hyperactivity Disorder: Results of a retrospective chart review.Journal of Autism & Developmental Disorders,
34(3), 329–339.
Heinrich, H., Moll, G. H., Dickhaus, H., Kolev, V., Yordanova, J., & Rothen-berger, A. (2001). Time-on-task analysis using wavelet networks in an event-related potential study on attention-deficit hyperactivity disorder. Clin-ical Neurophysiology,112(7), 1280–1287.
Holtmann, M., B¨olte, S., & Poustka, F. (2005). ADHD, Asperger syndrome, and high-functioning Autism.Journal of the American Academy of Child and Adolescent Psychiatry,44(11), 1101.
International Molecular Genetic Study of Autism Consortium. (2001). A genomewide screen for autism: Strong evidence for linkage to chromo-somes 2q, 7q, and 16p.American Journal of Human Genetics,69, 570– 581.
Johnson, K. A., Kelly, S. P., Bellgrove, M. A., Barry, E., Cox, E., Gill, M., et al. (2007). Response variability in Attention Deficit Hyperactivity Disorder: Evidence for neuropsychological heterogeneity.Neuropsychologia,45(4), 630–638.
Just, M. A., Cherkassky, V. L., Keller, T. A., Kana, R. K., & Minshew, N. J. (in press). Functional and anatomical cortical underconnectivity in autism: Evidence from an fMRI study of an executive function task and corpus callosum morphometry.Cerebral Cortex.
Kirley, A., Hawi, Z., Daly, G., McCarron, M., Mullins, C., Millar, N., et al. (2002). Dopaminergic system genes in ADHD: Toward a biological hypoth-esis.Neuropsychopharmacology,27(4), 607–619.
Konrad, K., Neufang, S., Hanisch, C., Fink, G. R., & Herpertz-Dahlmann, B. (2006). Dysfunctional attentional networks in children with Attention Deficit/Hyperactivity Disorder: Evidence from an event-related functional magnetic resonance imaging study.Biological Psychiatry,59(7), 643–651. Koshino, H., Carpenter, P. A., Minshew, N. J., Cherkassky, V. L., Keller, T. A., & Just, M. A. (2005). Functional connectivity in an fMRI working memory task in high-functioning autism.NeuroImage,24, 810–821.
Kuntsi, J., & Stevenson, J. (2001). Psychological mechanisms in hyperactivity: II. The role of genetic factors.Journal of Child Psychology and Psychiatry,
42(2), 211–219.
Lazzaro, I., Gordon, E., Li, W., Lim, C. L., Plahn, M., Whitmont, S., et al. (1999). Simultaneous EEG and EDA measures in adolescent attention deficit hyperactivity disorder. International Journal of Psychophysiology, 34, 123–134.
Lord, C., Risi, S., Lambrecht, L., Cook, E. H., Jr., Leventhal, B. L., DiLavore, P. C., et al. (2000). The autism diagnostic observation schedule-generic: A standard measure of social and communication deficits associated with the spectrum of autism.Journal of Autism & Developmental Disorders,30(3), 205–223.
Lord, C., Rutter, M., & Le Couteur, A. (1994). Autism Diagnostic Interview-Revised: A revised version of a diagnostic interview for caregivers of individuals with possible pervasive developmental disorders.Journal of Autism & Developmental Disorders,24(5), 659–685.
Lou, H. C., Henriksen, L., & Bruhn, P. (1984). Focal cerebral hypoperfusion in children with dysphasia and/or attention deficit disorder.Archives of Neurology,41, 825–829.
Lou, H. C., Henriksen, L., Bruhn, P., Borner, H., & Neilsen, J. B. (1989). Stri-atal dysfunction in attention deficit and hyperkinetic disorder.Archives of Neurology,46, 48–52.
Luna, B., Doll, S. K., Hegedus, S. J., Minshew, N. J., & Sweeney, J. A. (2007). Maturation of executive function in autism.Biological Psychiatry,61(4), 474–481.
MacDonald, S. W. S., Nyberg, L., & B¨ackman, L. (2006). Intra-individual vari-ability in behaviour: Links to brain structure, neurotransmission and neuronal activity.Trends in Neurosciences,29(8), 474–480.
Mackworth, F. J. (1968). Vigilance, arousal and habituation.Psychological Review,75, 308–322.
Madras, B. K., Miller, G. M., & Fischman, A. J. (2005). The dopamine trans-porter and attention-deficit/hyperactivity disorder.Biological Psychiatry,
57(11), 1397–1409.
Manly, T., Anderson, V., Nimmo-Smith, I., Turner, A., Watson, P., & Robert-son, I. H. (2001). The Differential Assessment of Children’s Attention: The Test of Everyday Attention for Children (TEA-Ch), normative sample and ADHD performance.Journal of Child Psychology and Psychiatry,42(8), 1065–1081.
Manly, T., Owen, A. M., McAvenue, L., Datta, A., Lewis, G. H., Scott, S. K., et al. (2003). Enhancing the sensitivity of a sustained attention task to frontal damage: Convergent clinical and functional imaging evidence.Neurocase,
9(4), 340–349.
McAlonan, G. M., Cheung, V., Cheung, C., Suckling, J., Lam, G. Y., Tai, K. S., et al. (2005). Mapping the brain in autism. A voxel-based MRI study of volumetric differences and intercorrelations in autism.Brain,128, 268–276.
McAlonan, G. M., Daly, E., Kumari, V., Critchley, H. D., van Amelsvoort, T., Suckling, J., et al. (2002). Brain anatomy and sensorimotor gating in Asperger’s syndrome.Brain,125(Pt 7), 1594–1606.
Minshew, N. J., Luna, B., & Sweeney, J. A. (1999). Oculomotor evidence for neocortical systems but not cerebellar dysfunction in autism.Neurology,52, 917–922.
Moruzzi, G., & Magoun, H. W. (1949). Brain stem reticular formation and acti-vation of the EEG.Electroencephalography and Clinical Neurophysiology,
1, 455–473.
Mostofsky, S. H., Cooper, K. L., Kates, W. R., Denckla, M. B., & Kaufmann, W. E. (2002). Smaller prefrontal and premotor volumes in boys with attention-deficit/hyperactivity disorder.Biological Psychiatry,52(8), 785–794. Nielson, K. A., Langenecker, S. A., & Garavan, H. (2002). Differences in the
functional neuroanatomy of inhibitory control across the adult life span.
Psychology and Aging,17(1), 56–71.
Noterdaeme, M., Amorosa, H., Mildenberger, K., Sitter, S., & Minow, F. (2001). Evaluation of attention problems in children with autism and children with a specific language disorder.European Child & Adolescent Psychiatry,10(1), 58–66.
Ohnishi, T., Matsuda, H., Hashimoto, T., Kunihiro, T., Nishikawa, M., Uema, T., et al. (2000). Abnormal regional cerebral blood flow in childhood autism.
Brain,123(9), 1838–1844.
Oldfield, R. C. (1971). The assessment and analysis of handedness: The Edin-burgh inventory.Neuropsychologia,9(1), 97–113.
Oppenheim, A. V., Schafer, R. W., & Buck, J. R. (1999).Discrete-time signal processing(2nd ed.). New Jersey: Prentice Hall.
Ozonoff, S., & McEvoy, R. E. (1994). A longitudinal study of executive function and theory of mind development in autism.Developmental Psychopathology,
6, 415–431.
Parasuraman, R., Warm, J. S., & See, J. E. (1998). Brain systems of vigilance. In R. Parasuraman (Ed.),The attentive brain. London: The MIT Press. Pardo, J. V., Fox, P. T., & Raichle, M. E. (1991). Localisation of a Human
System for Sustained Attention by Positron Emission Tomography.Nature,
349, 61–64.
Pascualvaca, D. M., Fantie, B. D., Papageorgiou, M., & Mirsky, A. F. (1998). Attentional capacities in children with Autism: Is there a general deficit in shifting focus?Journal of Autism & Developmental Disorders,28(6), 467–478.
Paus, T. (2001). Primate anterior cingulate cortex: Where motor control, drive and cognition interface.Nature Reviews Neuroscience,2(June), 417–424. Paus, T., Zatorre, R. J., Hofle, N., Caramanos, Z., Gotman, J., Petrides, M., et
al. (1997). Time-related changes in neural systems underlying attention and arousal during the performance of an auditory vigilance task.Journal of Cognitive Neuroscience,9(3), 392–408.
Robertson, I. H., Manly, T., Andrade, J., Baddeley, B. T., & Yiend, J. (1997). ‘Oops!’: Performance correlates of everyday attentional failures in traumatic brain injured and normal subjects.Neuropsychologia,35(6), 747–758. Rubia, K., Overmeyer, S., Taylor, E., Brammer, M., Williams, S. C., Simmons,
A., et al. (1999). Hypofrontality in attention deficit hyperactivity disorder during higher-order motor control: A study with functional MRI.American Journal of Psychiatry,156(6), 891–896.
Satterfield, J. H., Cantwell, D., & Satterfield, B. T. (1974). Pathophysiology of the hyperactive child syndrome. Archives of General Psychiatry, 31, 839–844.
Schmitz, N., Rubia, K., Daly, E., Smith, A., Williams, S., & Murphy, D. G. (2006). Neural correlates of executive function in Autistic Spectrum Disor-ders.Biological Psychiatry,59, 7–16.
Schweitzer, J. B., Lee, D. O., Hanford, R. B., Tagamets, M. A., Hoffman, J. M., Grafton, S. T., et al. (2003). A positron emission tomography study of methylphenidate in adults with ADHD: Alterations in resting blood flow and predicting treatment response.Neuropsychopharmacology,28, 967–973. Sergeant, J. (2005). Modeling attention-deficit/hyperactivity disorder: A critical
appraisal of the cognitive-energetic model.Biological Psychiatry,57(11), 1248–1255.
Sheehan, K., Lowe, N., Kirley, A., Mullins, C., Fitzgerald, M., Gill, M., et al. (2005). Tryptophan Hydroxylase 2 (TPH2) gene variants associated with ADHD.Molecular Psychiatry,10(10), 944–949.
Siegel, B. V., Jr., Nuechterlein, K. H., Abel, L., Wu, J. C., & Buchsbaum, M. S. (1995). Glucose metabolic correlates of continuous performance test per-formance in adults with a history of infantile autism, schizophrenics, and controls.Schizophrenia Research,17(1), 85–94.
Silk, T., Vance, A., Rinehart, N. J., Egan, G. F., O’Boyle, M., Bradshaw, J. L., et al. (2005). Fronto-parietal activation in attention-deficit hyperactivity
disorder, combined type: Functional magnetic resonance imaging study.The British Journal of Psychiatry,187, 282–283.
Silk, T. J., Rinehart, N. J., Bradshaw, J. L., Tonge, B. J., Egan, G. F., O’Boyle, M. W., et al. (2006). Visuospatial processing and the function of prefrontal-parietal networks in Autism Spectrum Disorder: A functional MRI study.
American Journal of Psychiatry,163(8), 1440–1443.
Sowell, E. R., Thompson, P. M., Welcome, S. E., Henkenius, A. L., Toga, A. W., & Peterson, B. S. (2003). Cortical abnormalities in children and adoles-cents with attention-deficit hyperactivity disorder.The Lancet,362(9397), 1699–1707.
Stahlberg, O., Soderstrom, H., Rastam, M., & Gillberg, C. (2004). Bipolar disorder, schizophrenia and other psychotic disorders in adults with child-hood onset AD/HD and/or autism spectrum disorders.Journal of Neural Transmission,111, 891–902.
Stins, J. F., Tollenaar, M. S., Slaats-Willemse, D. I. E., Buitelaar, J. K., Swaab-Barneveld, H., Verhulst, F. C., et al. (2005). Sustained attention and executive functioning performance in Attention-Deficit/Hyperactivity Disorder.Child Neuropsychology,11, 285–294.
Sturm, H., Fernell, E., & Gillberg, C. (2004). Autism spectrum disorders in chil-dren with normal intellectual levels: Associated impairments and subgroups.
Developmental Medicine & Child Neurology,46(7), 444–447.
Sturm, W., de Simone, A., Krause, B. J., Specht, K., Hesselmann, V., Raderma-cher, I., et al. (1999). Functional anatomy of intrinsic alertness: Evidence for a fronto-parietal-thalamic-brainstem network in the right hemisphere.
Neuropsychologia,37(7), 797–805.
Stuss, D. T., Murphy, K. J., Binns, M. A., & Alexander, M. P. (2003). Staying on the job: The frontal lobes control individual performance variability.Brain,
126(Pt 11), 2363–2380.
Teichner, W. H. (1974). The detection of a simple visual signal as a function of time on watch.Human Factors,16, 339–353.
van den Bergh, B. R. H., Mennes, M., Stevens, V., van der Meere, J., B¨orger, N., Stiers, P., et al. (2006). ADHD deficit as measured in adolescent boys with a continuous performance task is related to antenatal maternal anxiety.
Pediatric Research,59(1), 78–82.
van der Meere, J., Wekking, E., & Sergeant, J. A. (1991). Sustained attention and pervasive hyperactivity.Journal of Child Psychology and Psychiatry,
32(2), 275–284.
Voelbel, G. T., Bates, M. E., Buckman, J. F., Pandina, G., & Hendren, R. L. (2006). Caudate nucleus volume and cognitive performance: Are they related in childhood psychopatholo