Minimum Bit Error Rate Multiuser Detection in
Multiple Antenna Aided OFDM
M. Y. Alias, A. K. Samingan, S. Chen, L. Hanzo
Dept. of ECS., Univ. of Southampton, SO17 1BJ, UK.
Tel: +44-703-593 125, Fax: +44-703-593 045
Email: [email protected], http://www-mobile.ecs.soton.ac.uk
Abstract— In this contribution, we propose a Minimum Bit Error Rate (MBER) multiuser detector for Space Divi-sion Multiple Access (SDMA) aided Orthogonal Frequency Division Multiplexing (OFDM) systems. It is shown that the MBER detector outperforms the Minimum Mean Squared Error (MMSE) detector, since the MBER detector directly minimizes the BER, while MMSE detector minimizes the mean-squared error (MSE), which does not guarantee achiev-ing the minimum BER. When supportachiev-ing two users, the proposed MBER scheme substantially outperforms the clas-sic MMSE arrangement in the investigated propogation sce-nario.
I. INTRODUCTION
I
N an effort to increase the achievable system capacity of an OFDM system, antenna arrays can be employed for supporting multiple users in a Space Division Multi-ple Access (SDMA) communications scenario [1-4]. The benefit of this system is that in case of employing a suf-ficiently high number of receiver antennas at the base sta-tion, the degree of freedom provided by the
number of
base station receiver antennas and number of transmit
antennas is higher than necessary for supporting number
of simultaneous users. Hence, the remaining degrees of freedom allow us to increase the achievable receiver diver-sity gain of the system and therefore contributes towards improving the system’s transmission integrity.
A variety of linear multiuser detectors have been pro-posed for performing the separation of OFDM users based on their unique, user-specific, spatial signature provided that their channel impulse response was accurately esti-mated [2,4]. The most popular design strategy is consti-tuted by the minimum mean-squared-error (MMSE) mul-tiuser detector (MUD). However, as recognised in [5-8], a better strategy is to choose the linear detector’s coeffi-cients so as to directly minimize the error-probability or bit-error rate (BER), rather than the mean-squared error (MSE). This is because minimizing the MSE does not nec-cessarily guarantee that the BER of the system is also mini-mized. The family of detectors that directly minimizes the BER is referred to as the minimum bit-error rate (MBER) detector [9,10]. In this contribution, we will investigate the performance of the proposed MBER linear MUD in the context of an uplink SDMA/OFDM system.
II. SPACEDIVISIONMULTIPLEACCESSSYSTEM
MODEL
The so-called SDMA system is capable of differentiat-ing users’ transmitted signals at the base-station (BS)
invoking their unique, user-specific spatial signature cre-ated by the channel transfer functions or channel impulse responses (CIR) between the users’ single transmit antenna and the
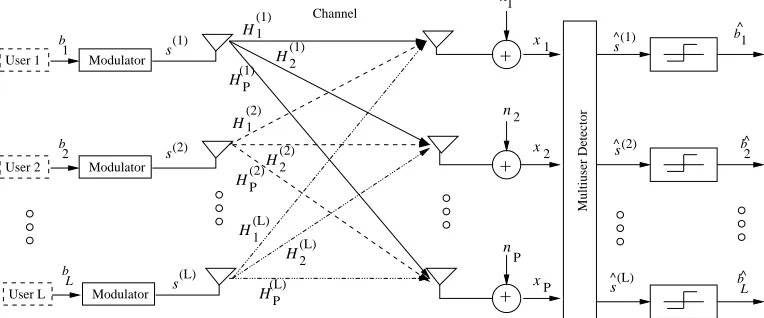
different receiver antennas at the BS [1], [4]. Figure 1 portrays the antenna array aided uplink trans-mission scenario considered. In this figure, each of the
simultaneous users is equipped with a single
trans-mission antenna, while the receiver capitalizes on a
-element antenna front-end [11]. The set of complex
sig-nals,
received by the
-element an-tenna array in the -th subcarrier of the -th OFDM
sym-bol is constituted by the superposition of the independently faded signals associated with the users sharings the same
space-frequency resource [4]. The received signal was cor-rupted by the Gaussian noise at the array elements. The
in-dices have been omitted for notational convenience
during our forthcoming discourse, yielding [4]:
x Hs n x n (1)
where the "!-dimensional vector x of the received
signals, the vector of transmitted signals s and the array noise vector n, respectively, are given by:
x #%$&')(*+-,.!0/. (2)
s 1&$231"(*1"4%!0/5 (3)
n #6$&+7(*+7,8!+/8 (4)
Furthermore,x represents the noiseless component of x.
The frequency domain channel transfer function matrix H
of dimension9
is constituted by the set of channel
transfer function vectors of the users:
H h$ h( h4 ! (5)
each of which describes the frequency domain channel transfer function between the single transmitter antenna as-sociated with a particular user: and the reception array
el-ements;<
:
H(1)1
H(1)2 H(1)P
H(2)1
H(2)2 H(2)P
H(L)2
H(L)P s(2)
H1(L)
(L)
s
User L Modulator
b L
User 2 2
b
User 1 1 Modulator
b
+
n xP
P 1
n
+ x1
+
x n2
2 s^(2)
s(1)
(L)
s ^
s(1)
^ b^1
L b^
2
b^
Modulator
Channel
[image:2.595.109.491.49.208.2]Multiuser Detector
Fig. 1. Schematic of an antenna array aided OFDM uplink scenario, where each of the users is equipped with a single transmit antenna and the BS’s receiver is assisted by a -element antenna front-end.
The complex data signal, 1 =, transmitted by the :-th user,
:5 and the AWGN noise process, , at any
an-tenna array element , <
are assumed to exhibit a zero mean and a variance of
(
= and
(
for the data
sig-nal and AWGN noise process, respectively. The frequency domain channel transfer functions,
= of the different
ar-ray elements
for users: are
in-dependent, stationary, and complex Gaussian distributed processes with zero-mean and unit variance. For linear multiuser detectors, the estimate
of the transmitted sig-nal vector
of the simultaneous users is generated by
linearly combining the signals received by the
different antenna elements at the BS with the aid of the array weight matrix , resulting in:
(7)
By substituting Equation 1 into Equation 7 and considering the:-th user’s associated vector component, we will arrive
at:
1=
=
=
=
=
=
=
=B1=A
=
4
$
=
1
=
(8)
where the weight vector = is the:-th column of the weight
matrix . The first term of Equation 8 refers to the
de-sired user’s contribution, while the second and third term represent the interfering users’ contributions and the Gaus-sian noise, respectively. At the current state-of-the-art, the most popular MUD strategy is the MMSE design, where
= is chosen as the unique vector minimizing the MSE
ex-pressed as MSE
1= 1=B!
(
, namely as [4]:
= ! #"%$'&
(
(
*)
!,+
$
=@ (9)
where
= is the:-th column of the system matrix
.
III. ERRORPROBABILITY IN ABPSK SYSTEM
In this paper the term BER and probability of error
$
are used interchangeably. The BER encountered at the
out-put of the MUD w= of user: may be expressed as [12]:
w=B!
sgn0/3=!21 1=0w=B!4365&
7"=8395* (10)
where72= is the signed decision variable given by:
7=> sgn0/3=B!81 1='w=B! (11)
The Probability Density Function (PDF) of the decision variable7 = is constituted by a mixture of the Gaussian
dis-tribution associated with each possible combination of the transmitted data symbols of all users. Under the assump-tion that all the noise-free signal states are equiprobable, the PDF of7
= is given by [12]:
;:=<0>7"=!
?A@,B CED
GF w
= w
=
H8I
J=
$;K
L
+NMPO <>Q sgn
M
I
MSR>T
<
TVU
W
MR>T
<
T
XY
X
Z w[< w < \
(12)
where
?#@
is the number of equiprobable combinations of the binary vectors of the users, i.e. we have
? @
C
4
. Furthermore, 1
J
&
=
N]
?#@
, denotes the noiseless signal at the output of the MUD related to the :-th user,
while/
J
&
=
]
?A@
, is the transmitted bit of user:.
The erronous decision events are associated with the area under the PDF curve in the interval^_ `5 !, which is
quantified as:
$ w=B! ab
+c
d: e7"=gf w=B!ih%7=+ (13)
Upon using the integration by substitution technique and introducing the shorthand of
j
J
>7 = sgn>/
J
&
=
! 1
J
&
=
!
C
(
w
= w
=
(14)
the probability of error in Equation 13 becomes:
$ w=!
?#@`B CED H8I
J=
$
alk
R
w<&
+mc nporq
L
j
J
!
(
C
\
h
j
J
?#@ H2I
J=
$s t
J
0 16 32 48 64 80 96 112 128 Symbol Index 0.0 0.2 0.4 0.6 0.8 A m p li tu d e
(a) CIR 1: user 1, antenna 1
0 16 32 48 64 80 96 112 128
Symbol Index 0.0 0.2 0.4 0.6 0.8 A m p li tu d e
(b) CIR 2: user 1, antenna 2
0 16 32 48 64 80 96 112 128
Symbol Index 0.0 0.2 0.4 0.6 0.8 1.0 A m p li tu d e
(c) CIR 3: user 2, antenna 1
0 16 32 48 64 80 96 112 128
Symbol Index 0.0 0.2 0.4 0.6 0.8 1.0 A m p li tu d e
[image:3.595.66.283.56.329.2](d) CIR 4: user 2, antenna 2
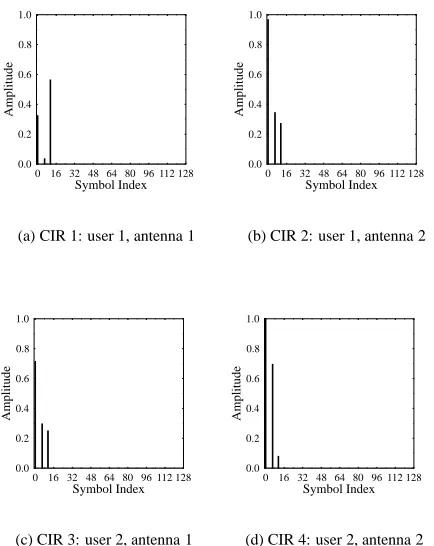
Fig. 2. Four different channel impulse responses (CIR) recorded at the two receiver antennas for the two users supported.
wherew is given by:
w sgn w w sgn w x w w (16) wherex "!$#&%&%'%()+*
constitutes a possible value ofx
defined in the context of Equation 1. Note that the BER is invariant to a positive scaling of the weight vector, in other words, the BER depends only on the vectorial direction of w, but not on its magnitude.
IV. EXACTMBER MULTIUSERDETECTION
The MBER solution is defined as [12]:
w -,+./ 0
13245+6-7
w8:9 /
w
%
(17)
However, the complex, irregular shape of the BER cost function prevents us from deriving a closed-form solution for the MBER MUD weights. Therefore in practice an iterative strategy based on the steepest-descent gradient method can be used for finding the MBER solution [12]. According to this method, the linear MUD’s weight vector
;
is iteratively updated, commencing for example from
the MMSE weights of Equation 9, until the weight vector that exhibits the lowest BER is arrived at. In each step, the weight vector is updated according to a specific step-size, < , in the vectorial direction in which the BER cost
function decreases most rapidly, namely in the direction opposite to the gradient of the BER cost function given in Equation 21. The steepest-descent gradient algorithm that can be used for finding the MBER solution is summarised as follows [12]:
;
=?>@ A
;
=?>B @C<DE?>B (18)
where the step-size is represented by< , and the update
di-rection vectorDE?>B at instance> is given by:
DE?>BA FHGJI 8 9 /LK ; B?>BNM % (19)
In Equation 19,GJI
8
9
/HK
;
= >OOM is the gradient of
9
/LK
;
B >OOM
with respect to;
and> indicates the iteration index. By
exploiting the following identity [12]:
P PRQTSCU WV X WV ZY [\^][_ Y K ` Q NM P 3 Q PRQ F Y Ka Q OM P a Q PRQ (20)
the gradient of
9 /
;
b with respect to the MUD’s weight
vector;
can then be computed by:
G I 8 9 / ; #
) *c dfe gh i jkl monqp-r`sWtNup h pvbw 8 wyxz { pvw 8 wW| |} | ~f 8 8 P ; P ; #
) * c dfe gh i jkl mon p-z { pvbw 8 w| |} | ~fR 8 8 E4`7 F ; ; b | @ ; ; ; ; 3 |L #
)+* c dfe
; ; F ; ; ? ; ; 3 | g h i jk l mRn p-z { pvbw 8 w| |} | ~ 8 8 &4`7 % (21)
Observe in Equation 16 that BER is independent of the magnitude of the MUD’s weight vector, and the knowl-edge of the orientation of the detector’s weight vector is sufficient for defining the decision boundary of the linear MBER detector. Therefore the MBER detector has an in-finite number of solutions.
It is desirable in any optimisation problem to have a sin-gle global minimum. In the case of the proposed MBER, the MUD’s global BER minimum is found by constrain-ing the detector’s weight vector to have a unity magnitude. This is achieved by introducing the normalisation process in each iteration according to:
; ; ; ; ; ; % (22)
With the aid of this normalisation, the gradient expression of Equation 21 can be simplified to [12]:
G I 8 9 / ; A #
)J* c dfe
gh i jk& F B d f=47b ` ; o F (23) where;
is the MUD’s normalised weight vector
0 16 32 48 64 80 96 112 128
Subcarriers
0.0 0.5 1.0 1.5 2.0 2.5
M
ag
n
it
u
d
e
(a) CTF 1: user 1, antenna 1
0 16 32 48 64 80 96 112 128
Subcarriers
0.0 0.5 1.0 1.5 2.0 2.5
M
ag
n
it
u
d
e
(b) CTF 2: user 1, antenna 2
0 16 32 48 64 80 96 112 128
Subcarriers
0.0 0.5 1.0 1.5 2.0 2.5
M
ag
n
it
u
d
e
(c) CTF 3: user 2, antenna 1
0 16 32 48 64 80 96 112 128
Subcarriers
0.0 0.5 1.0 1.5 2.0 2.5
M
ag
n
it
u
d
e
[image:4.595.70.285.49.335.2](d) CTF 4: user 2, antenna 2
Fig. 3. Channel transfer functions (CTF) for the CIRs seen in Figure 2 (a) CTF 1, (b) CTF 2, (c) CTF 3, and (d) CTF 4.
that the constraint of Equation 22 imposed on the optimi-sation problem of Equation 21 reduces the infinite number
of MBER solutions to a single solution. In our
previ-ous discourse we assumed the explicit knowledge of the matrix H defined in Equation 1. However, in practice H has to be determined on the basis of the channel impaired noisy value of x and hence a number of techniques have been proposed in references [5,8,9,12] to this effect.
V. RESULTS ANDDISCUSSION
In our quantitative investigations we used the simplest possible SDMA OFDM system supporting two users with the aid of two receiver antennas. As shown in Figure 1, each user has a unique channel transfer function (CTF) with respect to each receiver antenna. The four corre-sponding CIRs are shown in Figure 2 and the resultant CTFs are depicted in Figure 3. The CIRs represent a three-path indoor type channel [13], where no fading is expe-rienced. Correspondingly, the time-invariant CTF 1 and CTF 2 are encountered by user 1 at the first and second receiver antenna, respectively. Similarly, CTF 3 is encoun-tered at the first receiver antenna and CTF 4 at the second by user 2. The OFDM modem had 128 subcarriers. In our simulations, we initialised the iterative MBER algorithm to the MMSE MUD weights given by Equation 9.
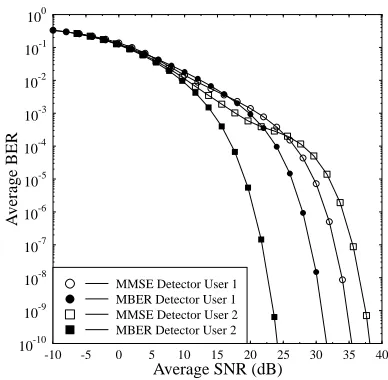
The results of our simulations are shown in Figures 4, 5 and 6. The average BER of user 1 and user 2 recorded in the context of both the MMSE and MBER detector is portrayed in Figure 4. We can see from this figure that user 1 has a better average BER in conjunction with the MMSE detector compared to user 2 for SNRs in excess of about 25 dB. By contrast, the MBER detector of user 2 outperforms
-10 -5 0 5 10 15 20 25 30 35 40
Average SNR (dB) 10-10
10-9 10-8 10-7 10-6 10-5 10-4 10-3 10-2 10-1 100
A
v
er
ag
e
B
E
R
[image:4.595.324.518.53.243.2]MBER Detector User 2 MMSE Detector User 2 MBER Detector User 1 MMSE Detector User 1
Fig. 4. Average BER versus the average SNR expressed in dB for the
MMSE and the MBER multiuser detectors of user 1 and user 2 supported by two receiver antennas using 128 subcarrier OFDM communicating over the channel characterised by the CIRs and CTFs shown in Figure 2 and Figure 3, respectively.
that of user 1 in terms of the average BER. We can also see that the MBER detectors of both users have a substan-tially lower average BER compared to the MMSE detec-tors. Again, as expected, this is because the MMSE is di-rectly minimising the MSE and not the BER. We may also note that the average BER difference between the MMSE and MBER detectors is not the same for both users. Specif-ically, the MBER MUD of user 2 has an SNR advantage of almost 12 dB, while that of user 1 has about 5 dB SNR ad-vantage. This is a consequence of the unique combinations of the channel transfer functions of both users, since it can be seen in Figure 2 that the CIR of user 1 exhibits a lower ratio between the main and the delayed CIR taps than that of user 2.
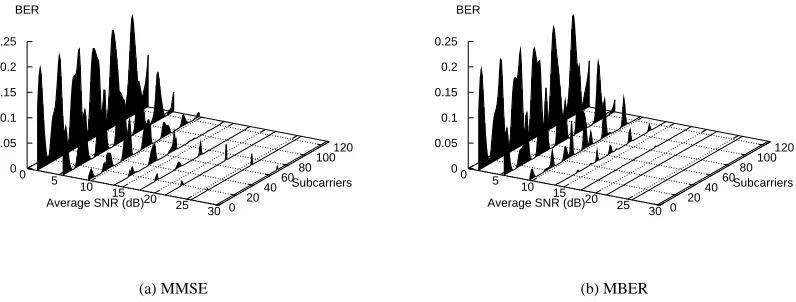
In Figure 5 and Figure 6, we can see that the BER of the MMSE and MBER MUD is different for every OFDM subcarrier. This is because the particular combination of the CTFs is unique for the different OFDM subcarriers. These CTF differences will result in a time-variant system matrix, H, for each OFDM subcarrier, thus imposing a di-rect influence on the calculation of the MUD’s weight val-ues, as suggested by Equation 9 and Equation 17 for the MMSE and MBER MUD, respectively. By comparing the BER plots of Figure 5 and Figure 6 recorded for user 1 and user 2 respectively, we can see that the BER peaks of the dramatically attenuated subcarriers of Figure 3 are sub-stantially higher for the MMSE MUD.
VI. CONCLUSION
0 5 10
15 20 25 30 Average SNR (dB) 0 20
40 60 80 100
120 Subcarriers 0
0.05 0.1 0.15 0.2 0.25
(a) MMSE
0 5 10
15 20 25 30 Average SNR (dB) 0 20
40 60 80 100
120 Subcarriers 0
0.05 0.1 0.15 0.2 0.25
[image:5.595.98.516.75.224.2](b) MBER
Fig. 5. BER versus the average SNR for every OFDM subcarrier for the (a) MMSE, and (b) MBER multiuser detector of user 1 when supporting two users with the aid of two receiver antennas using 128 subcarrier OFDM communicating over the channel characterised with the aid of the CIR and CTF shown in Figure 2 and Figure 3, respectively.
0 5 10
15 20 25 30 Average SNR (dB) 0 20
40 60 80 100
120 Subcarriers 0
0.05 0.1 0.15 0.2 0.25
BER
(a) MMSE
0 5 10
15 20 25 30 Average SNR (dB) 0 20
40 60 80 100
120 Subcarriers 0
0.05 0.1 0.15 0.2 0.25
BER
(b) MBER
Fig. 6. BER versus the average SNR for every OFDM subcarrier for the (a) MMSE, and (b) MBER multiuser detector of user 2 when supporting two users with the aid of two receiver antennas using 128 subcarrier OFDM communicating over the channel characterised with the aid of the CIR and CTF shown in Figure 2 and Figure 3, respectively.
OFDM system will experience different unique combina-tions of the channel transfer funccombina-tions in the context of the different antennas, their performance also varied. This is also true in the context of the subcarriers’ BERs due to the frequency selective nature of the multipath channels en-countered. Our future research will study the interaction of MBER MUDs and channel coding, when communicat-ing over time-variant fadcommunicat-ing channels.
REFERENCES
[1] B. Suard, G. Xu, H. Liu, and T. Kailath, “Uplink Channel Capacity of Space-Division-Multiple-Access Scheme,” IEEE Transactions on Information Theory, vol. 44, no. 4, pp. 1468–1476, July 1998. [2] P. Vandenameele, L. Van Der Perre, M. G. E. Engels, B. Gyselinckx,
and H. J. De Man, “A Combined OFDM/SDMA Approach,” IEEE Journals of Selected Areas in Communications, vol. 18, no. 11, pp. 2312–2321, November 2000.
[3] H. B ¨olcskei, D. Gesbert, and A. J. Paulraj, “On The Capacity of OFDM-Based Spatial Multiplexing Systems,” IEEE Transactions on Communications, vol. 50, no. 2, pp. 225–234, February 2002. [4] L. Hanzo, M. M ¨unster, B. J. Choi and T. Keller, OFDM and
MC-CDMA, John Wiley and IEEE Press, West Sussex, England, 2003. [5] A. K. Samingan, S. Chen, and L. Hanzo, “Adaptive Minimum
Sym-bol Error Rate CDMA Multiuser Detection for Pulse Amplitude Modulation,” in Proceedings of IEEE VTC (Spring), Jeju, Korea, 2003, pp. 2812–2816.
[6] X. Wang, W.-S. Lu, and A. Antoniou, “Constrained Minimum-BER Multiuser Detection,” IEEE Transactions on Signal Processing, vol. 48, no. 10, pp. 2903–2909, October 2000.
[7] R. C. de Lamare and R. Sampaio-Neto, “Adaptive MBER Deci-sion Feedback Multiuser Receivers in Frequency Selective Fading Channels,” IEEE Communications Letters, vol. 7, no. 2, pp. 73–75, February 2003.
[8] S. Chen, L. Hanzo, and N. N. Ahmad, “Adaptive Minimum Bit Error Rate Beamforming Assisted Receiver for Wireless Commu-nications,” in Proceedings of IEEE International Conference of Acoustics, Speech and Signal Processing (ICASSP), Hong Kong, China, 2003, vol. IV, pp. 640–643.
[9] B. Mulgrew and S. Chen, “Adaptive Minimum-BER Decision Feed-back Equalizers for Binary Signalling,” EURASIP Signal Process-ing Journal, vol. 81, no. 7, pp. 1479–1489, 2001.
[10] C.-C. Yeh and J. R. Barry, “Adaptive Minimum Bit-Error Rate Equalization for Binary Signalling,” IEEE Transactions on Com-munications, vol. 48, no. 7, pp. 1226–1235, July 2000.
[11] M. M ¨unster and L. Hanzo, “Co-channel Interference Cancella-tion Techniques for Antenna Array Assisted Multiuser OFDM Sys-tems,” in 3G-2000, London, UK, March 2000, pp. 256–260. [12] S. Chen, A. K. Samingan, B. Mulgrew, and L. Hanzo, “Adaptive
Minimum-BER Linear Multiuser Detection for DS-CDMA Signals in Multipath Channels,” IEEE Transactions on Signal Processing, vol. 49, pp. 1240–1247, June 2001.
[image:5.595.102.500.281.432.2]