EUROPHYSICS LETTERS
Europhys. Lett., 31 (8), pp. 497-502 (1995)
10 September 1995
Measurement
of
Foam Density Profiles
Using
AC capacitance.
S. HuTzLER(*)(**), G. VERBIST(**), D. WENRE(*) and J. A. VAN DER STEEN(**) (*) Physics Department, Trinity College - Dublin, Ireland
(**) Koninklijke/Shell-Laboratorium, Amsterdam (Shell Research BV)
P.O.
Box
3003, 1003AA
Amsterdam, The Netherlands(received 22 June 1995; accepted in final form 22 July 1995)
PACS. 82.70Rr - Aerosols and foams.
PACS. 07.07Df - Sensors (chemical, optical, electrical, movement, gas, etc.); remote sensing.
PACS. 47.60+i - Flows in ducts, channels, nozzles and conduits.
Abstract.
-
The dynamics of foam drainage (free, forced and pulsed) is monitored by the determination of local liquid density using a vertical array of capacitors. Liquid profiles are obtained for various drainage experiments. The merging of two solitary waves is in good agreement with theoretical predictions. Such capacitance measurements offer a convenient practical technique for characterising the more general properties of non-conducting foams.Introduction. - Foams are of practical importance in activities as diverse as brewing and fire-fighting. They present a number of challenges to current theory and experiments, in characterising their complex structure and its evolution. Here we are concerned with the vertical profile of density (or liquid fraction), which varies with time in a manner which depends on initial and boundary conditions.
When a foam is freshly made, the liquid drains out of it until equilibrium is reached between gravity and capillary effects. Clearly it is important, in relation t o a wide variety of properties and applications, to understand such drainage in detail. Measurements of the vertical density profile and its variation with time are particularly valuable, since they contain much more information than the amount of drained liquid, which has often been determined in the past. There seem to have been hardly any determinations of vertical profiles until recently. NMR scanning offers a possibility to measure density profiles
[ll.
Using this technique, German and Me Carthy [2] studied the drainage of whipped egg white: for a fresh interpretation of the data see ref. [3]. Gonatas and Glazier [4] have made similar measurements in aqueous foams. Weaire et al. [5] have shown that AC conductivity may be used, but their preliminary data was confined to the time variation at a single point (see also [6]). In this paper we describe the first use of AC capacitance for such a purpose, and use it to measure complete profiles under various different conditions. In one case we shall relate the observations to theoretical expectations; the remainder will await further analysis.498 EUROPHYSICS LETTERS
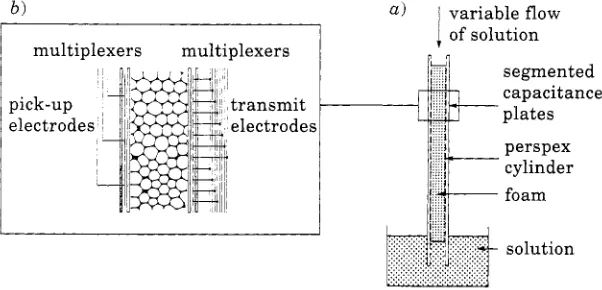
AC capacitance measurement. - The schematic set-up is shown in fig. la). A perspex tube, which is surrounded by the capacitance sensor, is placed vertically in a bath of detergent solution. Foam is created inside the tube by blowing air through a fine nozzle located beneath it. A slow, constant bubble rate results in a foam of uniform cell size. In order t o perform capacitance measurements, a non-ionic detergent solution is needed. We used Dobanol23-7 NRE together with demineralised water, which gives a stable, non-conducting foam.
A capacitance sensor with the parallel-plate capacitor geometry shown in fig. l b ) has been used. Both capacitor plates are segmented. A capacitor segment is formed by a transmit or excitation electrode and its projection on the opposite pick-up or detection electrode. An AC excitation signal at a frequency in the kHz range is sent t o each of the 46 excitation electrodes in sequence, by use of multiplexers. By switching the corresponding pick-up electrode to a charge amplifier, each capacitor segment can be individually measured.
The segment capacitance depends on the liquid fraction of the foam at that vertical position. The capacitance of a foam depends on its liquid content, on account of the different dielectric constants of its constituents (gas and surfactant solution). By scanning the capacitor segments and making an appropriate transformation, the vertical density profile of the foam may be obtained. The scan time is well below a second while the time scale of drainage is somewhat larger, hence we can follow the development of the profile.
The relation between the measured capacitance and the observed liquid fraction is not a simple linear one. We used the following calibration procedure. The foam was wetted with a steady flow from a burette in order to obtain a homogeneous liquid fraction throughout, leading to a constant signal intensity all along the tube. By measuring the depth d to which the foam extends beneath the liquid surface, the liquid fraction is simply found as Oliquid = = d / h ( h is the total foam height) using Archimedes law. This procedure is repeated for different flow rates, using the same foam sample. A simple model circuit, consisting of a capacitor in parallel and one in series with the liquid-dependent capacitor representing the
variable flow of solution b )
, multiplexers multiplexers
segmented
+
capacitance [image:2.480.90.391.416.561.2]plates
S. HUTZLER et al.: MEASUREMENT O F FOAM DENSITY PROFILES USING A c CAPACITANCE 499
0.00 0.04 0.08 0.12
liquid fraction 0 ,
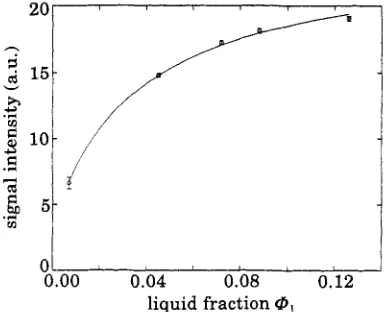
Fig. 2. - Signal intensity as a function of the liquid fraction of a foam. Foams with constant liquid fraction throughout their vertical extension can be made by means of forced drainage. The symbols display measured data, the solid line is a least-square fit of the data, see text. This calibration curve shows data for one foam.
foam, was used to obtain an empirical fit function. Figure 2 shows data and least-square fit of one calibration run.
All our measurements were done on foam samples with approximately the same bubble size (the bubble diameter was in the order of a millimeter), leading to similar fit parameters for the several calibration runs that we performed.
The resolution of our sensor was determined by introducing perspex and teflon cylinders with sharp interfaces into the tube and measuring the corresponding signals. Assuming Gaussian broadening, the signal intensity I(y) as a function of vertical coordinate y can be fitted to
We determined the width parameter to be U = 1.2 cm as the vertical resolution of our sensor, t o be compared with the segment length, which is 2cm.
F o a m density profiles. - Adding solution at the top of the foam column at a constant rate establishes a sharp interface between wet and dry foam which moves downwards at a constant velocity as a solitary wave [7,8]. As it reaches the bottom of the tube, a foam with a constant liquid fraction over most of the tube is developed. We will refer to this type of experiment as forced drainage in contrast to free drainage in which there is no input.
The theory has very simple ingredients[9]: Poiseuille flow through Plateau borders (channels of liquid at the intersection of bubble walls) with no dissipation at their junctions. The Plateau borders expand or contract in accordance with the local Laplace pressure within them, making this kind of flow distinct from that of a solid porous medium.
[image:3.484.141.335.77.233.2]500 EUROPHYSICS LETTERS
0.001 I
0.12
C) 0.04
I * pulsed
0.001
0 5 10 15 20 25 30 35
segment number
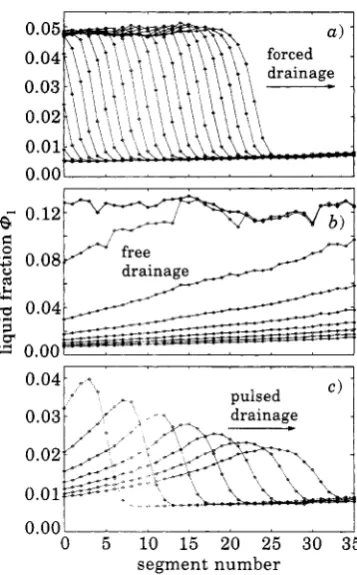
Fig. 3. - Foam density profiles. The liquid fraction is plotted vs. the height of the foam column. The z-axis covers a range of 70 em. Note that top and bottom parts of the foam are not included in the plots.
a) Solitary wave with approximately five per cent liquid moving from the top of the foam to the bottom (from left to right in the figure). The shown profies were recorded at time intervals of two seconds, it thus can be seen that the wave moves with a constant velocity. The line at the bottom of the plot shows the density profile of a dry foam. b) Free drainage of a foam. A foam with initially around 13 % liquid dries as the input of liquid is stopped. The profiles are taken a t intervals of 20 seconds, showing extended linear sections. c) Pulse of liquid moving down a foam. The time interval between preceeding profiles is 20 seconds. The part of the foam where the liquid is introduced is not shown in the figure.
Switching off the input flow then allows the study of the process which we call f r e e drainage: liquid drains out of the initially uniform foam. Figure 3b) shows an example of this process: the profiles were taken at intervals of 20 seconds. After about three minutes an equilibrium profile is developed. The linear profile observed was previously predicted [lo] and seen, to some extent, in NMR data [ l , 21. For a fuller discussion of this and other aspects of free drainage, see[11].
An interesting, although not yet fully understood, variation of the above is what we call pulsed drainage: a fixed amount of solution is injected into the foam a t a short time span (a few seconds). This pulse can then be monitored as it moves down the column; see fig. 3c).
[image:4.481.156.335.74.362.2]S. HUTZLER et al.: MEASUREMENT O F FOAM DENSITY PROFILES USING AC CAPACITANCE 501
20
1
i
5t
i
I I
0 5 10 15 20 25
segment number
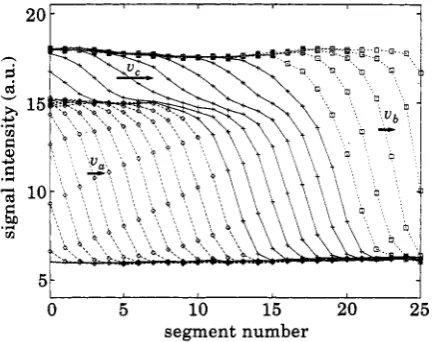
Fig. 4. - Double-wave experiment. A solitary wave is established by wetting the foam a t the top. When the flow rate is increased, the drainage profile shows a second wave (the so-called catch-up wave) which rides on top of the orginal one until they coalesce and only a single wave remains. The arrows indicate the velocities of the waves, for details see text.
initial and final velocities [9]
Figure 4 shows our experimentally obtained density profile for this experiment as a function of time and vertical position. The velocities were determined as
va
= 1.00 2 0.05 cm/s,vb
= 1.0 rt 0.2 cm/s andv,
= 2.4 f 0.4 cm/s. These are in agreement with the prediction within the experimental errors.Applications.
-
The capacitance sensor used here was originally developed for the more limited purpose of determining oil/water interfaces in oil tanks [12], see also [13]. Several modifications of the apparatus could be introduced to optimise its peformance for foam density profile measurements, including tailoring the electronics to linearise its output and hence monitor the liquid fraction directly.The segmented-capacitance-measuring technique is not limited to monodisperse foam, but may equally be applied to study a polydisperse foam or foam turbulence, for example. Monitoring of hydrocarbon foams is feasible, if the measuring electronics are optimised for the much lower signal magnitude (1:40). For conductive media, a segmented conductance measurement may be developed.
[image:5.480.130.348.78.249.2]502 EUROPHYSICS LETTERS
* * *
This work was supported by the EU Mobility Programme, FOAMPHYS Network, Contract ERBCHRXCT940542; SH is an HCM Fellow. We thank N. VAN Os, J. BOUMAN and M. KRIJGER for providing an excellent non-ionic surfactant. SH likes to thank R. PHELAN and
S. FINDLAY for many useful discussions.
R E F E R E N C E S
[ l ] ASSINK R. A., CAPRIHAN A. and FUKUSHIMA E., AZChE J., 34 (1988) 2077. [21 GERMAN J. B. and Mc CARTHY M. J., J. Agric. Food Chem., 37 (1989) 1321. [3] WEAIRE D., VERBIST G. and MC CARTHY M. J., to be published.
[4] GONATAS D. P. U. and GLAZIER J. A., private communication (1995).
[51 WEAIRE D., FINDLAY S. and VERBIST G., J. Phys. Condens. Matter, 7 (1995) L217.
[61 JASHNANI I. L. and LEMLICH R., Znd. Eng. Chem. Fundum., 14 (1975) 131. [71 GOL’DFARB I. I., KA” K. B. and SHREIBER I. R., Fluid Dynamics, 23 (1988) 244. [SI WEAIRE D., PITTET N., HUTZLER S. and PARDAL D., Phys. Rev. Lett., 71 (1993) 2670. [9] VERBIST G. and WEAIRE D., Europhys. Lett., 26 (1994) 631.
[lo] KRAYNIK A. M., Sandia Report SAND 83-0844 (1983). [113 WEAIRE D. and VERBIST G., to be published.
[12] LEYEN A. C. W., and SPAARGAREN K. (Shell Research), Patent E P 149279, Level gauge f o r
[131 YANG W. Q., BRANT M. R. and BECK M. S., Meas. Sci. Technok, 5 (1994) 1177.