Twitter Bot Detection using Diversity Measures
Dijana Kosmajac Faculty of Computer Science
Dalhousie University Halifax, NS, Canada [email protected]
Vlado Keselj
Faculty of Computer Science Dalhousie University
Halifax, NS, Canada [email protected]
Abstract
Social bots are autonomous entities that gen-erate a significant amount of social media con-tent. The content being created can be harm-less or even contain beneficial information. On the other hand, it may target a certain audi-ence to influaudi-ence opinions, often politically motivated, or to promote individuals to ap-pear more popular than they really are. In this work we present a simple method for bot de-tection on Twitter platform relying on user ac-tivity fingerprint, complemented with a set of well-known statistical diversity measures. We demonstrate the benefits of the method on two datasets used in a couple of previous studies by various researchers.
1 Introduction
Automated user (bot) is a program that emulates a real person’s behavior on social media. A bot can operate based on a simple set of behavioral instructions, such as tweeting, retweeting, “lik-ing” posts, or following other users. In general, there are two types of bots based on their purpose: non-malicious and malicious. The non-malicious bots are transparent, with no intent of mimick-ing real Twitter users. Often, they share moti-vational quotes or images, tweet news headlines and other useful information, or help companies to respond to users. On the other hand, malicious ones may generate spam, try to access private ac-count information, trick users into following them or subscribing to scams, suppress or enhance po-litical opinions, create trending hashtags for finan-cial gain, support political candidates during elec-tions (Bessi and Ferrara,2016), or create offensive material to troll users. Additionally, some influ-encers may use bots to boost their audience size.
At first, automated users sharing random bits of information across Twitter may not seem like a threat, but bots can potentially jeopardize online
user security. Bots on social media platforms gen-erate spam content and degrade overall user expe-rience. With the growth of social networks and their influence in news and information sharing, bots have become a serious threat to democracies. The “foreign actors” use bots to share politically polarizing content in the form of fake news in or-der to increase its influence or intentionally pro-mote certain people and their agenda. Counter-measures are needed to combat these coordinated influence campaigns. Bots are constantly evolv-ing and adaptevolv-ing their behaviour to mimic real users. Nevertheless, many of these bots are coor-dinated (Chavoshi et al.,2016), which means that they can show similar behaviour. This character-istic can be used to develop models for bot detec-tion.
We explore bot detection techniques using users’ temporal behaviour. Additionally, we apply a set of statistical diversity measures to describe how diverse the user behaviour is over extended period of time. Using datasets from two differ-ent researchers (Cresci et al., 2016; Varol et al.,
2017) we examine if automated accounts have less diverse behaviour than genuine user accounts and if these measures can help in detecting au-tomated behaviour without diving into language-specific analyses. Second, we explore if the way the dataset is collected affects the ability of the measures to capture the difference between bot and human accounts.
Finally, in Section8we give the conclusions and briefly discuss about future work.
2 Related Work
One of the most prominent tasks in recent social media analysis is detection of automated user counts (bots). Research on this topic is very ac-tive (Messias et al., 2013;Yang et al., 2014; Gi-lani et al., 2016), because bots pose a big threat if they’re intentionally steered to target important events across the globe, such as political elec-tions (Bessi and Ferrara,2016;Varol et al.,2017;
Howard et al., 2018; Guess et al., 2019; Stella et al.,2018;Hjouji et al.,2018). Paper by ( Mes-sias et al., 2013) explore strategies how bot can interact with real users to increase their influence. They show that a simple strategy can trick influ-ence scoring systems. BotOrNot (Davis et al.,
2016) is openly accessible solution available as API for the machine learning system for bot de-tection. Authors (Davis et al., 2016;Varol et al.,
2017) show that the system is accurate in detect-ing social bots. Authors (Shu et al., 2018) ex-plore methods for fake news detection on social media, which is closely related to the problem of automated accounts. They state that the perfor-mance of detecting fake news only from content in general doesn’t show good results, and they suggest to use user social interactions as auxil-iary information to improve the detection. Fer-rara et al. (Ferrara et al.,2016) use extensive set of features (tweet timing, tweet interaction network, content, language, sentiment) to detect the online campaigning as early as possible. Another recent work on bot detection by Cresci et al. (Cresci et al.,
2016) is based on DNA inspired fingerprinting of temporal user behaviour. They define a vocabu-lary Bn, where n is the dimension. An element represents a label for a tweet. User activity is represented as a sequence of tweets labels. They found that bots share longer common substrings (LCSs) than regular users. The point where LCS has the biggest difference is used as a cut-off value to separate bots from genuine users. Framework by Ahmed et al. (Ahmed and Abulaish,2013) for bot detection uses the Euclidean distance between feature vectors to build a similarity graph of the accounts. After the graph is built, they perform clustering and community detection algorithms to identify groups of similar accounts in the graph.
Bot problem on social media platforms inspired
Total Genuine Bots
Original 2,573 1,747 826
[image:2.595.316.518.63.106.2]Used in study 2,115 1,421 694
Table 1: Varol 2017 dataset.
Users Tweets
Genuine 3,474 8,377,522
Spambots #1 991 1,610,176
Spambots #2 3,457 428,542
Spambots #3 464 1,418,626
Total 8,386 11,834,866
Table 2: Cresci 2017 dataset.
many competitions and evaluation campaigns such as DARPA (Subrahmanian et al.,2016) and PAN1.
3 Datasets 3.1 Varol dataset
The dataset used in this study is made available by Varol et al. (Varol et al., 2017) on the web-site2. The dataset, in the original study consisting of 3,000 user accounts was manually annotated by four volunteers. At the time of download of the la-beled user ids, the dataset consisted of 2,573 anno-tated samples. However, when we crawled the bot accounts, some of the users were banned or had protected profile. The final dataset in this study consists of 2,115 accounts. In Table 1 is shown how many accounts were lost per class.
The dataset was crawled on January 5th, 2019 and it contains 5,261,940 tweets. Number of tweets per user ranges from 20 to 3,250 (we fil-tered out accounts that have fewer than 20 tweets). Data imbalance is evident in the original annotated dataset, as well as the reduced one.
3.2 Cresci dataset
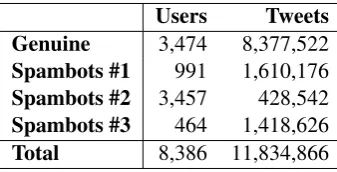
The dataset was obtained from Cresci et al. (Cresci et al.,2017) in the form that was used in the orig-inal study. The Twitter dataset constitutes of the real-world data used in our experiments. Table2
reports the number of accounts and tweets they feature. According to the study (Cresci et al.,
2017) the genuine accounts are a random sample of genuine (human-operated) accounts. The social
1
https://pan.webis.de/publications.html
2
[image:2.595.331.500.143.229.2]spambots 1 dataset was crawled from Twitter dur-ing the Mayoral election in Rome 2014. Spam-bots 2 dataset is a group of Spam-bots who spent sev-eral months promoting a specific hashtag. Spam-bots 3 group advertised products on sale on Ama-zon.com. The deceitful activity was carried out by spamming URLs pointing to the advertised prod-ucts.
4 Digital fingerprint of user online behaviour
DNA sequences have been exploited in different areas such as forensics, anthropology, biomedical science and similar. Cresci (Cresci et al., 2016) used the idea of DNA coding to describe social media user behaviour in temporal dimension. The same idea was used in this study, with a slightly modified way of coding. We define a set of codes Anwith lengthn= 6. The meaning of each code
is given in (1).
An=
0, plain
8, retweet
16, reply
1, has hastags
2, has mentions
4, has URLs
(1)
Vocabulary, given the code set A, consists of
3∗ 23 = 24 unique characters. Each character, which describes a tweet is constructed by adding up codes for tweet features. First three codes de-scribe the type of the tweet (retweet, reply, or plain) and the rest describe content of the tweet. For example, if a tweet is neither retweet nor re-ply, it is plain (with the code = 0). If the tweet contains hashtags, thencode = code+ 1, If the same tweet contains URLs, thencode=code+ 4. Final tweet code is 5. We transform it to a charac-ter label by using ASCII table characcharac-ter indexes: ASCII tbl[65 + 5] = F. The number of tweets with attributes encoded with characters determines the length of the sequence. The sequence, in our case, is simply the length of a user timeline, that is, actions in chronological order with the appropriate character encoding.
The example of a user fingerprint generated from their timeline looks like:
f puser = (ACBCASSCCAF F ADADF...)
4.1 Fingerprint segmentation using n-gram technique
To calculate data statistics, we extracted n-grams of different length (we conducted the experiments with n=1,2,3 length combinations). Fig.1 shows the example on 3-gram extraction of sample user fingerprint. N-gram segments are used to calculate
Figure 1: 3-gram extraction example from user finger-print.
richness and diversity measures, which may unveil the difference between genuine user and bot online behaviour.
5 Statistical Measures for Text Richness and Diversity
Statistical measures for diversity have long his-tory and wide area of application (Tweedie and Baayen,1998). The most prominent use is in eco-logical domain (Morris et al., 2014) for measur-ing biodiversity. Diversity measures for a natural language texts are used in stylometry and author-ship attribution (Stamatatos,2009). As text statis-tics they are defined as computational measures that converge to a value for a certain amount of text and remain invariant for any larger size. Be-cause such a measure exhibits the same value for any size of text larger than a certain amount, its value could be considered as a text characteristic. The intuition for using diversity measures in this work is that measures should show the differences between the observed classes. In the next couple of paragraphs we briefly describe which measures are used in this study. The following notation is used: N is the total number of words in a text, V(N) is the number of distinct words, V(m, N)
is the number of words appearingm times in the text, andmmaxis the largest frequency of a word.
5.1 Yule’s K Index
Yule’s original intention for K use is for author attribution task, assuming that it would differ for texts written by different authors.
K =CS2−S1 S12 =C
h
−1 N+
mmax
X
m=1
V(m, N)(m N)
To simplify, S1 = N = PmV(m, N), and S2 =Pmm2V(m, N).Cis a constant originally
determined by Yule, and it is104.
5.2 Shannon’s H Index
The Shannon’s diversity index (H) is a measure that is commonly used to characterize species di-versity in a community. Shannon’s index accounts for both abundance and evenness of the species present. The proportion of speciesirelative to the total number of species (pi) is calculated, and then
multiplied by the natural logarithm of this propor-tion (ln(pi)). The resulting product is summed across species, and multiplied by -1.
H =− V(N)
X
i=1
piln(pi)
V(N)is the number of distinct species.
5.3 Simpson’s D Index
Simpson’s diversity index (D) is a mathematical measure that characterizes species diversity in a community. The proportion of species i relative to the total number of species (pi) is calculated
and squared. The squared proportions for all the species are summed, and the reciprocal is taken.
D= 1
PV(N)
i=1 p2i
5.4 Honor´e’s R Statistic
Honor´e (Honor´e,1979) proposed a measure which assumes that the ratio ofhapax legomenaV(1, N)
is constant with respect to the logarithm of the text size:
R= 100 log(N) 1− VV(1(N,N))
5.5 Sichel’s S Statistic
Sichel (Sichel,1975) observed that the ratio of ha-pax dis legomena(number of n-grams that occur once in a sample)V(2, N)to the vocabulary size is roughly constant across a wide range of sample sizes.
S = V(2, N) N
We use this measure to express the constancy of n-gram hapax dis legomena (number of n-grams that occur twice in a sample) which we show to be distinct for genuine and bot accounts.
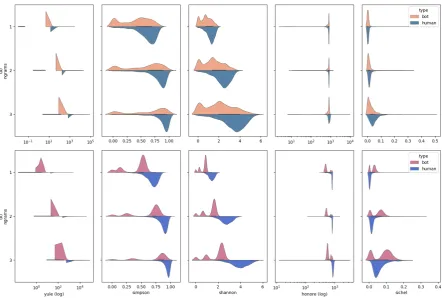
On the Fig.3we show the comparison of den-sity plots of all measures of bot accounts versus genuine users.
6 Experiments 6.1 Data Visualizations
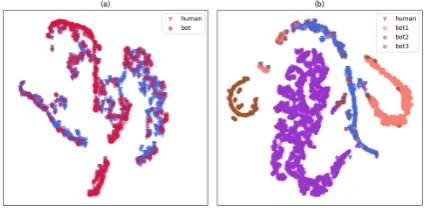
[image:4.595.310.524.398.503.2]For visualizing the datasets in 2d space we used t-SNE (Maaten and Hinton, 2008), an enhanced method based on stochastic neighbour embedding. Fig.2shows the visualisations. Features used for the visualization are same as for the classifiers (di-versity measures of fingerprint n-grams, in this case combination n=1,2,3). Varol dataset (the fig-ure on the left(a)) appears to have more confusion between genuine and bot samples, but the separa-tion is still visible. The right hand figure(b)shows Cresci dataset where we coloured separately three types of spambots and the genuine accounts. It is interesting to notice that three types of bots appear to be distinct groups in the feature space. The rea-son for this is likely the way how the dataset was collected. Each spambot group was collected sep-arately around a specific event in relatively short period of time. For the opposite reason, Varol dataset is a collection of accounts that may or may not be connected by the same background event or topic.
Figure 2: t-SNE representation: (a) Varol dataset and (b) Cresci dataset.
already mentioned, were originally developed for natural language text constancy measure. Both of them try to measure features that naturally occur in texts - hapax legomena and hapax dis legomena. The differences are not as prominent as for Shannon and Simpson indices. Furthermore, the feature importance discussed later will show that these two measures (Shannon and Simpson) contribute most to the classifier.
6.2 Classifiers
We conducted the experiments with five differ-ent algorithms: Gaussian Na¨ıve Bayes, Support Vector Machines, Logistic regression, K Nearest Neighbours and two ensemble methods – Random Forest and Gradient Boosting. The implementa-tion was done usingscikit-learnmachine learning package in python. For hyper-parameter tuning we used grid search cross validation method for every classifier. Extensive grid search didn’t show sig-nificant improvement for the classifiers from using the default parameters provided in the library. The only improvement was observed with SVM clas-sifier, where we found that it performed best with the polynomial kernel of 4th degree. We applied all classifiers on different number of n-grams (1-3), where combinations were: 1, 1+2, and 1+2+3. We run three experiments on all classifiers. The first is 10-fold cross validation on Cresci dataset, second is 10-fold cross validation on Varol dataset, and third is the experiment on classifiers with en-tire Cresci dataset training and enen-tire Varol dataset validation. With the first and second experiments the aim was to explore how important it is for a dataset to be collected in a shorter time frame ver-sus extended period of time, which is the case with the observed datasets. The third experiment is de-signed to test if the dataset with better results can improve the performance of the second dataset.
7 Results and Discussion
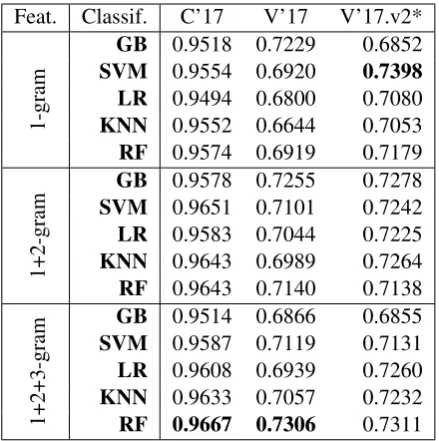
In Table3we report the results of the experiments using the F1 measure. The values represent aver-age of 10-fold validation scores. First, we analyze the use of statistical diversity of n-grams as fea-tures for the set of different classifiers and the ef-fect of increasing the n-gram order on the perfor-mance of the models. Training the Random For-est classifier on n-grams shows an increase in the performance for both datasets. However, the icrease is slight with the inicrease of number of
n-Feat. Classif. C’17 V’17 V’17.v2*
1-gram
GB 0.9518 0.7229 0.6852
SVM 0.9554 0.6920 0.7398
LR 0.9494 0.6800 0.7080
KNN 0.9552 0.6644 0.7053
RF 0.9574 0.6919 0.7179
1+2-gram
GB 0.9578 0.7255 0.7278
SVM 0.9651 0.7101 0.7242
LR 0.9583 0.7044 0.7225
KNN 0.9643 0.6989 0.7264
RF 0.9643 0.7140 0.7138
1+2+3-gram
GB 0.9514 0.6866 0.6855
SVM 0.9587 0.7119 0.7131
LR 0.9608 0.6939 0.7260
KNN 0.9633 0.7057 0.7232
[image:5.595.307.527.61.282.2]RF 0.9667 0.7306 0.7311
Table 3: 10-fold validation on datasets, F1 measure shown. *V’17.v2 results are using entire Varol dataset as test for Cresci trained classifiers. (C’17 - Cresci dataset, V’17 - varol dataset)
grams from 1 to 3. Random Forest classifier has the best performance with the F1 average 0.9667 for experiment 1, and 0.7306 for the experiment 2. Second, we can observe the dramatic difference in performance between two datasets. In the data vi-sualizations (Fig.2and Fig.3) the data separation in Varol dataset is somewhat worse than in Cresci dataset, and this is reflected in the classifiers’ per-formance. Our argument is that this is due to a dif-ferent data collection techniques. As mentioned earlier, Cresci dataset was collected around spe-cific events and using keywords, so the users, es-pecially bots have correlated behaviour. On the other hand, Varol dataset was collected (directly from Twitter, given the provided labeled ids) two years after the first study performed by the orig-inal researcher (Varol et al., 2017). The differ-ences between human and bot accounts are less distinguished, but still show significant difference according to the diversity measures. In our third experiment, we used entire Cresci dataset to train the models (we used best parameters from experi-ment 1 for each model setup) and tested it on entire Varol dataset. The results obtained were very sim-ilar to the ones in experiment 2, and we did not gain much of an improvement. Best classifier per-formance was obtained with SVM, and unigram feature setting reaching average F1 0.7398.
Figure 3: Diversity measures distributions for Varol (a) (top row) and Cresci (b) (bottom row) datasets.
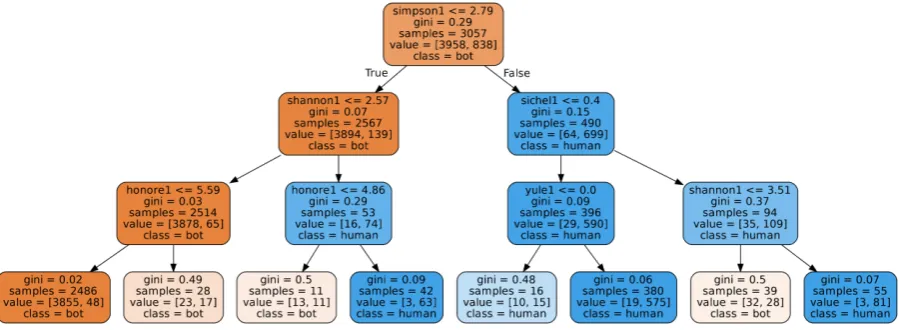
Random Forest classifier trained on Cresci dataset with diversity measures on unigrams. The most influential feature for this classifier is Simpson’s diversity measure (root). The separation between bot and human is on 2.79 value. The accounts which have less or equal the value are more likely to be bots. Other measures, such as Shannon on the second level, separate accounts further. To note, this is pruned classifier with maximum depth of 3, while in the Table3 we did not have depth constraint. This classifier has average F1 measure of 0.9548 (+/- 0.0508) using 10-fold validation.
8 Conclusions and Future Work
In this paper we conducted a set of experiments to find a simple, yet effective bot detection method on Twitter social media platform. We show that it is possible to detect automated users by us-ing a fus-ingerprint of user behaviour and a set of statistical measures that describe different aspects of that behaviour. The measures describe “con-stancy” or “diversity” of the pattern. The hypothe-sis was that the automated users show lower diver-sity, and tend to use smaller set of types of mes-sages over extended period of time. Through vi-sual analysis, discussion and classification results
we showed that assumption did hold under our ex-perimental setup. Additionally, we conducted the experiments on two different datasets used earlier in the research community to examine if the time-span of user behaviour has impact on the ability to detect bots. We showed that the dataset which was collected focused around specific topics and shorter time-span generally performed better than the dataset where users diverge. The strength of this approach lies in the fact that it is language in-dependent.
The main drawback of our approach is that a classifier needs at least 20 tweets per user to gen-erate a fingerprint. The number 20 was empirically picked based on our experiments (keeping the fin-gerprints shorter than 20 worsened the results of all classifiers). Another point is that social bots evolve over time, and they tend to be more dif-ficult to identify with established machine learn-ing methods. Bot creators can take advantage of the present ML knowledge and enhance their al-gorithms, so they stay longer undetected.
Figure 4: Example decision tree estimator from Random Forest classifier. Cresci dataset.
elections (Boatwright et al.,2018). Next, we plan to develop an unsupervised method for bot detec-tion on the same set of features using clustering techniques.
References
Faraz Ahmed and Muhammad Abulaish. 2013. A generic statistical approach for spam detection in on-line social networks. Computer Communications, 36(10-11):1120–1129.
Alessandro Bessi and Emilio Ferrara. 2016. Social bots distort the 2016 us presidential election online dis-cussion.
Brandon C Boatwright, Darren L Linvill, and Patrick L Warren. 2018. Troll factories: The internet research agency and state-sponsored agenda building.
Re-source Centre on Media Freedom in Europe.
Nikan Chavoshi, Hossein Hamooni, and Abdullah Mueen. 2016. Identifying correlated bots in twitter. InSocial Informatics, pages 14–21, Cham. Springer International Publishing.
Stefano Cresci, Roberto Di Pietro, Marinella Petroc-chi, Angelo Spognardi, and Maurizio Tesconi. 2016. Dna-inspired online behavioral modeling and its ap-plication to spambot detection. IEEE Intelligent Systems, 31(5):58–64.
Stefano Cresci, Roberto Di Pietro, Marinella Petroc-chi, Angelo Spognardi, and Maurizio Tesconi. 2017.
The paradigm-shift of social spambots: Evidence, theories, and tools for the arms race. CoRR, abs/1701.03017.
Clayton Allen Davis, Onur Varol, Emilio Ferrara, Alessandro Flammini, and Filippo Menczer. 2016. Botornot: A system to evaluate social bots. In Pro-ceedings of the 25th International Conference
Com-panion on World Wide Web, pages 273–274.
Interna-tional World Wide Web Conferences Steering Com-mittee.
Emilio Ferrara, Onur Varol, Filippo Menczer, and Alessandro Flammini. 2016. Detection of promoted social media campaigns. In tenth international
AAAI conference on web and social media.
Zafar Gilani, Liang Wang, Jon Crowcroft, Mario Almeida, and Reza Farahbakhsh. 2016. Stweeler: A framework for twitter bot analysis. InProceedings of the 25th International Conference Companion on
World Wide Web, pages 37–38. International World
Wide Web Conferences Steering Committee.
Andrew Guess, Jonathan Nagler, and Joshua Tucker. 2019. Less than you think: Prevalence and predic-tors of fake news dissemination on facebook. Sci-ence advances, 5(1):eaau4586.
Zakaria el Hjouji, D Scott Hunter, Nicolas Guenon des Mesnards, and Tauhid Zaman. 2018. The impact of bots on opinions in social networks. arXiv preprint
arXiv:1810.12398.
Efstathios Honor´e. 1979. Some simple measures of richness of vocabulary. Association for Literary and Linguistic Computing Bulletin, 7:172–177.
Philip N. Howard, Samuel Woolley, and Ryan Calo. 2018. Algorithms, bots, and political communica-tion in the us 2016 eleccommunica-tion: The challenge of auto-mated political communication for election law and administration. Journal of Information Technology & Politics, 15(2):81–93.
Laurens van der Maaten and Geoffrey Hinton. 2008. Visualizing data using t-sne. Journal of machine
learning research, 9(Nov):2579–2605.
Johnnatan Messias, Lucas Schmidt, Ricardo Augusto Rabelo de Oliveira, and Fabr´ıcio Benevenuto de Souza. 2013. You followed my bot! transforming robots into influential users in twitter.
Torsten Meiners, Caroline M¨uller, Elisabeth Ober-maier, Daniel Prati, et al. 2014. Choosing and us-ing diversity indices: insights for ecological appli-cations from the german biodiversity exploratories.
Ecology and evolution, 4(18):3514–3524.
Kai Shu, Suhang Wang, and Huan Liu. 2018. Under-standing user profiles on social media for fake news detection. In 2018 IEEE Conference on
Multime-dia Information Processing and Retrieval (MIPR),
pages 430–435. IEEE.
H. S. Sichel. 1975. On a distribution law for word fre-quencies. Journal of the American Statistical Asso-ciation, 70(351a):542–547.
Efstathios Stamatatos. 2009. A survey of modern au-thorship attribution methods. Journal of the Ameri-can Society for information Science and Technology, 60(3):538–556.
Massimo Stella, Emilio Ferrara, and Manlio De Domenico. 2018. Bots increase exposure to negative and inflammatory content in online so-cial systems. Proceedings of the National Academy
of Sciences, 115(49):12435–12440.
VS Subrahmanian, Amos Azaria, Skylar Durst, Vadim Kagan, Aram Galstyan, Kristina Lerman, Linhong Zhu, Emilio Ferrara, Alessandro Flammini, and Fil-ippo Menczer. 2016. The darpa twitter bot chal-lenge. Computer, 49(6):38–46.
Fiona J Tweedie and R Harald Baayen. 1998. How variable may a constant be? measures of lexical rich-ness in perspective. Computers and the Humanities, 32(5):323–352.
Onur Varol, Emilio Ferrara, Clayton A Davis, Filippo Menczer, and Alessandro Flammini. 2017. Online human-bot interactions: Detection, estimation, and characterization. In Eleventh international AAAI conference on web and social media.
Zhi Yang, Christo Wilson, Xiao Wang, Tingting Gao, Ben Y Zhao, and Yafei Dai. 2014. Uncovering so-cial network sybils in the wild. ACM Transactions