Advance Access publication 2017 June 12
Far-infrared emission in luminous quasars accompanied by nuclear
outflows
Natasha Maddox,
1‹M. J. Jarvis,
2,3M. Banerji,
4,5P. C. Hewett,
4N. Bourne,
6L. Dunne,
6,7S. Dye,
8S. Eales,
7C. Furlanetto,
8,9S. J. Maddox,
6,7M. W. L. Smith
7and E. Valiante
71ASTRON, the Netherlands Institute for Radio Astronomy, Postbus 2, NL-7990 AA Dwingeloo, the Netherlands 2Oxford Astrophysics, Denys Wilkinson Building, University of Oxford, Keble Road, Oxford OX1 3RH, UK 3Physics Department, University of the Western Cape, Cape Town 7535, Republic of South Africa 4Institute of Astronomy, Madingley Road, Cambridge CB3 0HA, UK
5Kavli Institute of Cosmology Cambridge, Madingley Road, Cambridge CB3 0HA, UK 6Institute for Astronomy, University of Edinburgh, Royal Observatory, Edinburgh EH9 3HJ, UK 7School of Physics and Astronomy, Cardiff University, The Parade, Cardiff CF24 3AA, UK
8School of Physics and Astronomy, University of Nottingham, University Park, Nottingham NG7 2RD, UK 9CAPES Foundation, Ministry of Education of Brazil, Brasilia/DF, 70040-020, Brazil
Accepted 2017 June 6. Received 2017 May 19; in original form 2017 March 28
A B S T R A C T
Combining large-area optical quasar surveys with the new far-infrared (FIR) Herschel-ATLAS Data Release 1, we search for an observational signature associated with the minority of quasars possessing bright FIR luminosities. We find that FIR-bright quasars show broad CIV emission-line blueshifts in excess of that expected from the optical luminosity alone, indicating particularly powerful nuclear outflows. The quasars show no signs of having redder optical colours than the general ensemble of optically selected quasars, ruling out differences in line-of-sight dust within the host galaxies. We postulate that these objects may be caught in a special evolutionary phase, with unobscured, high black hole accretion rates and correspondingly strong nuclear outflows. The high FIR emission found in these objects is then either a result of star formation related to the outflow, or is due to dust within the host galaxy illuminated by the quasar. We are thus directly witnessing coincident small-scale nuclear processes and galaxy-wide activity, commonly invoked in galaxy simulations that rely on feedback from quasars to influence galaxy evolution.
Key words: surveys – galaxies: evolution – quasars: general – galaxies: star formation – infrared: galaxies.
1 I N T R O D U C T I O N
The coincidence of the peak of star formation (SF) density (Hopkins et al.2008) and accretion in active galactic nuclei (AGN; Richards et al.2006) indicates a link between the two processes. This con-nection is further reinforced by the relationship between the mass of galaxy bulges and the central black holes they host (Magorrian et al.1998; Ferrarese & Merritt2000). Some interaction between nuclear activity and SF in the host galaxies, generally referred to as ‘feedback’, is invoked to facilitate this link. Simulations routinely insert feedback from AGNs to quench SF and prevent galaxies from becoming arbitrarily large by heating and/or expelling the gaseous fuel for future SF (Bower et al. 2006; Sijacki et al. 2007). The mechanism for expelling the gas is generally considered to be an
E-mail:[email protected]
outflow, driven either by radiation or radio jets, originating with the AGN.
Feedback from AGNs on galaxy (Morganti, Tadhunter & Oosterloo2005) and even cluster scales (Rawlings & Jarvis2004) is readily observed at radio and X-ray wavelengths, in a process com-monly known as ‘radio mode’ or ‘kinetic’ feedback (see Fabian 2012for a review). On smaller scales, radio jets are seen to inter-act with the intergalinter-actic medium, clearing gas from the nuclear region (e.g. Morganti et al.2013). Radiation or ‘quasar mode’ feed-back from luminous quasars,1is more difficult to observe directly.
Collections of objects at low redshift (Mullaney et al.2013; Ci-cone et al.2014) and high redshift (Brusa et al.2015; Harrison et al. 2016) show indications of outflowing gas in the properties of narrow
1We use the term ‘AGN’ to describe an actively accreting black hole, and
emission lines. Broad absorption line quasars (BALQSOs) show clear evidence of rapid outflows driven by the AGN, reaching speeds of many thousands of kilometres per second (km s−1; Weymann,
Carswell & Smith1981). Similar outflows can also be observed in X-rays (Reeves, O’Brien & Ward2003; Reeves et al.2009). The energy injected, and ultimately the effect on the BALQSO host galaxy, is difficult to determine, except under special circumstances (Moe et al.2009; Dunn et al.2010; Capellupo, Hamann & Barlow 2014).
In the context of feedback, and the coincidence of the SF and AGN histories, directly observing signatures of the interaction be-tween the AGN and galaxy-wide SF is complicated by the very small spatial scales encompassing the black hole environment, and our inability to spatially resolve these scales for all but the most local systems. An additional complicating fact is that emission from lumi-nous, unobscured quasars dominates the spectral energy distribution (SED) at most wavelengths, with the exception of the far-infrared (FIR; defined herein as 60–500µm), where dust heated by SF is a significant emitter (Schweitzer et al.2006; Hatziminaoglou et al. 2010). With the arrival of sensitive, relatively high spatial resolu-tion FIR imaging over the large areas required to contain the rare, luminous quasars, we now have the data to probe samples spanning a wide range of intrinsic luminosities and redshifts.
Recent investigations decomposing the SEDs of quasars show contributions at FIR wavelengths both from warm dust, heated by the AGNs, and cooler dust, heated by SF throughout the galaxy (Podigachoski et al.2015; Symeonidis et al. 2016; Symeonidis 2017). These studies find the relative contributions and resulting FIR luminosity vary from object to object, with some systems show-ing an excess of FIR flux, and others remainshow-ing undetected at these long wavelengths. While optically more luminous quasars are more likely to be detected in a FIR-flux-limited sample, not all of the most luminous quasars are FIR-detected. Conversely, optically less luminous quasars, while less frequently FIR-bright, do also show FIR emission. Irrespective of a putative underlying correlation be-tween FIR and accretion luminosity, the observations show that for a given accretion luminosity, a wide range of FIR luminosities are possible.
Here, we investigate the minority of optically selected quasars that are observed to be FIR bright, searching for some observa-tional signature that can be linked with the cause of their FIR flux, incorporating data from theHerschel2Space Observatory (Pilbratt
et al.2010). In Section 2, we describe the data used for the study, and investigate the quasar properties in Section 3. A discussion and conclusions are presented in Section 4. Concordance cosmology withH0=70 km s−1Mpc−1(thush≡H0/[100 km s−1Mpc−1]=
0.7),m=0.3 and=0.7 is assumed throughout.
2 O P T I C A L Q UA S A R S A N D F I R DATA
We use FIR photometry from the largest-area survey undertaken with theHerschelSpace Observatory, the Herschel Astrophysical Terahertz Large Area Survey (H-ATLAS; Eales et al.2010). The full survey covers 600 deg2in five infrared bands centred at 100
and 160 (PACS, Poglitsch et al.2010), and 250, 350 and 500µm (SPIRE, Griffin et al.2010). We focus on the three equatorial fields centred on RA=9, 12 and 15 h, contained within the Data Release
2Herschelis an ESA space observatory with science instruments provided
[image:2.595.309.549.83.146.2]by European-led Principal Investigator consortia and with important partic-ipation from NASA
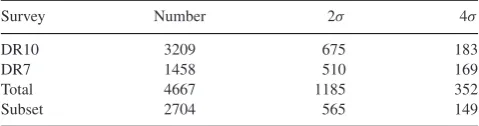
Table 1. Numbers of quasars from each survey contributing to the final sample. Subset is restricted to 1.6≤z≤4.8.
Survey Number 2σ 4σ
DR10 3209 675 183
DR7 1458 510 169
Total 4667 1185 352
Subset 2704 565 149
1 (DR1; Valiante et al.2016). These three fields cover 161.6 deg2,
and have extensive multiwavelength ancillary data, crossmatching for which is described in Bourne et al. (2016). The catalogues can be downloaded from the H-ATLAS website.3
The three equatorial fields have been covered by the Sloan Digital Sky Survey (SDSS; York et al.2000). We extract quasars from the Data Release 7 (DR7; Schneider et al.2010) and Data Release 10 quasar catalogues (DR10; Pˆaris et al.2014). For objects common to both surveys, the order of preference is SDSS DR10> SDSS DR7, as the DR10 spectra have larger wavelength coverage and generally higher signal-to-noise ratio (S/N). The different flux limits and selection algorithms for DR7 and DR10 are complementary, and result in a combination of surveys with essential dynamic range in luminosity and redshift, less affected by selection effects known to plague individual surveys. The number of objects from each survey contributing to the final quasar sample is listed in Table1. The full sample of 4938 quasars spans 0 < z< 5, and several orders of magnitude in optical luminosity. Objects associated with radio sources from the Faint Images of the Radio Sky at Twenty-centimetres survey (FIRST; Becker, White & Helfand 1995) are excluded from the sample, to avoid contamination of the FIR from synchrotron emission. The final sample contains 4667 quasars.
We wish to explore beyond the nominal 4σ flux limit of the published FIR catalogues, so we extract 250µm fluxes and 1σ un-certainties at the coordinates of the optical quasars directly from the maps, downloaded from the H-ATLAS webpage. This is possible because we know with high precision the positions of the quasars within the maps. For the fluxes, we use the HATLAS_GAMA <FIELD>_DR1_FILT_BACKSUB<BAND>. FITS maps, whereFIELDis 9, 12 or 15 andBANDis 250. We set the mean of the maps to zero to remove any remaining offsets. The correspond-ing noise is extracted from the associated noise maps,HATLAS_ GAMA<FIELD>_DR1_FILT_SIGMA<BAND>. FITS. The noise maps include only instrumental noise, so confusion noise de-rived from equation (14) of Valiante et al. (2016) and a 5.5 per cent calibration term are added in quadrature to produce the final 1σ uncertainty.
The map astrometry is accurate enough to use the flux in the maps at the 6 arcsec pixel corresponding to the optical position of the quasars. The flux densities are monochromatic, and assume
Fν∝ν−1, whereF
νis the flux andνis the frequency. High-redshift
quasars are unresolved in the 18 arcsecHerschelbeam. Compar-ing the 250µm map fluxes and uncertainties for our extracted 4σ sources with those from the published catalogues show good agree-ment.
We restrict our analysis to sources with 2σ 250µm detections, increasing the number of quasars with FIR fluxes from 352 at 4σ to 1185 at 2σ. Our results are unchanged if we use only 3σ or 4σ sources, at the expense of poorer statistics. As we deal here only with fluxes, we are not required to make any assumptions
about the emission mechanism for the FIR radiation. Based on SED decomposition of FIR-detected quasars (Hatziminaoglou et al. 2010; Podigachoski et al.2015), the observed 250µm fluxes will have an increasing contribution from warm dust in the torus heated by the AGNs with increasing redshift, combined with flux from cooler dust heated by SF. That some combination of AGNs and SF-heated dust is producing FIR flux is sufficient for this investigation.
3 E V I D E N C E O F N U C L E A R O U T F L OW S I N F I R - B R I G H T Q UA S A R S
Here, we investigate the ultraviolet (UV) spectral properties of the FIR-detected quasars to gain insight into their extreme FIR lumi-nosity. While high-redshift quasars are spatially unresolved, their spectroscopic details allow us to probe material at a variety of galacto-centric radii, including the innermost parsecs surrounding the AGNs. We focus on the CIVemission line, as it is a bright,
prominent spectral feature that can be studied in moderate resolu-tion, moderate S/N spectra, and is found to show large variations in its properties, which correlate with a number of other quasar observables (Richards et al.2011).
3.1 Measuring redshifts and blueshifts
The redshifts for both the SDSS DR7 and DR10 quasars have been determined using a mean field independent component analysis (MFICA) scheme, as described in Allen et al. (2013). For each quasar the spectrum is reconstructed using the MFICA components and the redshift is determined simultaneously. Conceptually, the ap-proach is identical to that used to give thezPCAredshifts of the SDSS
DR12 quasars (Pˆaris et al.2017), where components derived from a principal component analysis (PCA) are employed (e.g. Francis et al.1992; Pˆaris et al.2011). The MFICA-derived redshifts show significantly reduced systematic bias as a function of the form of the quasar spectra (Allen & Hewett, in preparation). In the context of the investigation presented in this paper, the redshift improvements are not critical and all results would remain essentially unchanged if, instead, redshifts for SDSS DR7 quasars from Hewett & Wild (2010) andzPCAfor SDSS DR10 quasars (Pˆaris et al.2017) were
employed.
To calculate the CIVblueshift we first define a power-law contin-uum,f(λ)∝λα, with the slope,α, determined using the median val-ues of the flux in two continuum windows at 1445–1465 and 1700– 1705 Å. The power-law continuum is subtracted from the spectrum. The CIVemission line is taken to extend over the wavelength
inter-val 1500–1600 Å(corresponding to approximately±10 000 km s−1
from the rest-frame transition wavelength), a recipe that is com-monly adopted (e.g. Denney et al.2013). Narrow absorption fea-tures, which are frequently found superimposed on CIVemission,
are identified and a simple interpolation scheme employed to ‘fill in’ the emission line flux at wavelengths affected by the absorption. The blueshift of the CIVemission line, in km s−1, is defined asc×
(1549.48−λhalf)/1549.48, wherecis the velocity, 1549.48 Å is the
rest-wavelength of the CIVemission, assuming equal contributions
from both components of the doublet, andλhalfis the wavelength
which bisects the cumulative CIVemission line flux. This
proce-dure has been found to be less sensitive to problems arising from low-S/N spectra. Full details of the CIVmeasurements can be found
in Coatman et al. (2016).
[image:3.595.305.547.52.272.2]Our redshift range is restricted to 1.6≤z≤4.8 to ensure cov-erage of the C IVfeature in the SDSS spectra. BALQSOs have
Figure 1. Thei-band luminosity and redshift ranges for the quasars detected in the FIR at≥2σ(red points), and the matched sample of quasars undetected at≤1σ (blue points). The histograms on the bottom and side show the normalized distributions of the respective populations in redshift andLi.
been excluded, as accurate parametrization of the emission line and blueward continuum are not possible for these objects.
3.2 Blueshifted CIVin FIR-bright quasars
Blueshifted CIVemission lines in quasar spectra are nearly
ubiq-uitous, with the magnitude of the blueshift showing correlations with a variety of other properties (see Richards et al.2011for a comprehensive investigation). CIVblueshifts are associated with
disk-wind driven nuclear outflows (Gaskell1982; Murray et al. 1995; Richards et al.2011), and thus provide information about the conditions on small spatial scales, in the immediate environ-ment of the central supermassive black hole. Large CIVblueshifts
are also associated with quasars accreting at high Eddington ratios (Coatman et al. 2016). This phase is expected to be short-lived (Hopkins et al.2005; Hopkins & Elvis2010).
We create matched FIR-detected and FIR-undetected samples in order to compare the CIVblueshifts for the FIR-bright quasars with
respect to the general quasar population. For every S/N≥2 FIR-detected quasar, we choose a quasar with FIR S/N≤1 at the closest redshift andi-band magnitude. For cases where one FIR-undetected object is the closest match to several FIR-detected objects, as is com-mon at bright luminosities where most objects are FIR-detected, the next nearest neighbour is chosen if it is within a distance of 0.3 in the redshift–Log(Li) plane. If there is no suitable next nearest
neighbour, the duplicated closest match is accepted. The ranges in
i-band luminosity,Li, and redshift for the resulting matched
sam-ples is shown in Fig.1. We restrict the sample to have log(Li)<
13.2 Ldue to a lack of FIR-undetected sources at the highest luminosities. Constructing a matched sample removes the known underlying correlation between CIVblueshift and quasar luminosity
Figure 2. Cumulative distribution of the blueshift of the CIVemission
line for the quasars detected in the FIR at≥2σ(red solid line), and those undetected at≤1σ(blue dashed line). The FIR-detected quasars have larger CIVblueshifts, indicating more prominent nuclear-driven outflows. The bottom panel shows normalized histograms of the detected and FIR-undetected CIVblueshifts, in red and blue, respectively.
hypothesis that the two histograms are drawn from the same un-derlying distributions of these two observables.
Fig. 2 shows the cumulative distributions of C IV blueshift
for the FIR-detected and FIR-undetected matched samples. The FIR-detected quasars show larger blueshifts than is expected from their FIR-undetected counterparts, with a two-sided KS test return-ing a probability that the two distributions are drawn from the same underlying sample of 10−12. Using 3σ and 4σ FIR detections
in-stead of the 2σ detections, the KS test returns probabilities of 10−8
and 0.0001 that the FIR-detected and FIR-undetected distributions are from the same underlying samples. The 4σsample contains only 140 FIR-detected objects, and thus suffers from the small sample size. Recall that BALQSOs have been removed from the sample, so the difference cannot be attributed to absorbed flux in the blue wing of the emission line. While a nuclear outflow is not always accompanied by a FIR excess, for the sample as a whole, at a given optical luminosity, FIR-bright quasars have larger CIVblueshifts
than FIR-undetected quasars.
3.3 Red or reddened quasars
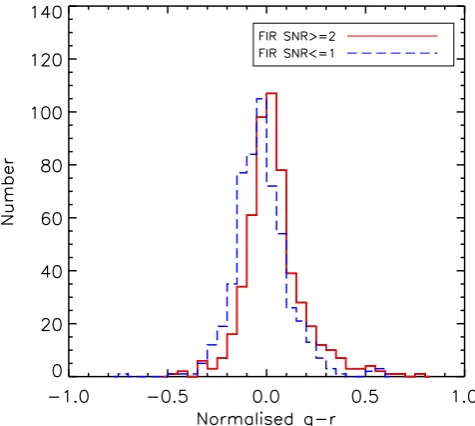
[image:4.595.309.547.56.269.2]Vigorous SF is known to be a dusty process, so if the FIR flux is at least partly from SF, we may expect the FIR-detected quasars to be reddened by dust in the host galaxies, as evidenced by red-der optical colours with respect to the general quasar population. Using the same FIR-detected and FIR-undetected matched samples as before, we compare the SDSSg−rcolours of the two sam-ples. For these luminous quasars, the optical photometry is entirely dominated by emission from the quasar, even if accompanied by a starburst in the host galaxy. To remove the redshift dependence of quasar colours, the colour of an unreddened model quasar similar to that from Maddox et al. (2008) is subtracted from each object
Figure 3. g−rcolour for FIR and FIR non-detected quasars, normalized by theg−rcolour for the unreddened model quasar as a function of redshift. The FIR-detected quasars are redder than the non-detected quasars, but the difference is due to the known different emission line properties of the two sub-samples, not differences in the continuum, which would be expected from dust in the host galaxies.
to create a ‘normalized’ colour. Using the normalized colour, with the redshift dependence removed, creates a distribution that better illustrates departures from the median colour of a quasar at any redshift.
The results are shown in Fig.3. The FIR-detected quasars indeed appear to be redder than the FIR-undetected sample, with a KS-test showing the probability that the two distributions are from the same underlying sample is 10−14. However, upon closer examination,
the bulk of the offset arises from the known differences in the CIVemission line properties between the two sub-samples. From
Richards et al. (2011), large C IVblueshifts are accompanied by
smaller CIVequivalent width. As the CIVemission line enters the
SDSSgband atz∼2, theg−rcolours for FIR-detected quasars are not as blue as those for the FIR-undetected sub-sample. The difference in theg−rdistribution disappears when the different CIVemission line properties are accounted for by using a version of
the Maddox et al. (2008) model with altered emission line strengths. The KS-test probability goes from 10−14 to 0.03, and we are no
longer able to say that the underlying distributions are significantly different. The lack of obvious signs of excess dust obscuration in the FIR-detected quasar host galaxies is consistent with the finding in Richards et al. (2003,2011) that quasars with large CIVblueshifts are less likely to have red continua.
4 D I S C U S S I O N
The FIR fluxes for quasars at a given redshift and optical luminosity range from>5σ detections to non-detections. Potential sources of the exceptional emission in the FIR-bright quasars are dust heated from galaxy-wide SF, dust heated by the AGNs, or most likely, some combination of the two. At low redshifts, the 250µm flux is a relatively uncontaminated measure of the cool dust heated solely by SF. However, at the redshifts probed here, 250µm corresponds to rest frame 83, 62 and 50µm for objects atz=2, 3, 4 and SED modelling has shown that the contribution to these wavelengths from dust in the nuclear torus heated by the AGNs is substantial (Hatziminaoglou et al.2010; Podigachoski et al.2015).
Dust within the host galaxy heated by the quasar itself is also a possible source of the FIR emission. Symeonidis et al. (2016) make a case for AGN-heated dust being the primary source of FIR emission at low redshift via SED decomposition, and find the result holds for higher redshift, more luminous sources (Symeonidis 2017). The nuclear outflows observed for the sample of objects presented here may facilitate this heating by enabling the quasar radiation to reach further into the host galaxy and interacting with more dust. Full SED decomposition is required to determine the relative contributions of SF-heated dust and AGN-heated dust, as they may have different temperatures, which we defer to further work.
A connection between AGN-driven nuclear outflows and galaxy-scale gas content is consistent within the framework of AGN feed-back. Simulations from Hopkins & Elvis (2010) show that it is indeed possible for an AGN outflow to affect gas in the quasar host galaxies at appreciable (kiloparsec) distances from the nucleus. These simulations were performed in the context of an evolution-ary sequence, where a gas-rich major merger triggers a heavily dust-obscured starburst, observed as a ULIRG-type object, accom-panied by obscured black hole accretion. The radiation pressure from AGN accretion is then responsible for clearing out the gas and dust, quenching the SF via nuclear outflows, and revealing an unobscured, broad-line quasar. The time-scale for this is relatively short, of the order of 100 Myr.
We find that our FIR-bright quasars show no indication of redder colours with respect to the FIR-faint population. However, as the quasars were selected at optical–UV wavelengths, the sensitivity of the quasar selection to objects suffering even small amounts of dust reddening is low, thus there is the possibility of a dusty, FIR-bright quasar population excluded from the current sample. Work by Ishibashi & Fabian (2016) shows that a dusty interstellar medium facilitates effective feedback by assisting a radiative wind to exert pressure on the medium and ultimately expel it from the galaxy. Within this context, the heavily dust-reddened objects uncovered in Banerji et al. (2012,2015) and would be extreme examples of these objects.
Recent work by Coatman et al. (2016,2017) show that quasars with CIVblueshifts>1000 km s−1have overestimated black hole
masses (MBH) when directly derived from the shape of the CIV
emission line, by a factor of 5 for blueshifts of 3000 km s−1, and as
much as an order of magnitude in the most extreme cases. There-fore, for a given luminosity, the Eddington luminosity ratio,L/LEdd,
is substantially higher for the high-blueshift objects, resulting in stronger nuclear winds. From Fig. 2, it is around 1000 km s−1
where the strongest discrepancy between the blueshift values for the FIR-detected and FIR-undetected samples diverges. Simulations predict that high Eddington ratio accretion is relatively short-lived (Hopkins & Elvis2010). In addition, since theMBHis
undermas-sive, and active accretion indicates rapid black hole growth, we may be witnessing an early, mass-building phase.
Coatman et al. (2016) also suggest that the high CIVblueshift
quasars is the parent population from which BALQSOs are drawn. Crossmatching our full sample of 4667 quasars to the SDSS DR6 BALQSO catalogue of Allen et al. (2011), and the BALQSO clas-sifications for SDSS DR12 quasars from Pˆaris et al. (2017), we find 284 radio-quiet matches, of which 81 are 2σ FIR detections, or 28±3.2 per cent. For a sample of non-BALQSOs matched in redshift andi-band magnitude, the FIR-detected fraction is 23± 2.8 per cent. This only includes high-ionization CIVBALQSOs
(Hi-BALs), not low-ionization BALQSOs (LoBALs) or FeLoBALs, all of which are known to have redder colours than the general quasar population (Reichard et al.2003). The numbers are small, but it does indicate that BALQSOs are at least as likely to be FIR-luminous as non-BALQSOs, and possibly even more likely, in contrast to the result from Cao Orjales et al. (2012). In special circumstances, the distance to the absorbing material, and thus the mass of the ma-terial and energy of the outflow, can be estimated, and it is found that the energy contained within the outflow is sufficient to have an effect on galaxy scales (Moe et al.2009; Capellupo et al.2014). The outflows with distance estimates put the absorbing material at kiloparsec-scale distances, far beyond the immediate black hole neighbourhood, consistent with the radial extent found within sim-ulations.
5 C O N C L U S I O N S
From the large number of quasars contained within the 161 deg2of
DR1 H-ATLAS data, we are able to investigate the properties of the sample while accounting for underlying and observational trends. We find that, for a given optical luminosity, FIR-detected quasars have stronger nuclear outflows, as measured by the blueshift of the CIVemission line, than a luminosity and redshift-matched
FIR-undetected quasar sample. For the same luminosity and redshift-matched samples, the FIR-detected quasars have redder optical colours, but this difference is primarily due to differences in the emission line properties of the two sub-samples.
The temporal coincidence of nuclear outflow signatures, along with strong FIR emission, result in a plausible scenario where we are witnessing the phase where the central AGN is clearing out its environment, and is accompanied either by the tail end of the initial ULIRG-like starburst or the subsequent triggered starburst. Alternatively, the FIR emission could be from dust within the host galaxies heated by the quasar itself.
AC K N OW L E D G E M E N T S
We thank the anonymous referee for helpful comments which im-proved this paper. NM wishes to thank R. Morganti, M. Michalowski and G. De Zotti for useful comments. MB acknowledges funding from the Science and Technology Facilities Council via an Ernest Rutherford Fellowship. PCH acknowledges support from the STFC via a Consolidated Grant to the Institute of Astronomy, Cambridge. LD and SJM acknowledge funding from the European Research Council Advanced Investigator grant, COSMICISM and also from the ERC consolidator grant CosmicDust. TheHerschel-ATLAS is a project with Herschel, which is an ESA space observatory with science instruments provided by European-led Principal Investiga-tor consortia and with important participation from NASA. The H-ATLAS website ishttp://www.h-atlas.org/.
Monbukagakusho, the Max Planck Society, and the Higher Ed-ucation Funding Council for England. The SDSS Web Site is http://www.sdss.org/.
Funding for SDSS-III has been provided by the Alfred P. Sloan Foundation, the Participating Institutions, the National Science Foundation, and the US Department of Energy Office of Science. The SDSS-III web site ishttp://www.sdss3.org/.
R E F E R E N C E S
Allen J. T., Hewett P. C., Maddox N., Richards G. T., Belokurov V., 2011, MNRAS, 410, 860
Allen J. T., Hewett P. C., Richardson C. T., Ferland G. J., Baldwin J. A., 2013, MNRAS, 430, 3510
Banerji M., McMahon R. G., Hewett P. C., Alaghband-Zadeh S., Gonzalez-Solares E., Venemans B. P., Hawthorn M. J., 2012, MNRAS, 427, 2275 Banerji M., Alaghband-Zadeh S., Hewett P. C., McMahon R. G., 2015,
MNRAS, 447, 3368
Becker R. H., White R. L., Helfand D. J., 1995, ApJ, 450, 559 Bourne N. et al., 2016, MNRAS, 462, 1714
Bower R. G., Benson A. J., Malbon R., Helly J. C., Frenk C. S., Baugh C. M., Cole S., Lacey C. G., 2006, MNRAS, 370, 645
Brusa M. et al., 2015, MNRAS, 446, 2394 Cao Orjales J. M. et al., 2012, MNRAS, 427, 1209
Capellupo D. M., Hamann F., Barlow T. A., 2014, MNRAS, 444, 1893 Cicone C. et al., 2014, A&A, 562, A21
Coatman L., Hewett P. C., Banerji M., Richards G. T., 2016, MNRAS, 461, 647
Coatman L., Hewett P. C., Banerji M., Richards G. T., Hennawi J. F., Prochaska J. X., 2017, MNRAS, 465, 2120
Denney K. D., Pogge R. W., Assef R. J., Kochanek C. S., Peterson B. M., Vestergaard M., 2013, ApJ, 775, 60
Dunn J. P. et al., 2010, ApJ, 709, 611 Eales S. et al., 2010, PASP, 122, 499 Fabian A. C., 2012, ARA&A, 50, 455 Ferrarese L., Merritt D., 2000, ApJ, 539, L9
Francis P. J., Hewett P. C., Foltz C. B., Chaffee F. H., 1992, ApJ, 398, 476 Gaskell C. M., 1982, ApJ, 263, 79
Griffin M. J. et al., 2010, A&A, 518, L3 Harrison C. M. et al., 2016, MNRAS, 456, 1195 Hatziminaoglou E. et al., 2010, A&A, 518, L33 Hewett P. C., Wild V., 2010, MNRAS, 405, 2302
Hopkins P. F., Elvis M., 2010, MNRAS, 401, 7
Hopkins P. F., Hernquist L., Martini P., Cox T. J., Robertson B., Di Matteo T., Springel V., 2005, ApJ, 625, L71
Hopkins P. F., Hernquist L., Cox T. J., Kereˇs D., 2008, ApJS, 175, 356
Ishibashi W., Fabian A. C., 2016, MNRAS, 463, 1291
Maddox N., Hewett P. C., Warren S. J., Croom S. M., 2008, MNRAS, 386, 1605
Magorrian J. et al., 1998, AJ, 115, 2285
Moe M., Arav N., Bautista M. A., Korista K. T., 2009, ApJ, 706, 525 Morganti R., Tadhunter C. N., Oosterloo T. A., 2005, A&A, 444, L9 Morganti R., Fogasy J., Paragi Z., Oosterloo T., Orienti M., 2013, Science,
341, 1082
Mullaney J. R., Alexander D. M., Fine S., Goulding A. D., Harrison C. M., Hickox R. C., 2013, MNRAS, 433, 622
Murray N., Chiang J., Grossman S. A., Voit G. M., 1995, ApJ, 451, 498 Pˆaris I. et al., 2011, A&A, 530, A50
Pˆaris I. et al., 2014, A&A, 563, A54 Pˆaris I. et al., 2017, A&A, 597, A79 Pilbratt G. L. et al., 2010, A&A, 518, L1 Podigachoski P. et al., 2015, A&A, 575, A80 Poglitsch A. et al., 2010, A&A, 518, L2 Rawlings S., Jarvis M. J., 2004, MNRAS, 355, L9
Reeves J. N., O’Brien P. T., Ward M. J., 2003, ApJ, 593, L65 Reeves J. N. et al., 2009, ApJ, 701, 493
Reichard T. A. et al., 2003, AJ, 126, 2594 Richards G. T. et al., 2003, AJ, 126, 1131 Richards G. T. et al., 2006, AJ, 131, 2766 Richards G. T. et al., 2011, AJ, 141, 167 Schneider D. P. et al., 2010, AJ, 139, 2360 Schweitzer M. et al., 2006, ApJ, 649, 79
Sijacki D., Springel V., Di Matteo T., Hernquist L., 2007, MNRAS, 380, 877
Symeonidis M., 2017, MNRAS, 465, 1401
Symeonidis M., Giblin B. M., Page M. J., Pearson C., Bendo G., Seymour N., Oliver S. J., 2016, MNRAS, 459, 257
Valiante E. et al., 2016, MNRAS, 462, 3146
Weymann R. J., Carswell R. F., Smith M. G., 1981, ARA&A, 19, 41 York D. G. et al., 2000, AJ, 120, 1579