C O M P O S I T E M AT E R I A L S Article
Quantification of mesoscale variability
and geometrical reconstruction
of a textile
Frank Gommer, Louise P Brown and Richard Brooks
Abstract
Automated image analysis of textile surfaces allowed determination and quantification of intrinsic yarn path variabilities in a 2/2 twill weave during the lay-up process. The yarn paths were described in terms of waves and it was found that the frequencies are similar in warp and weft directions and hardly affected by introduced yarn path deformations. The most significant source of fabric variability was introduced during handling before cutting. These resulting systematic deform-ations will need to be considered when designing or analysing a composite component. An automated method for three dimensional reconstruction of the analysed lay-up was implemented in TexGen which will allow virtual testing of com-ponents in the future.
Keywords
Fabrics/textiles, defects, statistical properties/methods, resin transfer moulding, image analysis, geometric reconstruction
Introduction
The properties of a composite component are greatly influenced by the orientation of the fibre reinforce-ment.1Aligning the fibres precisely in the loading dir-ection yields optimal properties. For instance, a deviation of just 2.5 reduces the compressive strength
by10%.2 Weaving fibre bundles into fabrics for easier handling, for example, introduces fibre crimp which reduces the mechanical properties of the reinforce-ments.3 Other textile variabilities such as varying yarn spacing,4,5 yarn path waviness6 and wrinkling7 can also significantly influence subsequent properties. Effects of variability due to randomness of the fila-ment arrangefila-ment within fibre bundles are ignored in this work.8,9
Ignoring these intrinsic variabilities when using a unit cell modelling approach will lead to over- or underestimation of the material behaviour such as stiff-ness or damage.10 During the stacking process add-itional misalignment can be introduced between layers. In the example of stacked plain weave unit cells it was demonstrated numerically and experimen-tally that different configurations of stacking will influence the resulting mechanical properties differ-ently.11,12 Compaction during mould closure and
layer nesting will introduce additional variabilities and ultimately affect subsequent properties of a com-posite component.13
It is known that different types of variability can affect the composite properties, but their characterisa-tion is challenging. Composite variability is usually determined subsequent to manufacture of a component using either conventional optical microscopy of sample surfaces14 or non-destructive microcomputed tomog-raphy.15,16 These data then allow yarn paths to be described in three dimensional space and the path vari-ability to be quantified. The poor image contrast due to low X-ray absorption or the similar atomic structure of the polymer matrices when analysing carbon fibres using microcomputed tomography17 makes automated image processing difficult. Therefore, slices of volume images are often analysed manually by drawing enve-lopes18 or fitting ellipses19 around yarn boundaries. Analysing the image anisotropy it was shown that
Composites Research Group, Faculty of Engineering, University of Nottingham, University Park, Nottingham, UK
Corresponding author:
Frank Gommer, University of Nottingham, University Park, ITRC Bldg. B02, Nottingham, NG7 2RD, UK.
Email: [email protected]
Journal of Composite Materials 0(0) 1–12
!The Author(s) 2015 Reprints and permissions:
automated image analysis is feasible.20,21These test meth-ods are, however, restricted in size and only small samples can be analysed which makes them unsuitable to assess the variability at the component scale.
In this work, the fabric variability in layers of a 2/2 twill weave were determined by automated analysis of optical images taken during the lay-up process on the component scale. There is no need for transmissive light to determine bundle spacing, which necessitates a trans-parent mould tool and is only applicable for the study of a single textile layer.22 The proposed analysis of yarn edge detection is limited to sample surfaces only; however, the limited thickness of the yarns allows out-of-plane paths to be estimated. The implemented image analysis process enabled intrinsic misalignment such as varying in-plane waviness and handling induced shearing, both of which affect the fibre angle, to be quantified. Tedious and time consuming manual determination of bundle edges23,24 is overcome. Automatically analysing edges of visible, small bundle segments in this work allows in-plane bundle waviness and small local width changes to be determined. Methods which fit higher order polynomials to the determined edges of longer bundle lengths25,26 may not capture these small changes. The implemented ana-lysis method of the spatial domain provides detailed information on local yarn path orientations and yarn width changes which cannot be determined when ana-lysing images in the frequency domain, e.g. Fourier analysis of larger images of textile reinforcements.27
The image processing approach in this study does not depend on a known fabric unit cell. This is in con-trast to other techniques proposed in the literature, for example, to determine deformed unit cells in a reinforcement by correlating local Fourier spectra of images to nominal dimensions.28 A similar approach was used to specify the weave repeat in a textile layer, combining spatial and frequency domains of images.29 Another employed a Gabor filter, based on a represen-tative set of fabric unit cells with varying dimensions selected from a textile layer, to determine fabric distor-tions in an image of a textile layer.30 These methods do not, however, allow determination of individual yarn path variabilities and only provide information on deviations from nominal values. Using different illu-mination patterns and analysing bi-directional reflect-ance distributions of carbon fibre bundles, it was possible to determine local yarn orientations in images.31 It was not feasible, however, using this method to determine localised effects such as local yarn spacing variations.
The analysis in this work also made it feasible to reconstruct a geometrical model of the fabric in TexGen.32 Determination of the textile variability for every individual layer after placement in the mould tool
will allow virtual testing of a component with its spe-cific characteristics while it is still being manufactured.
Materials and data acquisition
Materials and manufacture
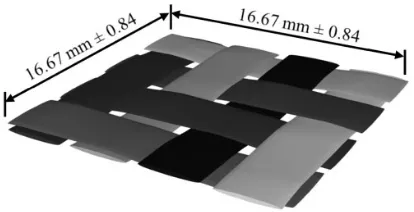
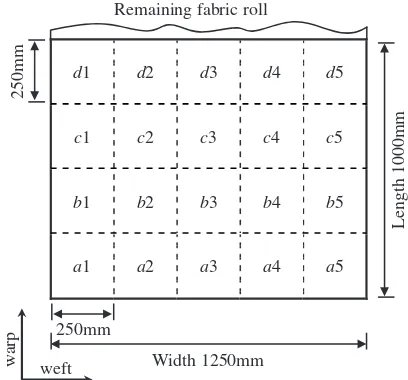
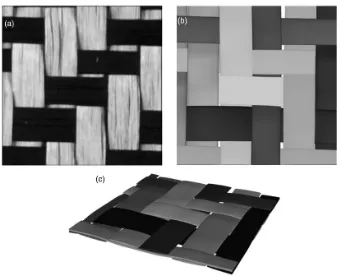
The geometric variability within a carbon fibre 2/2 twill weave (Figure 1) was studied. In total, 20 fabric sam-ples were cut from a fabric roll and analysed after placement in a rectangular mould tool with dimensions of 250 mm250 mm2 mm. The nominal yarn direc-tions were oriented parallel to the mould tool edges with warp and weft directions being kept constant between different layers. The positions and orientations of the layers cut from the fabric were recorded and controlled throughout the experiments (Figure 2). Distortion of the cut fabric samples during handling and placement in the mould tool was minimised as far as possible. After mould closure, the lay-up contain-ing five layers was impregnated with an epoxy resin by vacuum pressure driven resin transfer moulding.
Image acquisition
[image:2.595.312.519.556.662.2]Available analysis techniques, such as microcomputed tomography, allow visualisation of the internal struc-ture of textile reinforcements. These studies are, how-ever, restricted to small areas15and are applicable only after completion of manufacture of the part. Optical images of the surface of every reinforcement layer were captured immediately after placement in the mould tool. This allowed determination of fabric dis-tortions and quantification of the degree of intrinsic misalignment during the composite manufacturing process. A specialised transparent mould tool for image acquisition is not required.22 The images of the fabric were taken using a standard SLR camera
Figure 1. Idealised unit cell, created using the open source software TexGen (http://texgen.sourceforge.net), of the 2/2 twill weave fabric (Product TC4111250) supplied by Sigmatex
Ltd. Areal density,Af¼380 g/m2, Warp and weft yarns:
(Sony DSLR-A200) equipped with a N50 lens. Using an inexpensive conventional camera rather than a scanner25 will allow extension of the image acquisition method to the general three-dimensional case in the future. To achieve a sufficiently high image resolution, six overlap-ping images were taken at a high magnification using a positioning frame.33The average resulting pixel size was determined to be 0.04 mm. The lens distortions were determined prior to the test and the individual images were adjusted accordingly.34The camera was positioned perpendicular to the flat mould tool. Possible misalign-ments due to unintentional camera rotations and transla-tions were corrected before the images were tiled35 and cropped to the cavity size (Figure 3). The use of direc-tional lighting from the sides increased the contrast between horizontal and vertical yarns, thus improving the subsequent image analysis.
Image analysis
The fabric mesostructure was determined automatically by a morphological analysis technique (Appendix) implemented in a purpose developed Matlab pro-gram.33 This image analysis method is based on the determination of colour gradients36of visible individual yarn sections. Of course this method requires that neighbouring yarns can be differentiated. Yarn variabil-ities such as local bundle widths and orientations can be measured in a time efficient manner. The analysis time for each yarn section (Figure 4) was estimated to be about 0.1 s on a standard desktop computer.
Initially, approximate centre positions of all bundle sections were determined by simple thresholding of the original image. A predefined stencil, larger than the
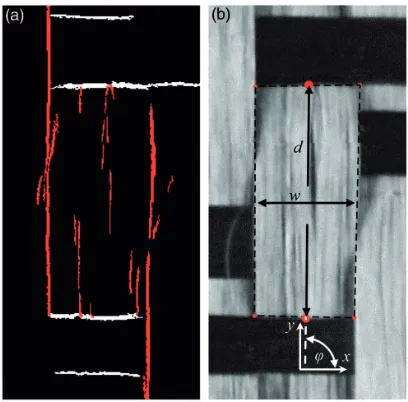
expected maximum bundle section dimension, was centred on each of these positions and subsequently local image analysis was performed. Horizontal and vertical edges were determined separately (Figure 4(a)) from the thresholded morphological reconstruc-tion of the original image. Rules were defined to iden-tify which edges in the image belong to the outline of a visible yarn section based on combined edge lengths and relative positions. A four sided polygon was then fitted to the selected edges (Figure 4(b)) which was con-sidered to be a sufficiently good approximation of the shape of individual yarn sections. All bundle outlines were checked and the possibility of manual reselection of bundle outlines was implemented. The error as a result of the image processing was estimated to be approximately1 pixel.
As a result, data such as the height, width and orien-tation of a bundle section as well as the relative position within the layer were obtained. Connecting adjacent bundle sections in the direction of the bundle path enabled the reconstruction of entire fibre bundles. Assuming continuity of the yarns, hidden bundle sec-tions were approximated by a linear fit between visible sections.
Fabric mesoscale variability in single layers
Yarn width variability
The average bundle section widths in the warp and weft directions are significantly different, despite the same type of yarn being used (Figure 5). The distribution of bundle segments in warp direction follow a bell shaped curve with a mean of 3.89 mm. The weft yarns show a right tailed distribution with a mean of 3.14 mm. The upper and lower limits of the bundle width distributions are, however, similar for both directions.
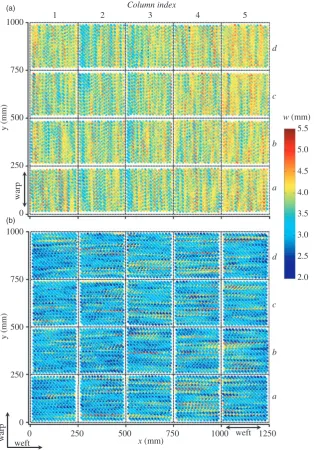
If the relative position of the bundle sections in the mould tool is combined with the known position of the layer in the original fabric roll, it is possible to visualise the bundle width change as a function of the yarn pos-ition (Figure 6). The gaps between different layers are a result of the image processing where yarn sections at the boundaries are ignored. In addition, the edge of the cut fabric layers can fray during handling. The differ-ences in width between warp and weft yarns are clearly visible (Figure 6(a) and (b)). The tail present in the width distribution of weft yarns (Figure 5(b)) is a result of a few wide yarns and may be caused by the weaving process.
Yarn orientation
Similar to the local yarn width (Figure 6), the orienta-tions of individual yarn secorienta-tions with respect to the
d1 d2 d3 d4 d5
c1 c2 c3 c4 c5
b1 b2 b3 b4 b5
a1 a2 a3 a4 a5
250mm
weft
wa
rp
Remaining fabric roll
250mm
Width 1250mm
Le
n
g
[image:3.595.78.282.503.693.2]th 1000mm
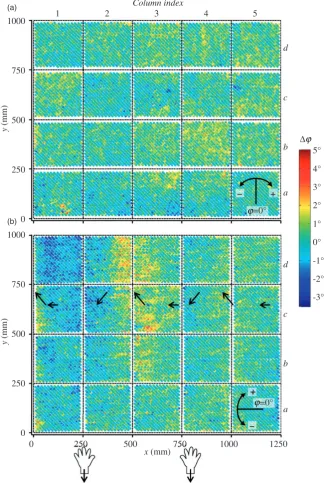
mould tool were determined and plotted at the correspond-ing positions in the original textile sample (Figure 7). As care was taken to minimise the distortion during handling, the local bundle orientations correlate between adjacent layers. This is especially noticeable for the orientations of weft yarns (Figure 7(b)).
[image:4.595.131.453.70.403.2]The fabric was first unwound by about one revolu-tion and then pulled manually from the roll. Before cutting, the fabric was aligned on the cutting table. The orientations of weft yarn sections in the bottom row (row a) of cut layers therefore exhibit similar orien-tations. Advancing further into the fabric (rows b–d) an area of strong positive orientation of the weft bundle sections in the fabric centre (columns 2–3) develops. In addition, a distinct area of strong negative orientations to the left (columns 1–2) and a small area of slightly negative orientations to the right (columns 3–4) of the strong positive orientation is visible. These areas of negative orientation of the weft yarn sections corres-pond to the pulling direction, being formed where hands are positioned as they pull the fabric off the roll. The area of strong positive orientation is
Figure 3. Tiled and cropped image of a 2/2 twill weave (layer a3 in Figure 2). The contrast of warp and weft yarns is increased by use of directional lighting form the sides. Estimated centre lines for selected warp and weft yarns are indicated. The inset shows a local magnification and the determined bundle section outlines and yarn centre paths after image analysis.
Figure 4. (a) Determined horizontal and vertical edges of a yarn section. (b) A four sided polygon is fitted through selected edges and
displayed on the original image. The width,w, the distance between
[image:4.595.65.269.472.673.2]1000
750
500
250
0
y (mm
)
1000
750
500
250
0
0 250 500 750 1000 1250
x (mm)
5.5
5.0
4.5
4.0
3.5
3.0
2.5
2.0
w (mm)
d
c
b
a
d
c
b
a
1 2 3 4 5
Column index
y (mm)
weft
warp
warp
weft
(a)
[image:5.595.140.473.68.213.2](b)
Figure 6. Measured (a) warp and (b) weft yarn width,w, in single fabric layers (250 mm250 mm) after placement in the mould tool in respect to the position cut from the fabric roll. Every point corresponds to a yarn segment.
0 1.2
0.4 0.8 1.4
1.0
0.6
0.2
P
robabil
ity density
2.0 4.0 2.5 4.5 3.0 3.5 5.0 5.5
wweft (mm) wwarp (mm)
2.0 4.0 2.5 4.5 3.0 3.5 5.0 5.5
wweft= 3.14 ± 0.47 wwarp = 3.89 ± 0.38
[image:5.595.148.463.273.724.2](a) (b)
developed as a result of this pulling process in between the points where force was applied.
The more distinct area of small positive weft yarn orientations to the right of the fabric (columns 4–5) is probably also caused by this unwinding process. This area is less distinct than the one in the centre as the pulling force is located more towards the left of the fabric. The small areas of strong positive weft yarn
orientations at the left edge of the fabric are probably caused by the presence of the stitch yarn, stabilising the fabric at the sides and resisting the pulling force. The deviations in yarn orientation at the edge of the indi-vidual layers may also be formed by the handling of the fabric after placement in the mould tool. The data in Figure 7 suggest, however, that the largest amount of yarn misalignment in the analysed fabric is caused by
1000
750
500
250
0 1000
750
500
250
0
y
(mm)
0 250 500 750 1000 1250
x (mm)
Δ 5°
4°
3°
2°
1°
0°
-1°
-2°
-3° +
−
=0°
−
+
=0°
d
c
b
a
d
c
b
a
1 2 3 4 5
Column index
y
(mm)
j
j
j (a)
[image:6.595.124.453.200.684.2](b)
the unwinding process. The handling after cutting and placement in the mould tool may have only caused minor distortions.
As a result of the fabric deformation before cutting, the individual layers exhibit different types of misalign-ment after placemisalign-ment in the mould tool. Layersc2 and d2, for example, have strongly curved weft bundles. Combining the information from the warp and weft yarn orientations it is possible to identify the fabric shear present in, for example, layersd1 andb4. All of these deformations will affect the subsequent properties of the composite and may influence these differently depending on their combination in a lay-up.
Yarn waviness
Contrary to the common assumption in geometric rep-resentations of a weave the yarn paths are not straight, due to the weaving process, storage or deformation of the fabric. The changes in a yarn path can be described in terms of a harmonic signal (in terms of sine and cosine functions). Such wave functions have, for exam-ple, been used to describe paths of individual filaments in fibre bundles37 or to describe the yarn waviness induced by the weaving process14 when analysing micrographs. The description of waviness in this way is beneficial when employing analytical solutions to determine composite properties38 or to generate input for numerical models.4 In this work, coordinate pos-itions along the longitudinal yarn axis are treated as being equivalent to a time signal and the change in
position transverse to the yarn as an amplitude. This enables the use of the discrete Fourier transform (DFT) to determine the frequency, amplitude and phase shift of a yarn path.
From the analysed fabric samples, approximately 13 yarn sections were determined over the length of a yarn (Figure 3). For each yarn section, the midpoints on the short edges were used as input (Figure 4). This resulted in an average sampling frequency (number of samples per metre) of 130. The average spacing between differ-ent samples is about 8 mm, which determines the max-imum frequency resolution of the analysis.
The determined positions along the yarn path,N, are not equally spaced as required by the DFT and small variations are therefore corrected by piecewise polyno-mial interpolation. The transverse coordinate positions are subtracted by the respective mean position of the yarn to normalise the data and are used as amplitudes (Figure 8(a)). To adjust for the influence of possible fabric shear on the analysis of the yarn waviness, all yarn data are rotated by the mean angle with respect to the mould tool before analysis.
2 4 6 8 10 12 0.0 0.2 0.4 0.6 0.8 1.0 1.2 -4.0 -3.0 -2.0 -1.0 0.0 1.0 2.0 3.0 4.0 > 1000 750 500 250
0 y (mm)
Frequency (cycles / m)
Amplit ude (mm) Phase shi ft (mm )
a2 b2 c2 d2
[image:7.595.325.524.365.664.2]Layer: 2 pixel accuracy threshold (a) (b) (c)
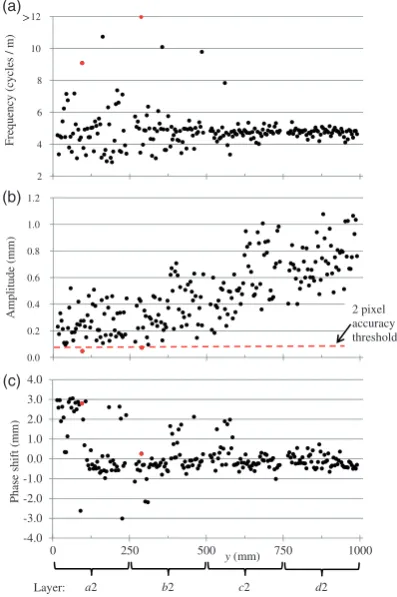
Figure 9. Main frequency amplitude and phase shift for all 271
weft yarn paths in the layers of column 2 in Figure 7B (x¼250–
500 mm). The analysed yarn lengths are approximately 200 mm. Data points in red have amplitudes lower than the image pro-cessing accuracy of 2 pixels (1 pixel).
0 1000 2000 3000 4000 5000 Bins
Sample
0 5 10 15 20 25 30
Amplit ude (mm) 1.0 0.6 0.2 -0.2 -0.6 -1.0 0
Magnitude 3
[image:7.595.77.284.480.664.2]6 5 4 2 1 0 (a) (b)
The DFT returns bins and magnitudes, which cor-respond to wave frequencies and amplitudes, respect-ively (Figure 8(b)). The bin numbers from 0 toN/21 correspond to the number of oscillations of the waves. Because the fibre bundles do not follow a perfect wave form or have an integer number of cycles, no single peaks are visible but rather large lobes. This effect is known as spectral spreading. The bin position of the maximum magnitude value of all lobes of a yarn cor-responds to the main frequency. In order to better determine the peak positions of the main lobes, the initial input data are padded with a large number of zeros (10,000 were chosen) which increases the number of frequencies the DFT is able to fit (increase inN). It was refrained from using a window function39to adjust for the discontinuity of the signal before zero padding because of the limited number of data points, as this reduces the frequency resolution.
Individual yarn path waviness. The weft yarn waviness par-ameters of the determined harmonic functions for a cross-section of the fabric (column 2 in Figure 7(b)) are shown in Figure 9. The data points reflect the determined main frequencies only and possible smaller frequencies are ignored and probably smaller than the accuracy of the image processing. The minimum accuracy of the
amplitude is estimated to be approximately 0.08 mm which is equivalent to a 2 pixel deviation (1 pixel). Data points marked in red are not significant as their determined yarn path deviations are below this limit.
The scatter in weft yarn frequency reduces (Figure 9(a)) with an increase in deformation. This increase in deformation is also visible as an increase of amplitude (Figure 9(b)). The average frequency does, however, remain fairly constant and changes from 4.881.57 cycles/m to 4.740.26 cycles/m (layersa2 tod2) only. This corresponds to a wavelength of about 205–211 mm which is similar to the fabric sample size and also to the roll diameter of 203 mm at which the corresponding piece of textile was stored.
[image:8.595.122.462.419.696.2]The average weft yarn frequencies for the different layers in Figure 7(b) range from 4.20 cycles/m to 5.36 cycles /m which corresponds to an average wave-length of 204 mm. If the yarn paths are described in terms of autocorrelation, it is expected that this will be insignificant after the inflection point of ¼ of the wavelength. This is approximately after 3 unit cell lengths for the analysed fabric. This is of the same order as reported weft yarn autocorrelation lengths of 4.6 unit cells for a 6K24and 3–4 unit cells for a 12 K 2/2 twill weave.18The sample size in these studies was simi-lar to that used in this work; however, the very limited
number of samples in these studies may not allow a generalisation of the trend.
The determined average warp yarn wavelength (Figure 7(a)) in this work was 203 mm (4.91 cycles/m) and is simi-lar to the weft yarn frequency. The lower and upper limits of the average fabric layer wavelengths are 3.56 cycles/m and 6.62 cycles/m, respectively. The average amplitude of 0.19 mm in this case is however rather small. The more tightly packed warp yarns (Figure 3) do therefore appear more straight and uniform than the weft yarns. The reported autocorrelations for the warp yarns in other twill weaves were about the same18 or twice as large as the weft yarn autocorrelation.24The data for the ¼ warp wavelength in this work does lie in between these two studies. As the warp yarns in the fabric used are fairly closely packed and the gaps between yarns are small, the observed value is closer to the tighter weave.18
Correlations between neighbouring yarns. The cross-correla-tion between yarns may be a funccross-correla-tion of the weave density.18The tighter the weave, the more the distortion of one yarn influences neighbouring ones. The phase shift between the main frequencies of yarns can be used as a measure of cross-correlations. The weft yarn phase shift seems to be largely constant for the exam-ples shown in Figure 9(c) (625–1000 mm) which is in the area of large yarn path deviation (samplesc2 andd2 in Figure 7(b)). The yarn path deviations are pronounced enough for the neighbouring yarns to be affected. This leads to a largely constant phase shift between neigh-bouring yarns.
Scatter in phase shift is visible in the range of 0– 625 mm (Figure 9(c)). This suggests that individual yarns may not necessarily influence neighbouring yarn paths due to larger spacing or smaller local deformations. The average cross-correlations between yarns of a tight weave are therefore very large18or about the length of a single unit cell for a less tight weave.24It should be noted that even on the small number of samples scatter was observed, depending on the location of the yarns. Analysing a larger number of samples in this work it was found, however, that a single cross-correlation or a correlation distribution is not applicable for the entire fabric but that this depends on the position and amount of local deformation in a fabric. The maximum difference in phase shift is, however, bound as a result of yarns being interwoven and of the stiffness of the bundles which will only allow a certain amount of waviness.
Geometric reconstruction
of a textile layer
The image analysis data can be used to reconstruct the geometry of a textile layer. Alternatively, the measured data may be used to create statistically equivalent yarn
arrangements as input for a numerical model. For the reconstruction of the three-dimensional geometry in Figure 10, the intersection points of the yarn centre lines are calculated from the analysed images giving a set ofxandy coordinates. Two nodes are specified at each of these intersection points with z coordinates being specified as one quarter of the average weave thickness,t¼0.6 mm, from the weave mid-plane. These nodes are used to create yarn paths in TexGen. An elliptical cross-section is specified at each node using the widths extracted from the image data, thus enabling the variation in both yarn path and width to be mod-elled accurately. The local height, h, of the assumed elliptical yarn cross-sections was estimated based on a determined empirical relation to the widths,w, for the analysed textile following:h¼ 0.0342wþ0.3511.
Small intersections were present in the model between some of the adjacent parallel yarns, possibly due to the limits in image processing accuracy. An intersection correction algorithm was added to TexGen to eliminate these yarn intersections and will be available with the next release (http://texgen.-sourceforge.net). The width of each intersecting yarn is reduced by half of the amount of the intersection and the cross-section nodes are moved by one quarter to preserve opposite yarn edges. In addition, refine-ment options are available which will rotate yarn cross-sections and ensure that interwoven yarns are not intersecting in the geometrical model. The result-ing TexGen model is in good agreement with the input data (Figure 10(a) and (b)). In order to take bundle shape changes into account when compacting the fabric in a mould tool,40 the generated TexGen model of the uncompacted fabrics can then, for exam-ple, be used in compaction models to predict bundle deformations.41,42
Concluding remarks
The image analysis implemented in this work enabled local yarn variabilities of a balanced twill weave fabric after placement in the mould tool to be quantified. A significant difference in warp and weft yarn widths was observed which will have a strong influence on subse-quent processing properties such as permeability. For example, knowledge of these details during the manu-facturing process will enable injection strategies to be improved.
certain roll diameter. However, as the frequencies are similar in warp and weft direction, the yarn waviness is probably already introduced during yarn manufacture, when the yarns are tightly wound and stored on bob-bins before further processing. This will introduce a permanent curvature which is not eliminated by the yarn tension during the weaving process.
Yarn path deformations were found not to change the main wave frequencies significantly but increase their amp-litudes. This may, however, be related to the type of deformation and can be different for others. The majority of fabric deformation was related to handling of the mater-ial before cutting which introduced local yarn path deform-ations. Fabric layers are therefore not necessarily random but may exhibit correlated yarn paths, depending on their relative positions before being cut from a continuous textile sheet. When layers are combined with the same nominal yarn orientation but with distorted yarn paths in opposite directions locally, this will lead to local stress concentra-tions in the finished part. For the numerical analysis of a lay-up, the combinations of layers depending on their ini-tial positions in the fabric need to be considered. This will improve the model accuracy by incorporating systematic fabric deformations which may be introduced during the handling process in addition to random variabilities.
The determined in-plane yarn waviness was found to have a similar magnitude compared to the out-of-plane waviness introduced when interlacing the yarns. From the reconstructed textile geometry in TexGen, a max-imum out-of-plane misalignment in the fabric thickness direction of about6was found. Whereas the
out-of-plane misalignment is a localised effect, intrinsic to the weaving process, the measured in-plane waviness will affect the entire lay-up. These two types of misalign-ment may, however, affect the composite properties dif-ferently. For example, the localised out-of-plane yarn crimp will result in local stress concentrations whereas the in-plane yarn waviness is thought to have a stronger effect on the inter-laminar shear properties.
The fabric variability measurements in this work were obtained during the lay-up process. The imple-mented transfer of data from image processing to a geometrical textile model will, in the future, allow vir-tual testing of a component with its specific intrinsic variabilities before the part is actually produced.
Declaration of conflicts of interest
The author(s) declared no potential conflicts of interest with respect to the research, authorship, and/or publication of this article.
Funding
The author(s) disclosed receipt of the following financial sup-port for the research, authorship, and/or publication of this article: This work was supported by the Engineering and
Physical Sciences Research Council (grant number: EP/ IO33513/1), through the EPSRC Centre for Innovative Manufacturing in Composites (CIMComp) and by an EPSRC Doctoral Prize award hosted by the University of Nottingham.
References
1. Jones RM.Mechanics of composite materials. New York: Hemisphere Publishing Corporation, 1975.
2. Mrse A and Piggott M. Compressive properties of uni-directional carbon fibre laminates: II. The effects of unin-tentional and inunin-tentional fibre misalignments. Compos Sci Technol1993; 46: 219–227.
3. Pollock PB. Tensile failure in 2-D carbon-carbon com-posites.Carbon1990; 28: 717–732.
4. Endruweit A and Long AC. Influence of stochastic vari-ations in the fibre spacing on the permeability of bi-direc-tional textile fabrics. Composites Part A 2006; 37: 679–694.
5. Lundstro¨m TS. The permeability of non-crimp stitched fabrics.Composites Part A2000; 31: 1345–1353. 6. Wisnom MR and Atkinson JW. Fibre waviness
gener-ation and measurement and its effect on compressive strength.J Reinf Plast Comp2000; 19: 96–110.
7. Potter K, Langer C, Hodgkiss B, et al. Sources of vari-ability in uncured aerospace grade unidirectional carbon fibre epoxy preimpregnate.Composites Part A 2007; 38: 905–916.
8. Rohatgi V, Patel N and Lee LJ. Experimental investiga-tion of flow-induced microvoids during impregnainvestiga-tion of unidirectional stitched fiberglass mat. Polym Compos 1996; 17: 161–170.
9. Gommer F, Wedgwood KCA and Brown LP. Stochastic reconstruction of filament paths in fibre bundles based on two-dimensional input data.Composites Part A2015; 76: 262–271.
10. Trias D, Costa J, Mayugo JA, et al. Random models versus periodic models for fibre reinforced composites. Comput Mater Sci2006; 38: 316–324.
11. Ito M and Chou T-W. An analytical and experimental study of strength and failure behavior of plain weave composites.J Compos Mater1998; 32: 2–30.
12. Woo K and Whitcomb JD. Effects of fiber tow misalign-ment on the engineering properties of plain weave textile composites.Compos Struct1997; 37: 343–355.
13. Hoes K, Dinescu D, Sol H, et al. Study of nesting induced scatter of permeability values in layered reinforcement fabrics.Composites Part A2004; 35: 1407–1418. 14. Yurgartis SW and Morey K. Measurement of yarn shape
and nesting in plain-weave composites. Compos Sci Technol1993; 46: 39–50.
15. Badel P, Vidal-Salle´ E, Maire E, et al. Simulation and tomography analysis of textile composite reinforcement deformation at the mesoscopic scale.Compos Sci Technol 2008; 68: 2433–2440.
17. Spanne P, Raven C, Snigireva I, et al. In-line holography and phase-contrast microtomography with high energy x-rays.Phys Med Biol1999; 44: 741.
18. Matveev MY, Long AC and Jones IA. Stochastic model-ling of the effect of yarn path and layer shift variability on stiffness and strength of textile composites. In: 16th European Conference on Composite Materials (ECCM16), Seville, Spain, 2014.
19. Vanaerschot A, Cox BN, Lomov SV, et al. Stochastic framework for quantifying the geometrical variability of laminated textile composites using micro-computed tom-ography.Composites Part A2013; 44: 122–131.
20. Naouar N, Vidal-Salle´ E, Schneider J, et al. Meso-scale FE analyses of textile composite reinforcement deform-ation based on X-ray computed tomography. Compos Struct2014; 116: 165–176.
21. Straumit I, Lomov SV and Wevers M. Quantification of the internal structure and automatic generation of voxel models of textile composites from X-ray computed tom-ography data.Composites Part A2015; 69: 150–158. 22. Lim J and Kim S. Analysis of woven fabric structure
using image analysis and artificial intelligence. Fibers Polym2011; 12: 1062–1068.
23. Abdiwi F, Harrison P, Koyama I, et al. Characterising and modelling variability of tow orientation in engineer-ing fabrics and textile composites. Compos Sci Technol 2012; 72: 1034–1041.
24. Vanaerschot A, Cox BN, Lomov SV, et al. Simulation of the cross-correlated positions of in-plane tow centroids in textile composites based on experimental data. Compos Struct2014; 116: 75–83.
25. Swery EE, Kelly P, Sharma R, et al. Automated geomet-ric characterisation of woven reinfocing textiles using image analysis techniques. In: 34th Risø International Symposium on Materials Science, Risø, Denmark, 2013. 26. Swery EE, Allen T and Kelly P. Automated tool to
deter-mine geometric measurements of woven textiles using digital image analysis techniques. Text Res J. Epub ahead of print 15 July 2015. DOI: 10.1177/ 0040517515595031.
27. Lomov SV, Verpoest I, Cichosz J, et al. Meso-level textile composites simulations: open data exchange and script-ing.J Compos Mater2014; 48: 621–637.
28. Skordos AA and Sutcliffe MPF. Stochastic simulation of woven composites forming.Compos Sci Technol2008; 68: 283–296.
29. Rallo´ M, Escofet J and Milla´n MS. Weave-repeat identi-fication by structural analysis of fabric images.Appl Opt 2003; 42: 3361–3372.
30. Zhu Q, Wu M, Li J, et al. Fabric defect detection via small scale over-complete basis set.Text Res J2014; 84: 1634–1649.
31. Zambal S, Palfinger W, Sto¨ger M, et al. Accurate fibre orientation measurement for carbon fibre surfaces. Pattern Recognit 2015; 48(11): 3324–3332.
32. Long AC and Brown LP. Modelling the geometry of tex-tile reinforcements for composites: TexGen. In: Boisse P (ed.)Composite reinforcements for optimum performance. Cambridge: Woodhead Publishing Ltd., 2011.
33. Gommer F, Brooks R. Determination of manufacture induced variablity and prediction of the resulting mech-anical properties of a composite. In: 16th European Conference on Composite Materials (ECCM16), Seville, Spain, 2014.
34. California Institute of Technology. Camera Calibration Toolbox for Matlab. www.caltech.edu (accessed 10 October 2013).
35. The´venaz P. MosaicJ. http://bigwww.epfl.ch/thevenaz/ mosaicj/ (accessed 25 March 2014).
36. Russ JC.The image processing handbook, 5th ed. Broken Sound Parkway, NW: CRC Press, 2007.
37. Mansfield EH, Purslow FRS and Purslow D. The influence of fibre waviness on the moduli of unidirec-tional fibre reinforced composites. RAE Technical Report, 1974.
38. Paluch B. Analysis of geometric imperfections affecting the fibers in unidirectional composites.J Compos Mater 1996; 30: 454–485.
39. Sundararajan D. The discrete fourier transform: theory, algorithms and applications. Singapore: World Scientific, 2001.
40. Gommer F, Endruweit A and Long AC. Analysis of fila-ment arrangefila-ments and generation of statistically equiva-lent composite micro-structures. Compos Sci Technol 2014; 99: 45–51.
41. Potluri P and Sagar TV. Compaction modelling of textile preforms for composite structures.Compos Struct 2008; 86: 177–185.
42. El Said B, Green S and Hallett SR. Kinematic modelling of 3D woven fabric deformation for structural scale fea-tures.Composites Part A2014; 57: 95–107.
Appendix 1
Image processing
The MatlabÕ functions and parameters used for the
image analysis and edge selection criteria used are out-lined below. It should be kept in mind that other images may require a different set of functions, image prepara-tion or parameters.
Analysis of individual yarn sections
Local images, large enough to contain entire visible yarn sections, are extracted from the tiled images based on approximate, predetermined, centre points. On these images, I, aligned so that the yarn path is vertical, the edges of the visible yarn sections are determined.
2. Determine the horizontal and vertical colour gradi-ents which correspond to visible yarn edges: Gx,
Gy.¼imgradientxy(I, ‘Sobel’);
3. Binarise the determined gradient image Gx andGy
using the function graythresh.
Determine edges perpendicular to the yarn path
Using the gradient image with edges primarily oriented perpendicular to the yarn direction,Gy, it is possible to
determine the yarn section ends, e.g. when a yarn inter-laces with a neighbouring yarn and is not visible any longer.
4. Remove small objects (edges) smaller than 30 pixels.
5. Select only objects with a primarily horizontal orientation based on the number of rows and col-umns occupied inGy.
6. Only keep two objects, located above and below, which are closest to the centre point.
Determine edges parallel to the yarn path
Whereas edges perpendicular to the direction of the yarns (filaments) are determined easily, the image pro-cessing can result in additional edges parallel to the yarn paths which need to be filtered separately. Therefore following step 4 forGx:
7. Fit straight lines through each object in the form of
x¼myþb.
8. Match lines segments which belong to each other by:
– Match lines which have slopes within a selected tolerance of m0.03 and intercepts with b3.5 pixels.
– Line segments, which have matching centre coordinates of x3 pixels, are considered to belong to the same edge.
– Lines which have similar slopes m0.05 but which are separated by a large distance100 pixels, between their start and end points may be connected, e.g. start and end of a yarn seg-ment edge; however, only if the absolute slope values are less than 0.05.
– However, lines (objects) which overlap (parallel edges) are not matched.
9. Select two longest (cumulative) objects to the left and right of the centre points based on the line length. Any object longer than 140 pixels are con-sidered to be equally important. Note, the actual objects are selected and not the fitted lines.
Determine four sided polygons
10. False detections can be corrected manually if required, e.g. select edges.