The ATLAS
3D
Project – XXX. Star formation histories and stellar
population scaling relations of early-type galaxies
Richard M. McDermid,
1,2‹Katherine Alatalo,
3Leo Blitz,
4Fr´ed´eric Bournaud,
5Martin Bureau,
6Michele Cappellari,
6Alison F. Crocker,
7Roger L. Davies,
6Timothy A. Davis,
8P. T. de Zeeuw,
9,10Pierre-Alain Duc,
5Eric Emsellem,
9,11Sadegh Khochfar,
12Davor Krajnovi´c,
13Harald Kuntschner,
9Raffaella Morganti,
14,15Thorsten Naab,
16Tom Oosterloo,
14,15Marc Sarzi,
16Nicholas Scott,
17Paolo Serra,
14,18Anne-Marie Weijmans
19and Lisa M. Young
20,21Affiliations are listed at the end of the paper
Accepted 2015 January 15. Received 2015 January 15; in original form 2014 October 14
A B S T R A C T
We present the stellar population content of early-type galaxies from the ATLAS3Dsurvey.
Using spectra integrated within apertures covering up to one effective radius, we apply two methods: one based on measuring line-strength indices and applying single stellar population (SSP) models to derive SSP-equivalent values of stellar age, metallicity, and alpha enhance-ment; and one based on spectral fitting to derive non-parametric star formation histories, mass-weighted average values of age, metallicity, and half-mass formation time-scales. Us-ing homogeneously derived effective radii and dynamically determined galaxy masses, we present the distribution of stellar population parameters on the Mass Plane (MJAM,σe,Rmaje ),
showing that at fixed mass, compact early-type galaxies are on average older, more metal-rich, and more alpha-enhanced than their larger counterparts. From non-parametric star formation histories, we find that the duration of star formation is systematically more extended in lower mass objects. Assuming that our sample represents most of the stellar content of today’s local Universe, approximately 50 per cent of all stars formed within the first 2 Gyr following the big bang. Most of these stars reside today in the most massive galaxies (>1010.5M), which
themselves formed 90 per cent of their stars byz∼2. The lower mass objects, in contrast, have formed barely half their stars in this time interval. Stellar population properties are independent of environment over two orders of magnitude in local density, varying only with galaxy mass. In the highest density regions of our volume (dominated by the Virgo cluster), galaxies are older, alpha-enhanced, and have shorter star formation histories with respect to lower density regions.
Key words: galaxies: abundances – galaxies: elliptical and lenticular, cD – galaxies: evolution – galaxies: stellar content.
1 I N T R O D U C T I O N
Our understanding of the stellar populations in early-type galax-ies (hereafter ETGs) has made significant progress in recent years, through a combination of advancements in both observations and stellar population models. These systems are often cited as ideal laboratories for uncovering the fossil record of galaxy formation processes thanks to the apparent lack of dust or star formation, which obfuscates the stellar continuum in objects of later type.
E-mail:[email protected]
However, the modern observational picture is not quite so straight-forward. ETGs are now known to host some degree of young stellar populations (e.g. Trager et al.2000; Kaviraj et al.2007; Kuntschner et al.2010). More surprising is the recent finding that sizeable reser-voirs of molecular gas can be found residing inside ETGs Young, Bureau & Cappellari (2008), coincident with evidence of polycyclic aromatic hydrocarbon features in the infrared domain Shapiro et al. (2010), both of which strongly indicate ongoing star formation within these galaxies, albeit at a rather low level (Davis et al.2014). In addition to a large range in ages, ETGs are also found to show strong correlations between their population parameters and mass-sensitive quantities such as luminosity and velocity dispersion
2015 The Authors
at University of St Andrews on April 7, 2015
http://mnras.oxfordjournals.org/
(e.g. Jørgensen1999; Trager et al.2000; Thomas et al.2005). In gen-eral, these studies find that high-mass galaxies appear older, metal-rich, and with enhanced abundance ratios with respect to lower mass objects – a picture emphatically confirmed with very large samples of galaxies from modern surveys (Bernardi et al.2006; Gallazzi et al.2006; Graves, Faber & Schiavon2009a; Thomas et al.2010). In addition to this general behaviour, specific co-dependences be-tween population parameters after controlling for the general mass dependence have also been proposed Trager et al. (2000); Smith et al. (2008); Graves & Faber (2010). Understanding what drives the large intrinsic scatter in the stellar population scaling relations is key to understanding the evolutionary processes involved.
Despite a deepening clarity in our observational view of ETGs, many open questions remain. For example, the role of young stars in these galaxies is still not clear. Although often referred to as ‘rejuvenated’ galaxies, it is currently unclear if these objects have actually rekindled their star formation in recent times, or contrarily, are in the process of recently shutting down star formation for the first time. The role of environment is also somewhat unclear. Previously considered as important for ETGs in general (Thomas et al.2005; Schawinski et al. 2007), the interplay of mass and environment may also play a role (Thomas et al.2010).
Here, we present the stellar population properties of the ATLAS3D sample (Cappellari et al.2011a) using two approaches: one which uses line strengths to derive single stellar population- (SSP-) equivalent parameters to describe the age, metallicity, and alpha-enhancement; and one which uses spectral fitting to obtain a non-parametric star formation history (SFH) that can be used to de-rive mass-weighted average age and metallicity, and estimate the duration of star formation. We compare both approaches, which yield complementary information, and check for self-consistency between them. We then examine the trends of stellar populations with various other properties. The ATLAS3D project comprises a well-characterized sample with various multiwavelength data in addition to theSAURONintegral field spectroscopy, making it a pow-erful data set to explore correlations between multiple properties.
This paper proceeds as follows: Section 2 describes the observa-tions and analysis methods; Secobserva-tions 3 and 4 present our population parameters on the mass–size plane, and against velocity dispersion and mass, respectively; Section 5 presents trends from our empirical SFHs, and Section 6 concludes.
2 O B S E RVAT I O N S , L I N E S T R E N G T H S , A N D A N A LY S I S
Here we describe the optical spectroscopy used in our analysis. The same spectral data cubes were used for deriving the line strengths and for the spectral fitting, so calibration and removal of emission applies to both techniques.
2.1 SAURONobservations and basic calibration
TheSAURON spectrograph and basic data reduction is described in detail in Bacon et al. (2001). Further details of the ATLAS3D SAURONobservations are given in Cappellari et al. (2011a). The details of our calibrations and line-strength measurements follow closely the techniques developed and described by Kuntschner et al. (2006). Most of the 260 ATLAS3DSAURONspectra were obtained after the spectrograph was upgraded with a volume-phase holo-graphic (VPH) grating in 2004, except for 64 objects observed as part of theSAURONSurvey (de Zeeuw et al.2002) and other related projects. The pre- and post-VPH data are reduced and anal-ysed self-consistently to respect the slightly different dispersion
characteristics. The wavelength coverage of the pre- and post-VPH data are very similar, with only a slight difference in resolution. The adopted spectral resolution for pre-VPH data is 110 km s−1 compared to 99 km s−1for VPH data. Observations of the almost featureless white dwarf EG131 were used to verify that the detailed transmission characteristics, including the medium-scale variations described in Kuntschner et al. (2006), were present in the pre- and post-VPH data, agreeing to better than 1 per cent. Corrections for airmass were applied using the average La Palma extinction curve (King1985).
A total of 67 different standard stars were observed during both theSAURONand ATLAS3Dcampaigns in order to calibrate our line strengths on to the standard Lick system (Worthey et al.1994), as well as to monitor stability and reproducibility in our measurements (160 separate observations were made). Offsets to the Lick system are derived in Appendix A, along with a comparison of pre- and post-VPH values, a comparison with the MILES library (S´anchez-Bl´azquez et al.2006), and discussion of the intrinsic uncertainties in our measurements. Appendix B presents a comparison of our line-strength measurements on the Lick system with Gonz´alez (1993) and Trager et al. (1998) for overlapping galaxies, showing good agreement given the uncertainties of matching apertures and differ-ing treatment of emission.
2.2 Emission correction
TheSAURONspectral range includes several nebular emission lines, all of which lie close to or within the bandpasses of our line-strength indices. Namely: Hβ, present in both emission and ab-sorption; [OIII]λλ4959, 5007, which strongly affects the Fe5015 index; and [NI]λλ5198, 5200, which falls within the Mgbindex. As in Kuntschner et al. (2006), we employ the technique devel-oped by Sarzi et al. (2006), which involves simultaneously finding the best linear combination of absorption- and emission-line tem-plates whilst fitting non-linearly for the emission line kinematics. The kinematics of the various lines are tied to that of [OIII], being the more robustly measured line. The resulting emission line fits are subtracted from the galaxy spectrum if the AoN (ratio of the amplitude of the fitted line to the local noise level in the spectrum, which includes fit residuals) is significant. Following Sarzi et al. (2006), the AoN thresholds used are AoN>4 for [OIII], and then if this is detected, AoN>3 for Hβand AoN>4 for [NI].
The nebular emission lines are fitted and subtracted on the spa-tially resolved data cubes (after spaspa-tially binning to a threshold signal-to-noise ratio of 40 per pixel with the Voronoi binning soft-ware of Cappellari & Copin2003) before generating the aperture spectra. This largely avoids strongly non-Gaussian emission line profiles (due to the rotation and/or distribution of the gas), which can leave significant residuals.
To estimate how strongly the various indices are affected by resid-ual under- or oversubtracted emission, we use the spectral template fits to provide a good representation of the spectral lines in the ab-sence of any emission. We then compare the observed indices with those measured on the template fits. The differences between the observed and template indices are typically similar to or smaller than the statistical errors on the line measurements. However, a few galaxies show significantly larger differences, due to imper-fect emission correction in the presence of very strong emission lines with complex, non-Gaussian line profiles. Rather than using the index measured on the template, which is known to be biased towards solar abundance ratios, we adopt thedifferencebetween the observed and best-fitting template indices as an estimate of the systematic errors. We furthermore take the statistical uncertainties
at University of St Andrews on April 7, 2015
http://mnras.oxfordjournals.org/
from repeat observations of standard stars as a lower limit on the errors (see TableA2given in Appendix A).
2.3 Aperture line strength measurements
Fig.1of Emsellem et al. (2011) shows the distribution of radii cov-ered by our integral-field spectroscopic data, defined as the max-imum circular radius,Rmax, that is at least 85 per cent filled with spectra. Note that this fill factor includes lost spaxels removed due to e.g. foreground stars. The median maximal radius is ∼1.2Re, with only 10 galaxies having coverage of less thanRe/2. In terms of aperture coverage, more than half the sample has a filling factor of 85 per cent or more within a circle ofRe, and all but 11 galaxies have this coverage atRe/2.
We measure line strengths in three different circular aperture sizes:Re/8,Re/2, andRe. The smallest of these is comparable to aperture sizes commonly used in conventional long-slit investiga-tions (e.g. Trager et al.2000; Thomas et al.2005). TheRe/2 aper-ture is our largest common aperaper-ture that requires minimal aperaper-ture corrections in a small number of objects. TheRe aperture is the most representative ‘global’ value that we can derive based on our data.
To generate the aperture measurements from the data cubes, we use an analogy of ‘growth curves’, co-adding spectra within in-creasing circular aperture sizes and measuring the indices at each step. We assign a characteristic radius to each aperture spectrum that represents the radius of a circle having the same area as that of the includedSAURONdata, computed from the actual bins within the aperture. Thus, where the aperture is well filled by the SAURONdata, this radius is similar to the radius of the desired cir-cular aperture. But as the aperture becomes more poorly filled near the edge of the field, the characteristic radius will tend to a fixed value (the area of the full observed field) regardless of the tar-get aperture size. By using a threshold filling factor of 85 per cent, the difference between the target aperture and delivered area is small.
For the galaxies where the maximum characteristic radius is smaller than the target aperture radius, an aperture correction is applied to the measured indices. Due to the presence of age gradi-ents that systematically vary in strength with galaxy age, we derive age-dependent aperture corrections. Appendix C gives details of this correction and of the coefficients to apply such corrections. The aperture corrections for our sample are typically 2 per cent or less, with a maximum of 8 per cent for our largest correction, and our overall results do not depend on these corrections.
The line indices themselves are measured on the Lick/IDS system (Worthey et al.1994) following the standard treatment of broaden-ing the spectra as per the Lick broadenbroaden-ing function. We account for the dilution of the line strength due to velocity broadening by mea-suring the equivalent indices on the broadened and unbroadened optimal template fit, thus accounting for line strength and line-of-sight velocity distribution dependences of the velocity dispersion corrections (Kuntschner et al.2006; McDermid et al.2006). We measure the following indices in all galaxies and aperture sizes: Hβ, Fe5015, and Mgb. TheSAURONwavelength range has a red cut-off wavelength that changes as a function of position in the field, caus-ing Kuntschner et al. (2006) to define a new index, Fe5270S, which linearly traces the Fe5270 Lick index. We use this modified index to estimate the standard Lick Fe5270 index for a subset of objects and apertures where theSAURONwavelength coverage allows.1The
1We derive Fe5270 using the empirical relation Fe5270 =
1.28×Fe5270S+0.03 from Kuntschner et al. (2006)
line strengths measured within the three aperture sizes considered are given in Tables1–3, which are available in full via the online journal, and also via our project website,http://purl.com/atlas3d.
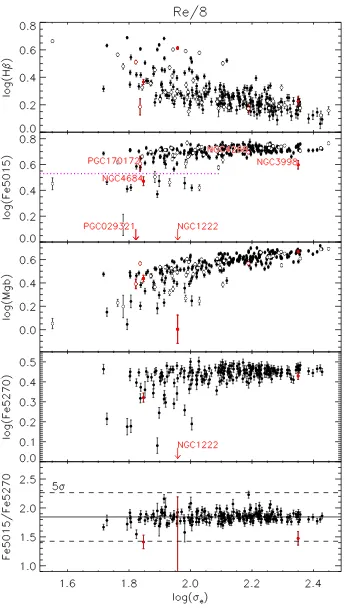
Fig.1presents our line indices measured within one of the three apertures,Re/8, plotted as a function of the velocity dispersion mea-sured within oneRe, log (σe) taken from Cappellari et al. (2013a). Filled symbols denote the galaxies where Fe5270 could be mea-sured within the given aperture size, with the remainder plotted as open symbols.
As found by numerous other authors (e.g. Trager et al. 2000; Thomas et al. 2005), there are rather tight, positive correlations between the metal-sensitive lines and velocity dispersion, and the age-sensitive Hβ index shows a negative trend with σe. All in-dices show an increased scatter at lower σe values, implying a greater variety of apparent stellar population properties at lower masses.
The Fe5015 index lies on top of the strong [OIII] emission line at 5007Å. For this index, the apparent scatter is driven by a number of galaxies sitting below the main relation. To test whether this is the result of infill from poorly subtracted [OIII] emission or genuinely weaker iron, we use the fact that some galaxies have a measurable Fe5270 index, which is free from nebular emission contamination. Fig. 1shows several galaxies where Fe5270 also lies below the general relation, but the ratio of the two iron indices (bottom panel of Fig.1) is consistent with the sample average, demonstrating that the weak Fe5015 measurements in these cases are not due to poor emission line correction. We discuss these ‘low-Fe’ objects further in Section 2.6.
We highlight a few objects in Fig. 1that need special treat-ment. First, two objects had significantly lower signal-to-noise ratio than the rest of the sample, namely NGC 4268 and PGC 170172. These two objects are not considered further in our analysis. In addition, the following objects show large errors in their Fe5015 values due to imperfect subtraction of the very strong and non-Gaussian [OIII] emission line, as indicated by their spuriously low Fe5015/Fe5270 ratio in Fig.1: NGC 1222 (starburst galaxy, Balzano
1983), NGC 4684, NGC 5273, and NGC 3998. These latter two ob-jects are known LINERs (low-ionization nuclear emission-line re-gions) with a broad nuclear emission line component (V´eron-Cetty & V´eron2010) that only affects the smallRe/8 aperture size, and so we include them when considering the larger aperture measure-ments. NGC 1222 is excluded for all aperture sizes. PGC 029321 has no Fe5270 measurement, but shows large discrepancies between the Fe5015 index measured on the observed and fitted spectrum due to emission residuals, and so is also excluded in our analysis. For all the problematic cases mentioned here, we still provide measured values in Tables1–3where possible, but flag them in the ‘quality’ column.
2.4 Deriving SSP parameters
As in McDermid et al. (2006), we make use of a customized ver-sion of the Schiavon (2007) models where [Ti/Fe]=0.5×[Mg/Fe]. These models were found to give better agreement between abun-dance ratios computed with Fe5015 and Fe5270 (see Kuntschner et al. 2010for details), and this relative scaling of [Ti/Fe] and [Mg/Fe] is also approximately consistent with the measured abun-dances for ETGs from Johansson, Thomas & Maraston (2012). The models make predictions of the Lick indices for a grid of various ages, metallicities, and alpha-element enhancements. Each position in this grid represents the prediction for a single population of stars sharing these parameters.
at University of St Andrews on April 7, 2015
http://mnras.oxfordjournals.org/
Figure 1. Absorption line indices measured withinRe/8 against the effective velocity dispersion,σe(measured within oneRe, taken from Cappellari et al.
2013a). Red symbols and text indicate problematic galaxies as described in the main text. The dotted magenta line in the Fe5015 plot indicates the separation of ‘low-Fe’ objects discussed in the text, given here as log (Fe5015)=0.53. The solid line in the bottom panel indicates the biweight mean value, 1.84, with dashed lines showing the±5 times the standard deviation around this value. Closed and open symbols in the upper panels correspond to galaxies with and without Fe5270 measurements, respectively.
at University of St Andrews on April 7, 2015
http://mnras.oxfordjournals.org/
Table 1. Measured Lick index measurements and SSP parameters measured withinRe/8.
Name Hβ(Å) Fe5015 (Å) Mgb(Å) Fe5270 (Å) AgeSSP(Gyr) [Z/H]SSP [α/Fe]SSP Quality
Re/8 Re/8 Re/8 Re/8 Re/8 Re/8 Re/8
(1) (2) (3) (4) (5) (6) (7) (8) (9)
IC0560 2.95±0.10 4.17±0.14 2.29±0.12 2.20±0.11 1.85±0.21 −0.11±0.05 0.09±0.05 1 IC0598 2.88±0.10 4.64±0.14 2.46±0.12 2.31±0.12 1.70±0.22 0.04±0.05 0.05±0.04 1 IC0676 3.51±0.15 2.64±0.14 1.75±0.23 1.51±0.11 2.02±0.23 −0.64±0.08 0.37±0.11 2 IC0719 2.16±0.10 5.14±0.14 3.26±0.12 2.75±0.11 3.53±0.68 0.03±0.05 0.11±0.04 1 IC0782 2.27±0.10 4.98±0.14 2.88±0.12 – 3.10±0.36 −0.03±0.06 0.06±0.05 1 IC1024 4.00±0.10 2.35±0.14 1.52±0.17 1.20±0.11 1.59±0.18 −0.75±0.06 0.41±0.09 2
Notes.Columns: (1) Galaxy name. (2)–(5) Lick index measurements withinRe/8, measured on the Lick/IDS system. Fe5270 is
measured indirectly via the Fe5270Sby applying the relation Fe5270=1.28×Fe5270S+0.03 (Kuntschner et al.2006). Due to field
coverage issues, this index cannot be measured for all objects. (6)–(8) Estimates of SSP-equivalent age, metallicity, and abundance ratio within a circular aperture of radiusRe/8 using the SSP models of Schiavon (2007) and using the three indices Hβ, Fe5015, and
Mgb. (9) Quality flag: 1=data are of good quality; 2=object with weak Fe5015 index in theRe/8 aperture; 3=strong emission line
residuals; 4=low signal-to-noise ratio. The full version of this table with all 260 galaxies is made available via the online journal, and via our project websitehttp://purl.com/atlas3d.
Table 2. Measured Lick index measurements and SSP parameters measured withinRe/2.
Name Hβ(Å) Fe5015 (Å) Mgb(Å) Fe5270 (Å) AgeSSP(Gyr) [Z/H]SSP [α/Fe]SSP Quality
Re/2 Re/2 Re/2 Re/2 Re/2 Re/2 Re/2
(1) (2) (3) (4) (5) (6) (7) (8) (9)
IC0560 2.53±0.10 3.86±0.14 2.32±0.12 2.15±0.11 2.67±0.31 −0.30±0.05 0.14±0.06 1 IC0598 2.43±0.10 4.20±0.14 2.47±0.12 2.22±0.11 2.84±0.33 −0.22±0.05 0.11±0.05 1 IC0676 3.02±0.10 3.25±0.14 1.92±0.12 1.75±0.11 2.20±0.25 −0.48±0.06 0.22±0.07 2 IC0719 2.43±0.10 4.16±0.14 2.69±0.12 2.46±0.11 2.84±0.33 −0.18±0.04 0.18±0.05 1 IC0782 2.08±0.10 4.51±0.20 2.58±0.12 – 4.77±0.85 −0.25±0.05 0.03±0.06 1 IC1024 3.59±0.15 2.25±0.14 1.66±0.20 1.30±0.11 2.06±0.24 −0.78±0.07 0.50±0.05 2
Notes.Columns are as per Table1but for anRe/2 aperture size. The full version of this table with all 260 galaxies is made available
via the online journal, and via our project websitehttp://purl.com/atlas3d.
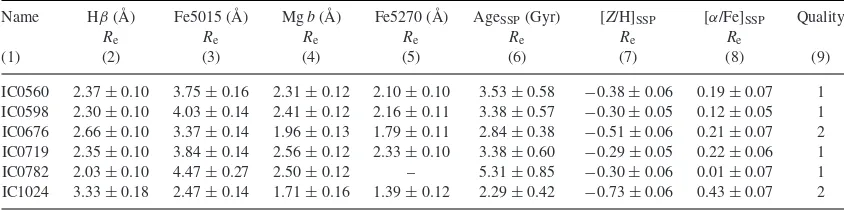
Table 3. Measured Lick index measurements and SSP parameters measured withinRe.
Name Hβ(Å) Fe5015 (Å) Mgb(Å) Fe5270 (Å) AgeSSP(Gyr) [Z/H]SSP [α/Fe]SSP Quality
Re Re Re Re Re Re Re
(1) (2) (3) (4) (5) (6) (7) (8) (9)
IC0560 2.37±0.10 3.75±0.16 2.31±0.12 2.10±0.10 3.53±0.58 −0.38±0.06 0.19±0.07 1 IC0598 2.30±0.10 4.03±0.14 2.41±0.12 2.16±0.11 3.38±0.57 −0.30±0.05 0.12±0.05 1 IC0676 2.66±0.10 3.37±0.14 1.96±0.13 1.79±0.11 2.84±0.38 −0.51±0.06 0.21±0.07 2 IC0719 2.35±0.10 3.84±0.14 2.56±0.12 2.33±0.10 3.38±0.60 −0.29±0.05 0.22±0.06 1 IC0782 2.03±0.10 4.47±0.27 2.50±0.12 – 5.31±0.85 −0.30±0.06 0.01±0.07 1 IC1024 3.33±0.18 2.47±0.14 1.71±0.16 1.39±0.12 2.29±0.42 −0.73±0.06 0.43±0.07 2
Notes.Columns are as per Table1but for anReaperture size. The full version of this table with all 260 galaxies is made available via
the online journal, and via our project websitehttp://purl.com/atlas3d.
We show in Fig.2the distribution of our full sample in the indices Hβversus [MgFe50]2for the three aperture sizes, overplotted with these model predictions using [α/Fe]=0. The effects of abundance ratio are largely mitigated with this choice of indices (Thomas, Maraston & Bender2003). The models have been adapted for zero-point differences between the Lick system and the Schiavon models using table 1 of Schiavon (2007).
From this figure, it can be seen how the changing distribution of Hβ for the different apertures implies that the young stars in general are centrally concentrated. It can also be seen that the
in-2[MgFe50]=0.69×Mgb+Fe5015
2 (Kuntschner et al.2010).
ferred metallicity becomes lower for larger apertures, due to the inclusion of the metal-poor outer regions. We also note that several objects have implied ages that are older than the canonical age of the Universe fromPlanck(13.74–13.82 Gyr; Planck Collaboration I
2014). In Appendix D, we show that these points are consistent with objects close to this upper age limit considering our observational uncertainties.
To derive the best-fitting SSP parameters for our data, we use the three indices that are measured across the full field for all galaxies, namely Hβ, Fe5015, and Mgb. We employ the straightforward yet robust technique of finding the SSP model that best predicts our ob-served line indices simultaneously. As per McDermid et al. (2006) and Kuntschner et al. (2010), we do this by means of chi-squared
at University of St Andrews on April 7, 2015
http://mnras.oxfordjournals.org/
Figure 2. Index–index diagram for our sample using the indices Hβversus [MgFe50], overplotted with model predictions from Schiavon (2007) for SSPs with constant ages, metallicities, and solar abundance ratios. From top to bottom, each panel uses indices measured within different circular apertures, with radii ofRe/8,Re/2, andReas indicated. An error bar in each
panel indicates the statistical errors.
fitting: effectively computing the ‘distance’ from our measured in-dices to all the predicted values of those inin-dices, and finding the model with the minimum total distance. To reduce the effects of grid discretization, we oversample the original models using linear interpolation. Measurement errors on the indices are included as weighting factors in the sum. This particular technique has been used by several authors (Proctor, Forbes & Beasley2004; Thomas et al.2010), although there are other methods for inverting the model grids to derive parameter values (e.g. Graves & Schiavon2008).
We estimate the parameter errors by taking the range of points at which the difference in chi-square from the minimum is equal to unity, giving an estimate of the projected dispersion on each parameter. This method is computationally efficient, and we verified that it agrees well with a Monte Carlo approach. All SSP values are given in Tables1–3, which are available in full via the online journal, and via our project website:http://purl.com/atlas3d.
2.5 Mass-weighted parameters from spectral fitting
We use the publicly available3penalized pixel fitting code ( PPXF; Cappellari & Emsellem2004) to fit a linear combination of SSP model spectra from the MIUSCAT model library (Vazdekis et al.
2012), spanning a regular grid of log (age) (0.1–14 Gyr) and metal-licity ([Z/H]= −1.71 to 0.22, equivalent toZ=0.0004–0.03), giv-ing 264 templates in total. Due to the degeneracy of inferrgiv-ing the SFH from the integrated galaxy light, we make use of linear reg-ularization (Press et al.1992) to impose a smoothness constraint on the solution, using the ‘REGUL’ option ofPPXF. The solution is defined by the weights applied to each model in a regularly sampled grid of age and metallicity, and regularization imposes a constraint in this parameter-space such that models with neighbouring age and metallicity must have weights that vary smoothly. The relative importance of this smoothness constraint compared to the actual fit quality is controlled via a simple ‘regularization parameter’, which essentially controls how smooth the solution is. The SSP model spectra are provided to an initial birth cloud mass of 1 solar mass, and so the relative ‘zero-age’ mass-to-light ratios (M/L) are included in the fitted weights. The distribution of weights fromPPXFtherefore defines the relative contributions in (zero-age) mass of the different populations: effectively the SFH for that galaxy.
For each galaxy, we fit the spectrum integrated within one ef-fective radius as per the largest aperture considered for the SSP analysis. We derive solutions for a range of regularization param-eter values, and select the value that gives a resulting best-fitting solution withχ2∼√2N, whereNis the number of pixels in the spectrum being fitted, andχ2is computed as the difference be-tween theχ2of the current solution with that of the non-regularized case. This criterion is suggested by Press et al. (1992) as a robust indication of when the fit has become unacceptable. In this way, we are deriving thesmoothestSFH that still reproduces theSAURON spectrum. The actual SFHs of galaxies are likely not smooth. Star formation is inherently stochastic when considered with sufficient temporal and spatial resolution, and specific events such as mergers and interactions may trigger or truncate the star formation process on short time-scales. In fact, we have also shown that the colours and Hβindices of the bluest and most H2-rich galaxies can be re-produced with a small amount of current or recent star formation activity superposed on an old stellar population (Young et al.2014). However, inferring such events from the integrated light is highly degenerate for typical observational data, and the smoothness con-straint offers a robust and objective result that can be used to study systematic trends in the entire sample. We also note that non-smooth solutions are in no way excluded by our approach, but if a smooth solution can give a fit of similar quality (as determined viaχ2), then the smooth solution will be adopted.
The mass-weighted age and metallicity are given as
log(AgeSFH)=
wilog(tSSP,i)
wi (1)
and
[Z/H]SFH=
wi[Z/H]SSP,i
wi , (2)
respectively, wherewidenotes the weight given byPPXFto theith template, which has agetSSP,iand metallicity [Z/H]SSP,i. The grid of model ages is sampled logarithmically, hence the logarithmic form
3http://purl.org/cappellari/idl
at University of St Andrews on April 7, 2015
http://mnras.oxfordjournals.org/
Table 4. Mass-weighted stellar population properties measured withinRe.
The full version of this table with all 260 galaxies is made available via the online journal, and via our project websitehttp://purl.com/atlas3d.
Name AgeSFH(Gyr) [Z/H]SFH t50(Gyr)
Re Re Re
(1) (2) (3) (4)
IC0560 6.73±1.07 −0.46±0.06 6.55±1.07 IC0598 5.37±0.99 −0.40±0.05 8.60±0.99 IC0676 6.00±1.92 −0.55±0.18 7.22±1.92 IC0719 9.21±0.86 −0.25±0.08 4.23±0.86 IC0782 6.16±0.83 −0.19±0.11 7.09±0.83 IC1024 4.39±0.63 −0.77±0.15 8.65±0.63
Notes. Columns: (1) Galaxy name. (2) weighted age. (3) Mass-weighted metallicity. (4) Half-mass formation time. These properties were derived from a regularized spectral fit to a spectrum integrated withinRe.
Errors were computed via Monte Carlo realizationswithoutregularization constraints. See text for details.
of equation (1). Errors on these quantities were computed via Monte Carlo simulationswithoutregularization.
The SSP spectral templates we use have fixed (solar) abundance ratios, and so we cannot derive a mass-weighted [α/Fe]. We can, however, derive a measure of the star formation time-scale directly from the SFH itself. The measure we use is the time,t50, taken to form 50 per cent of the current-day stellar mass within oneRe, and is derived from the cumulative function of the SFH (see Section 5.1). All mass-weighted quantities are given in Table4.
2.6 Comparison of SFHs with SSPs and SDSS
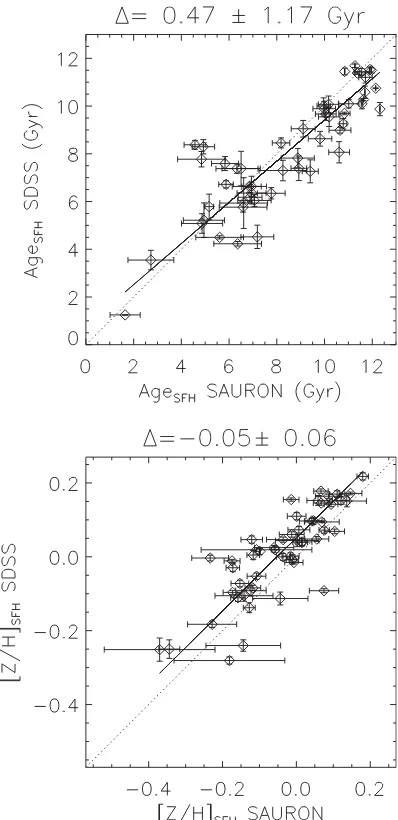
An obvious concern in deriving the SFH fromSAURONspectra is the short wavelength range available. To test this, we compare the SFHs derived fromSAURONwith those derived from fitting Sloan Digital Sky Survey (SDSS) spectroscopy (DR8; York et al.2000) of the galaxies in common, using the entire SDSS wavelength range to constrain the SFH – a more than 10-fold increase in the wave-length coverage of the spectrum. For this test, we adapt theSAURON aperture to match the 3 arcsec diameter SDSS fibre, thus minimiz-ing the effects of population gradients. Fig.3shows a comparison of theSAURONand SDSS mass-weighted average ages and metallic-ities derived by applying the above procedure. The mass-weighted parameters compare very well, showing no significant systematic biases across the range of age and metallicity considered despite the dramatically different spectral ranges used. Age shows a slight trend to older ages derived bySAURON, but the oldest case is still consistent with SDSS within the 1σscatter. Metallicity is also very consistent, albeit with a small average offset, but again within the 1σscatter. Overall, the agreement is remarkably good, and suggests that the short wavelength range ofSAURONdoes not significantly bias our derived SFHs.
We compare our mass-weighted and SSP-equivalent parameters in Fig.4, this time using a 1Reaperture. The mass-weighted ages are systematically older for all but the oldest ages, where we are biased by the lower maximum age of our spectral template library. Including templates up to 17 Gyr reduces the ‘bunching’ of points at oldest ages, but for clarity of interpreting our SFHs, we use a maximum age of 14 Gyr in our template library, consistent with current cosmological models (Planck Collaboration I2014). The older mass-weighted ages derived from spectral fitting are a direct result of the well-known bias of SSP-equivalent ages by small mass fractions of young populations, and our findings agree well with
Figure 3. Comparison of mass-weighted age (top) and metallicity (bottom) derived from fittingSAURONand SDSS spectra within the same spatial aperture. The mean difference (SAURON−SDSS) and the standard deviation are given in the plot titles. The dotted lines indicate the 1:1 identity line, with a thick line showing the best linear fit. Errors were computed via Monte Carlo simulations without regularization.
the exploration of this issue by Serra & Trager (2007). Metallicities show good agreement, also as expected following the findings of Serra & Trager (2007), who showed that SSP-equivalent metallici-ties are close to the mass-weighted values, being less biased by the presence of young stars. We also note that there is no obvious bias caused by using models limited to solar abundance ratios.
Finally, we find a clear trend between the SSP-equivalent alpha enhancement andt50. We overplot the linear relation given by de La Rosa et al. (2011), who conducted a similar analysis on SDSS spectra using theSTARLIGHTcode of Cid Fernandes et al. (2005). We also show the canonical relation between abundance ratio and star formation time-scale from Thomas et al. (2005), equation 4: [α/Fe]∼ 15−16logt, wheretis the FWHM (full width at half-maximum) of the assumed Gaussian SFH. This relation reproduces the non-linearity of our measured time-scale against [α/Fe]. We also note that the limited age resolution of the SSP models at the oldest ages creates a ‘floor’ in the t50 values at the shortest
at University of St Andrews on April 7, 2015
http://mnras.oxfordjournals.org/
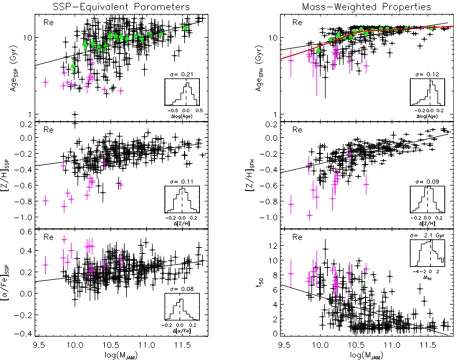
Figure 4. Comparison of SSP-equivalent parameters (x-axis) and mass-weighted parameters derived using spectral fitting (y-axis) within the same aperture of one effective radiusRe. Magenta points highlight the objects with low Fe as discussed in Section 2.3. Identity lines are given for age and metallicity. The
right-hand panel shows [α/Fe] versust50, the time taken to form half the current-day mass. The relationt50= −15.3[α/Fe]+5.2 given by equation 2 in de La
Rosa et al. (2011) is overplotted on our data with a green dashed line. The blue dotted line shows the canonical conversion of abundance ratio to star formation time-scale from equation 4 of Thomas et al. (2005) based on chemical evolution models: [α/Fe]∼1
5− 1
6logt. The red solid line and text indicate our
best-fitting function of the same form, giving an empirical relation between [α/Fe] andt50for the ATLAS3Dsample.
Figure 5. Residuals from the SSP-velocity dispersion trends plotted as a function of molecular gas fraction. Median errors are indicated in the bottom-left corner of each panel, with H2mass fraction errors within the plotting symbol. Arrows indicate 3σupper limits for the H2mass. Diamonds denote CO detections
in the Virgo cluster. Open circles show detections of non-Virgo objects. Filled magenta symbols correspond to the ‘low-Fe’ objects discussed in Section 2.3. Their weak Fe5015 indices result in low metallicity and high [α/Fe]. We speculate that these objects have had recent gas accretions, giving rise to young, metal poor stars that have not yet been enriched with ejecta from Type 1a supernovae. Only one of these low-Fe objects is found in the Virgo cluster (filled magenta diamond).
time-scales. This important region, corresponding to the earliest epochs of massive galaxy formation, is where abundance ratios can yield higher fidelity than our SFH. We therefore use our empirical half-mass formation time to constrain a relation of the same form as that of Thomas et al. (2005) to relate [α/Fe] tot50. The result-ing expression is indicated by the red line in Fig.4, and is given by
[α/Fe]=0.28−0.19 log(t50). (3)
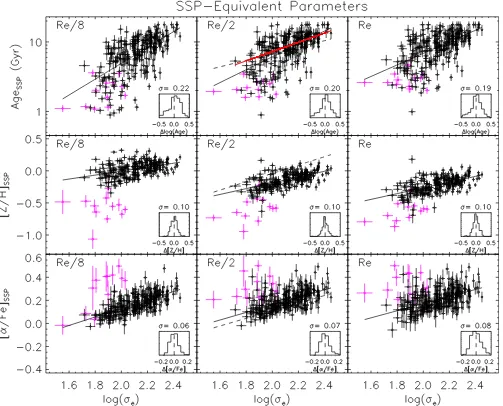
The objects plotted with magenta symbols in Fig.4(the low-Fe objects) are mostly outliers to the [α/Fe]–t50 trend, having large values oft50– i.e. long formation time-scales, contrary to what is expected from their high [α/Fe] values. The relatively weak iron indices result in low metallicities and subsequentlyhigh [α/Fe], but since they also have low velocity dispersions, they are strong outliers in the scaling relations shown in Fig.8. Fig.5shows the residuals of the SSP parameter–velocity dispersion relations for an
Re/8 aperture, plotted against molecular gas mass fraction, with the low-Fe objects marked with filled symbols. This shows that, as well as having low metallicity, the low-Fe objects also have high molec-ular gas fractions and are among the youngest in the sample. This suggests their apparently high SSP-equivalent [α/Fe] may indicate the presence of stars that have not yet been appreciably enriched by Type 1a supernovae – the main contributor of iron to the gas in-volved in star formation. Their young age causes them to outshine the older, lessα-enhanced stars, and dominate the SSP abundance measurement. They do not show any preferred kinematic misalign-ment (Davis et al.2013), and are not Virgo cluster members except for one, NGC 4694, which is a low-mass object in the outskirts of Virgo. We speculate that these low-Fe galaxies have recently ac-creted a new supply of cold, low-metallicity gas, which is currently in the process of forming stars. These 12 low-Fe objects are shown as magenta symbols in subsequent plots unless stated otherwise, and are indicated in Tables1–3via the ‘quality’ flag.
at University of St Andrews on April 7, 2015
http://mnras.oxfordjournals.org/
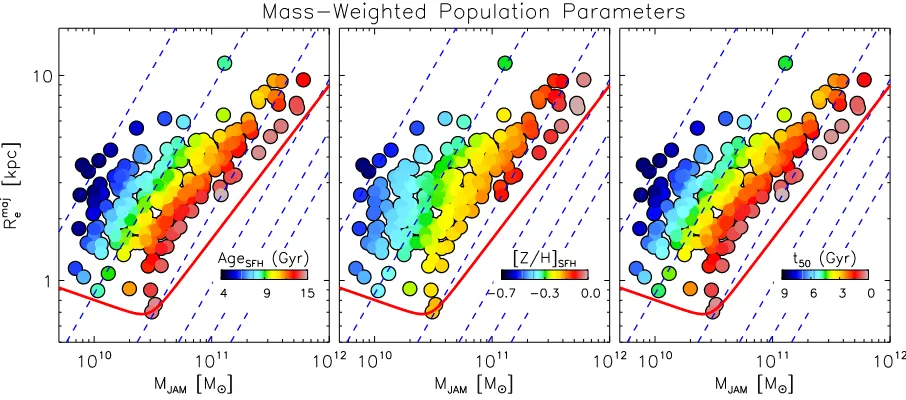
Figure 6. SSP-equivalent population parameters measured within one effective radius, plotted on the plane of effective radiusRmaje versus dynamical mass,
MJAM. Colours indicate the population parameters as indicated in each plot after spatially averaging with the LOESS technique described in the text. For a fixed
range inMJAM, the smallest galaxies are generally the oldest, most metal-rich, and alpha-enhanced. Dashed lines show lines of constant velocity dispersion:
50, 100, 200, 300, 400, and 500 km s−1from left to right, as implied by the virial mass estimatorMJAM=5Rmaj
e σ2/G. The red curve shows the ZOE defined
[image:9.595.68.521.332.532.2]in Cappellari et al. (2013b).
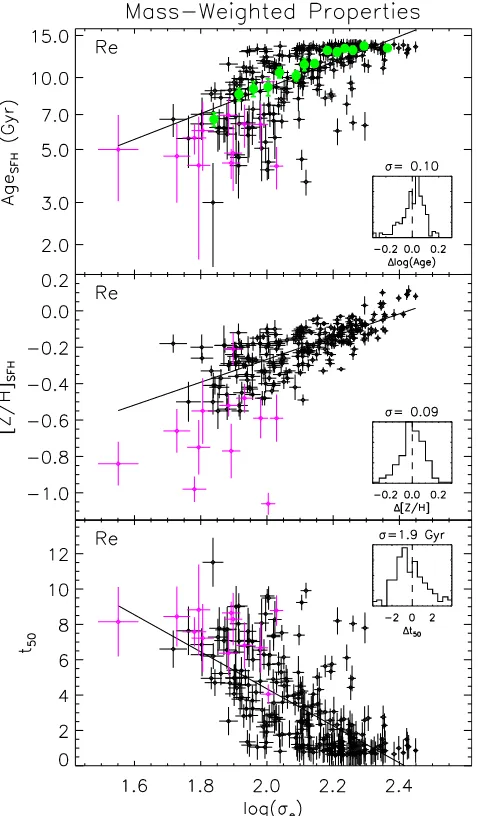
Figure 7. Same as Fig.6, but using the mass-weighted age and metallicity, andt50– the time taken to form half the stars inside 1Re.
3 P O P U L AT I O N PA R A M E T E R S O N T H E M A S S P L A N E
Galaxy stellar populations have been found to correlate better with stellar surface density (Kauffmann et al.2003; Franx et al.2008) or with velocity dispersion (Graves & Faber2010) than with mass or galaxy size. The same was found to hold for the dynamical M/L, which mainly traces age variations (Cappellari et al.2006). In Cappellari et al. (2013b), we used accurate masses and veloc-ity dispersions to show that indeed the velocveloc-ity dispersion is the best simple tracer of multiple galaxy properties. We showed that velocity dispersion is such a good predictor of galaxy properties because it traces the bulge fraction, which appears to be the main driver of the M/L, Hβ, and colour, as well as the molecular gas fraction in ETGs. Here, we focus on trends in the stellar population parameters.
Figs6and7show the distribution of population parameters as a function of mass and size (which we hereafter refer to as the Mass Plane) for our sample, using the SSP-equivalent and mass-weighted parameters, respectively. The massMJAMis derived applying equa-tion 3 of Cappellari et al. (2013b), using the (M/L)JAMandr-band luminosity given in table 1 of Cappellari et al. (2013a), columns 6 and 15, respectively. We use the robust size parameterRmaj
e , corre-sponding to the major axis of the half-light isophote (Hopkins et al.
2010) as derived in Cappellari et al. (2013a), and taken from table 1 there.
The points in Figs6and7are coloured according to the popula-tion parameters as indicated. The distribupopula-tions have been adap-tively averaged by applying an implementation4 of the LOESS
4Available fromhttp://purl.org/cappellari/idl.
at University of St Andrews on April 7, 2015
http://mnras.oxfordjournals.org/
algorithm (Cleveland & Devlin1988), using a local linear approx-imation, and a regularization factorf= 0.6. The same approach is taken in Cappellari et al. (2013b) and is found to give a good approximation to the underlying intrinsic distribution, mimicking the average behaviour that would be derived from much larger samples (e.g. Gallazzi et al. 2006). We note that, since we are adaptively averaging the data points, the range of values is re-duced in accordance with the rere-duced effects of errors and intrinsic scatter.
As in Cappellari et al. (2013b), we overplot lines of con-stant velocity dispersion, as implied by the virial mass estimator
MJAM=5Rmaje σ
2/G. We find that the SSP-equivalent population parameters follow trends of nearly constant velocity dispersion on the Mass Plane, as indicated by the tilt of the iso-colour regions. The mass-weighted age and formation time-scale follow even more tightly the lines of constant dispersion, which reflects the lower scatter in the mass-weighted properties as a result of lower formal uncertainties, and less susceptibility to small fractions of young stars being present. The mass-weighted metallicity is also closely linked to the velocity dispersion, though the iso-colour regions show an appreciable dependence onMJAMalso (i.e. steeper iso-colour re-gions).
These figures show that, for fixed mass, more compact galax-ies are on average older, more metal-rich, have higher abundance ratios, and shorter formation time-scales than larger galaxies. The trends with SSP age and metallicity agree with previous results from averaged properties of stacked SDSS spectra (van der Wel et al.2009; Shankar et al.2010). We show here that these trends hold for measurements of individual galaxies. Moreover, the trend with abundance ratio, mass-weighted properties, and formation time-scale measured directly from the SFH can only be obtained from a spectroscopic analysis, and are reported here for the first time.
Graves, Faber & Schiavon (2009b) found that Re does not correlate with either population parameters or their residuals from the population–σ relations. This can be understood from the mass–size plane. At each Rmaj
e , there is a similar range of population parameters, thus showing no particular correlation. Likewise, as σ traces the parameters closely, the residuals of the population–σ trends show no significant residual correlation with Rmaj
e . Indeed, Figs 6 and 7 show that velocity dispersion is an excellent predictor of all three stellar population param-eters, with the smoothed population parameters varying essen-tially parallel to the lines of constant (virial-predicted) velocity dispersion.
We advocate that the Mass Plane is a novel and useful tool for understanding galaxy properties. Comparing our Figs6and7to figs 3–8 of Cappellari et al. (2013b) reveals the close connections between the stellar population parameters and other important quan-tities, in particular colour, molecular gas mass fraction, and bulge fraction, such that, at a given mass, smaller galaxies are redder in colour, have lower fractions of molecular gas, and have a sec-ond momentVrms≡
√
V2+σ2dominated by a dynamically hot central ‘bulge’ component. There are no particular trends with in-trinsic shape other than the fact that the population of round objects aboveMJAM2×1011Mare typically old, metal-rich andα -enhanced. Nor is there a close connection to the specific angular momentum,λR, which supports the findings of Naab et al. (2014) whereλRis shown to trace a galaxy’s evolution, but that there are many evolutionary paths to given current-day value. We explore the connection between the kinematic classes and stellar populations in Section 4.5.
4 P O P U L AT I O N T R E N D S W I T H V E L O C I T Y D I S P E R S I O N A N D M A S S
In this section, we present a more traditional two-dimensional anal-ysis of the stellar population parameters, examining their scaling properties with velocity dispersion and mass, for SSP-equivalent and mass-weighted properties. This allows a more quantitative study of these relations and their scatter, as well as providing context for our findings on the Mass Plane, allowing direct comparison to pre-vious authors. All linear fit parameters are given in Table5.
4.1 SSP-equivalent parameters versus velocity dispersion
Fig.8shows the resulting SSP-equivalent parameters for our three aperture radii, plotted against the effective velocity dispersion, log (σe), given in column 2 of table 1 in Cappellari et al. (2013a). As shown in the previous section, the population parameters cor-relate tightly with velocity dispersion, confirming the trends from previous authors. For comparison, in Fig.8we overplot with dashed lines the relations from Thomas et al. (2010) based on analysis of 3360 galaxies observed with a single fibre by the SDSS, selected as part of the ‘MOSES’ project. We make this comparison on the
Re/2 aperture, which should be the most comparable to the effective aperture of that study.
The Thomas et al. (2010) lines show general agreement, but there are some important differences. In particular, our slope with age is significantly steeper, which is trivially explained by the fact that Thomas et al. (2010) exclude objects younger than 2.5 Gyr (at
z=0.05–0.06) from their fit. We indicate with a red line our fit applying the same selection, and the agreement is excellent. There is also a significant difference in slopes for the metallicity relation. Low-velocity-dispersion objects are similar, but the Thomas et al. (2010) best-fitting linear relation overestimates the high-velocity-dispersion objects by 0.3 dex – several times larger than the total scatter. In Appendix B, we show that the difference in slope is consistent with the lack of any aperture correction applied to the MOSES data to account for the fixed 3-arcsec diameter aperture used. This steepens the relation by including more of the outer regions in lower mass (smaller) objects relative to the high-mass (larger) objects, which are dominated by the high-metallicity inner regions. Even considering the offset in slope, the MOSES best-fitting linear relation is still∼0.2 dex higher in [Z/H]. [α/Fe] also shows a small, less significant, offset such that our values are∼0.05 dex higher than from MOSES. We have verified that these offsets are not caused by differences in the models of Schiavon (2007), Thomas et al. (2003), and Thomas, Maraston & Korn (2004), which, when applied consistently to our line strengths, show average offsets smaller than the 1σ scatter, and which would anyway exacerbate the offsets shown in Fig.8. The differences between our findings and Thomas et al. (2010) may arise from the different combination of indices used by the two studies, but it is beyond the scope of this paper to explore this further.
Contrary to Thomas et al. (2010), we do not find strong evidence for bimodality in our distribution of age and velocity dispersion. Our sample size may be too small to constrain this, though we note that splitting our sample using their age threshold of 2.5 Gyr and ourRe/2 values yields a similar fraction of ‘young’ galaxies (23 out of 260, or 8.8 per cent, for our sample; 10.15 per cent in Thomas et al.2010).
From Fig.8, the effect of different aperture sizes can be seen. Most notably, as we ‘zoom out’ from the Re/8 aperture to Re, the age–σrelation becomes systematically more shallow, showing
at University of St Andrews on April 7, 2015
http://mnras.oxfordjournals.org/
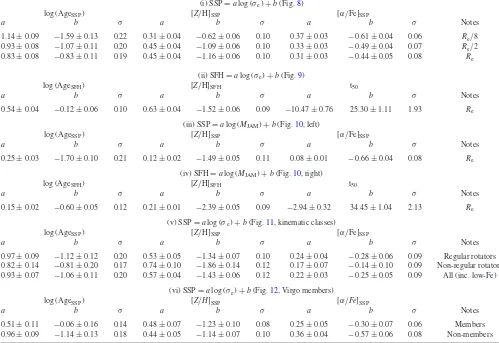
Table 5. Line fit parameters.
(i) SSP=alog (σe)+b(Fig.8)
log (AgeSSP) [Z/H]SSP [α/Fe]SSP
a b σ a b σ a b σ Notes
1.14±0.09 −1.59±0.13 0.22 0.31±0.04 −0.62±0.06 0.10 0.37±0.03 −0.61±0.04 0.06 Re/8
0.93±0.08 −1.07±0.11 0.20 0.45±0.04 −1.09±0.06 0.10 0.33±0.03 −0.49±0.04 0.07 Re/2
0.83±0.08 −0.83±0.11 0.19 0.45±0.04 −1.16±0.06 0.10 0.31±0.03 −0.44±0.05 0.08 Re
(ii) SFH=alog (σe)+b(Fig.9)
log (AgeSFH) [Z/H]SFH t50
a b σ a b σ a b σ Notes
0.54±0.04 −0.12±0.06 0.10 0.63±0.04 −1.52±0.06 0.09 −10.47±0.76 25.30±1.11 1.93 Re
(iii) SSP=alog (MJAM)+b(Fig.10, left)
log (AgeSSP) [Z/H]SSP [α/Fe]SSP
a b σ a b σ a b σ Notes
0.25±0.03 −1.70±0.10 0.21 0.12±0.02 −1.49±0.05 0.11 0.08±0.01 −0.66±0.04 0.08 Re
(iv) SFH=alog (MJAM)+b(Fig.10, right)
log (AgeSFH) [Z/H]SFH t50
a b σ a b σ a b σ Notes
0.15±0.02 −0.60±0.05 0.12 0.21±0.01 −2.39±0.05 0.09 −2.94±0.32 34.45±1.04 2.13 Re
(v) SSP=alog (σe)+b(Fig.11, kinematic classes)
log (AgeSSP) [Z/H]SSP [α/Fe]SSP
a b σ a b σ a b σ Notes
0.97±0.09 −1.12±0.12 0.20 0.53±0.05 −1.34±0.07 0.10 0.24±0.04 −0.28±0.06 0.09 Regular rotators 0.82±0.14 −0.81±0.20 0.17 0.74±0.10 −1.86±0.14 0.12 0.17±0.07 −0.14±0.10 0.09 Non-regular rotators 0.93±0.07 −1.06±0.11 0.20 0.57±0.04 −1.43±0.06 0.12 0.22±0.03 −0.25±0.05 0.09 All (inc. low-Fe)
(vi) SSP=alog (σe)+b(Fig.12, Virgo members)
log (AgeSSP) [Z/H]SSP [α/Fe]SSP
a b σ a b σ a b σ Notes
0.51±0.11 −0.06±0.16 0.14 0.48±0.07 −1.23±0.10 0.08 0.25±0.05 −0.30±0.07 0.06 Members 0.96±0.09 −1.14±0.13 0.18 0.44±0.05 −1.14±0.07 0.10 0.36±0.04 −0.57±0.06 0.08 Non-members
Note:the above table gives the parameters for the linear fits shown in the figures indicated in the table. The fits were made using the outlier-resistant two-variable linear regression method implemented in theIDLroutine ‘robust_linefit.pro’ of theIDLNASA Astronomy Library (Landsman1993). Theσ column gives the standard deviation of the fit to the ATLAS3Ddata. The ‘Notes’ column indicates the aperture size and relevant subsamples used in the fit. If no aperture size is given,Reis assumed.
again that young stars, when present, are preferentially found in the central regions of the low-velocity-dispersion galaxies. The [Z/H]–
σ relation becomes steeper and the average metallicity decreases from around solar forRe/8 to−0.2 withinRe, showing that ETGs are only metal-rich in their central regions, and are actually rather metal-poor objects when considered on the scales of one effective radius. Enhancement of alpha elements does not show much change considering larger apertures, although we remark that the scatter of the [α/Fe]–σrelation increases by 15 per cent as we go fromRe/8 to
Re, unlike for age and metallicity, which become 15 and 10 per cent
tighter, respectively.
4.2 Mass-weighted parameters versus velocity dispersion
Fig. 9presents the mass-weighted age and total metallicity de-rived from the spectral-fitting technique as described in Section 2.5. The spectrum fitted is integrated within an effective radius, making these values directly comparable to the Re aperture of the previ-ous sections. The general trends are similar: age and metallicity increase with velocity dispersion. However, the correlation with mass-weighted age is significantly tighter than with SSP age, show-ing a factor 2.6 less scatter (though with a somewhat smaller range in age).
We also show in Fig.9the median-binned mass-weighted ages to illustrate better the general trend, which suggests a possible break in the slope of the relation at velocity dispersions higher than ≈160 km s−1. We caution, however, that this is largely a result of limiting the maximum age of the stellar population mod-els to 14 Gyr. Including the maximum-aged MIUSCAT templates (17.8 Gyr) in the SFH removes any significant deviation from a linear relation of mass-weighted age with log (σe). In addition, by fitting a linear relation to points below the apparent break, the extrap-olated age and scatter at the highest velocity dispersion is 18±4 Gyr – only mildly inconsistent with the fiducial age of the Universe. This suggests that a linear relation is indeed an appropriate choice. We return to this issue in Section 4.4.
The metallicity trend is remarkably similar considering the vastly different approaches and models used. These results give direct em-pirical confirmation of the fact that ETGs are overwhelmingly com-posed of old stars, but in general have a small (but non-negligible) mass-fraction of younger stars that contribute disproportionately to the integrated light of the galaxy – a fact inferred from early SSP analyses Gonz´alez (1993); Trager et al. (2000) and shown un-ambiguously withGALEXUV colours (Kaviraj et al.2007). We consider this more quantitatively in Section 5.1.
The almost negligible change in the metallicity trend also con-firms the insensitivity of SSP-equivalent metallicity to mixed
at University of St Andrews on April 7, 2015
http://mnras.oxfordjournals.org/
Figure 8. SSP parameters for the three apertures as a function of log (σe). Magenta points are the galaxies exhibiting low metallicity as described in Section 2.3.
Dashed lines on theRe/2 aperture plots show the relations from Thomas et al. (2010), which have a comparable aperture size (see text for details). The red line
shows theRe/2 age trend when fitting only galaxies older than 2.5 Gyr, as done by Thomas et al. (2010). Solid lines are robust linear fits. Magenta symbols
indicate the low-Fe objects highlighted in Section 2.5. Solid lines are robust linear fits to the black points. Parameters of these fits are given in Table5. Inset histograms show the residuals about the global best fit.
populations as discussed above. The main differences are a slight reduction in scatter and a steepening of the relation, likely due to reduced uncertainties by fitting the whole spectrum, and a reduced bias in the contribution of young stars responsible for boosting the metallicity in the SSP relations.
4.3 SSP parameters versus dynamical mass
Fig.10(left) presents the SSP population trends as measured against
MJAM for the 1Re aperture (the smaller apertures follow similar relative differences as those mentioned in the previous section). We find that the general trends of population parameters are consistent with the picture derived from velocity dispersion alone, such that lower mass galaxies tend to show younger ages, lower metallicities, and lower abundance ratios.
The relations with mass are generally more shallow compared to the trends withσe, especially in age and metallicity, owing to two key differences. Firstly, galaxies with the lowest masses span almost
the full range of ages and metallicities, whereas at the lowest veloc-ity dispersion, galaxies are generally the youngest and most metal poor of the sample. Secondly, the high-mass regime where galaxies span a narrow range of age and metallicity (MJAM >1011 M) accounts for about one-third of the mass range in the sample. For velocity dispersion, this low-scatter region (log (σ)>2.3) is less than a quarter of the sample range. When we move to the mass-based relations, the velocity dispersion distributions are essentially ‘stretched out’ among the older objects, reducing the slope of the relations. Both effects are a direct consequence of the distribution of galaxies on the Mass Plane.
Previous studies have found tighter relations of stellar population parameters with velocity dispersion than with mass (Graves & Faber
2010; Wake, van Dokkum & Franx2012), as we also qualitatively highlighted on the Mass Plane. Inset histograms in Figs8–10show the dispersions around our linear fits and quantify their standard deviations (see Table5for the fit parameters and standard devia-tions). We likewise find that the SSP residuals are somewhat tighter
at University of St Andrews on April 7, 2015
http://mnras.oxfordjournals.org/
Figure 9. Mass-weighted age, metallicity, and half-mass formation time of the ATLAS3Dsample plotted against velocity dispersion. Magenta points
are the Fe-poor objects as per Fig.8. Inset histograms show the residuals about the global best fit. Solid lines are robust linear fits to the black points. Parameters of these fits are given in Table5.
usingσethan when using mass, although we note that the formal difference is small (0.01 dex in age and 0.02 in [Z/H]). We note that the improvement ofσeover mass as a linear indicator of popu-lation parameters is significantly more apparent on the Mass Plane directly than by comparing the residuals of its edge-on projections, where intrinsic scatter makes the interpretation less clear.
4.4 Mass-weighted parameters versus dynamical mass
Fig.10(right) presents the mass-weighted age, metallicity, and half-mass formation timet50, as a function ofMJAM. We see similar trends as before, but there is now a rather clear change in the behaviour of age as a function of mass. Rather than being approximated as a linear increase of age with mass, albeit with a large scatter at lower masses, the trend of mass-weighted age and mass shows a distinct non-linearity. This is made more apparent by considering the median value within mass bins, as indicated by the green points in Fig.10. The binned mass-weighted ages show a distinct departure
from the linear fit, whereas the binned SSP values remain reasonably approximated by the best-fitting line.
To characterize this bimodal trend in more detail, we fit a double power law on the median-binned mass-weighted values of the form
log(Age)=2(β−γ)/αlog(Ageb) M
Mb
γ
1+
M b
M
αγ−αβ
(4)
based on the ‘Nuker’ law for surface brightness profile fitting (Lauer et al.1995). The best-fitting curve has a low-mass slopeγ= −0.18, a high-mass slope ofβ = −0.016, and a characteristic mass of
Mb=3.1×10¹⁰ Mat a ‘break’ age of Ageb=11.8 Gyr that marks the transition of the two slopes, with a ‘sharpness’ parameter for the break in slope given by α = 10. This bimodal trend is also evident in the other age relations, but to a lesser extent. Using the mass-weighted age, the presence of a narrow sequence of old galaxies can be seen above the transition mass, with a distinct change in the mass-scaling behaviour below this mass. This transition mass is the same as the inflection point of the ‘zone of exclusion’ (ZOE) determined by Cappellari et al. (2013b), which defines the
low-Rmaj
e envelope of the Mass Plane as shown in Figs 6 and 7. It also corresponds to the characteristic mass marking the transition between star-forming and passive galaxies found by Kauffmann et al. (2003), as well as a possible change in slope of the relation between supermassive black hole masses and their host galaxy mass (Scott, Graham & Schombert2013). Considering the population trends on the Mass Plane, the correspondence of this ‘knee’ in the age–mass relation to the inflection of the ZOE on the mass–size plane becomes obvious: below this mass, the low-Rmaj
e envelope turns towards larger galaxies, with correspondingly younger ages and longer formation time-scales.
We note again that we impose an upper age limit of 14 Gyr on the model templates used, in accordance with the fiducial age of the Universe (Planck Collaboration I2014). This puts a ‘ceiling’ on the mass-weighted age values, as discussed previously in Sec-tion 4.2 for the trend of mass-weighted age with log (σe) (see Fig.9). However, unlike the trend with log (σe), including the full available age range of the MIUSCAT spectral models (up to 17.8 Gyr) in the spectral fit doesnotremove the bimodality. There is a slightly increased spread in mass-weighted age at the oldest values, but the mass at which the ages transition to a narrow range of old values is unchanged, and the clear bimodal shape remains. Moreover, extrap-olating the linear trend in Fig.10from masses below the transition mass results in strongly unphysical ages (≈30 Gyr) at our highest masses, suggesting that the departure from a simple linear trend is not artificial.
Mass-weighted metallicity shows a tight relation withMJAM, with only slightly higher scatter than with velocity dispersion. This sup-ports the interpretation from the Mass Plane that iso-surfaces of constant metallicity run steeply with mass, especially for mass-weighted metallicity.
The half-mass formation time is distributed similarly to the mass-weighted age, being strongly related to that property. We include it here for completeness.
4.5 Kinematic class
One of the key findings of the SAURON survey was the discov-ery that ETGs have essentially two categories of global dynamics, characterized as ‘fast’ and ‘slow’ rotators (Emsellem et al.2007). Fast rotators have extended regular rotation fields well described as inclined discs, though they are clearly not ‘thin-disc’ systems,
at University of St Andrews on April 7, 2015
http://mnras.oxfordjournals.org/
Figure 10. Left: SSP parameters within one effective radius as a function of dynamical mass,MJAM. Right: mass-weighted age, metallicity, and half-mass
formation time, as a function ofMJAM. Magenta points indicate the Fe-poor objects as in previous plots. Solid lines are robust linear fits to the black points.
Parameters of these fits are given in Table5. Inset histograms show the residuals about the global best fit. Green points indicate the median values within bins of 20 neighbouring points, with error bars indicating the ‘error’ on the median, computed asσ/√N, whereσis the dispersion within the bin, andN=20. The red line indicates a double power-law fit to the binned values, as described in Section 4.4.
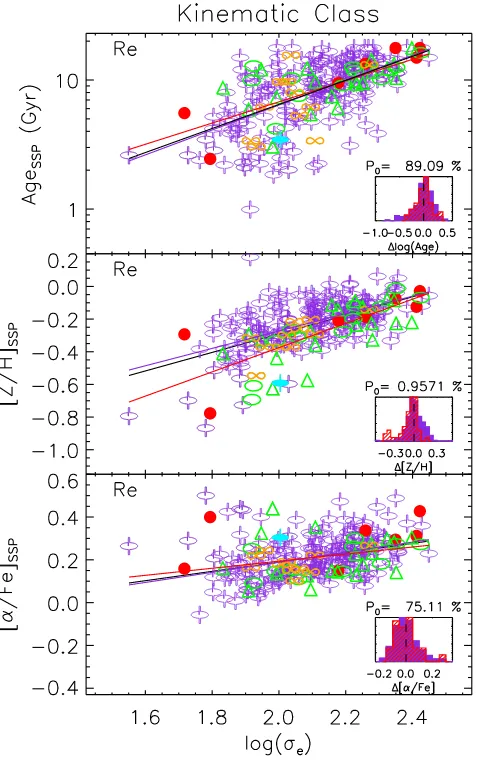
having significant velocity dispersion also. Slow rotators do not show regular rotation, and instead show counter-rotating structures, decoupled cores, or no rotation at all. In Emsellem et al. (2011), we expand on this work with the complete ATLAS3Dsample, using the quantityλRas a way of separating these two classes of ETG. In Krajnovi´c et al. (2011), we have shown that, applying the Fourier analysis technique of kinemetry (Krajnovi´c et al.2006), we can further classify the velocity fields of galaxies, giving ‘regular’ rota-tors (corresponding very closely to the fast rotarota-tors, which show disc-like rotation), and ‘non-regular’ rotators (corresponding closely to the slow rotators, which show various substructures that cannot be described by simple disc-like rotation).
Fig. 11presents the SSP–σe relations as before, but this time indicating the main kinematic classes described in Krajnovi´c et al. (2011). From this figure, it can be seen that the various kinematic classes span broad ranges in velocity dispersion and stellar popu-lation properties. Non-regular rotators are on average slightly older than regular rotators, although we note there are several examples of non-regular rotators among the youngest galaxies in our sample. There is little discernible difference in abundance ratios, though we note that the massive non-rotators are among the most enhanced objects in our sample. The most noticeable difference between the
regular and regular rotators is with metallicity, where the non-regular rotators appear to fall generally on or below the global trend, giving rise to a moderately significant difference in the resid-ual distributions around the global linear fit as quantified by the Kolmogorov–Smirnov (K–S) test probability,P0, indicated in the inset histograms. This implies that non-regular rotators have expe-rienced less metallicity enrichment, on average, than their regular-rotating counterparts of the same mass. In Young et al. (2011), we also found that non-regular rotators typically have lower mass fractions and detection rates of molecular gas (though there are no-table exceptions at low-velocity-dispersion values, e.g. NGC1222, NGC3073). Less molecular gas implies less star formation, which is the mechanism for enriching the stellar population with metals.
The offset in metallicity at fixed velocity dispersion can be in-terpreted conversely as an offset in velocity dispersion for a fixed metallicity, which could arise as a result of a major merger. The metallicity offset is also seen in the relation withMJAM. Interpreting the offset as one of increased mass and velocity dispersion at fixed metallicity, we find that the linear-fit mass– (σ–) metallicity relation is offset by 0.3 dex in log (MJAM) corresponding to a doubling of the mass, with a corresponding shift of 0.1 dex in log (σ). These shifts are consistent with the predictions of Hilz et al. (2012) for
at University of St Andrews on April 7, 2015
http://mnras.oxfordjournals.org/
![Figure 2. Index–index diagram for our sample using the indices H[MgFe50]SSPs with constant ages, metallicities, and solar abundance ratios](https://thumb-us.123doks.com/thumbv2/123dok_us/8564496.366655/6.595.48.288.53.455/figure-index-diagram-sample-indices-constant-metallicities-abundance.webp)