Copyright © 2011 SciRes. DOI:10.4236/psych.2011.23038
Psychometric Properties of the Greek Version of the Test
Anxiety Inventory
Georgia Papantoniou
1, Despina Moraitou
2, Dimitra Filippidou
11University of Ioannina, Ioannina, Greece; 2Aristotle University of Thessaloniki, Thessaloniki, Greece. Email: [email protected], [email protected], [email protected] Received January 30th, 2011; revised March 15th, 2011; accepted April 20th, 2011.
The present study examined the psychometric properties of the Greek version of Spielberger (1980) self-report measure of test anxiety, the Test Anxiety Inventory (TAI). The total sample consisted of 231 undergraduate stu-dents (124 male, 107 female). The results verified the well established two-factor structure for the TAI. The two factors represented the Worry (TAI-W) and Emotionality (TAI-E) subscales, respectively. Furthermore, on the bases of the confirmatory factor analyses, using either the set of 20 items or the set of 16 items, we found con-vincing support for the existing relationship between the two subscales of the Test Anxiety Inventory. The in-ternal consistency of the twenty-item TAI-T scale and for the eight-item Worry and Emotionality subscales ranged from Cronbach’s α = .81 to .94. The G-TAI and its subscales showed differential statistically significant relationships with a self-report measure of cognitive interference.
Keywords: Psychometrics, Test Anxiety, Greece
Introduction
Education is vital for every country in the world, and Greece is not an exception as a strong and effective education can help boost the development of the country. As testing is a common practice in contemporary society, like Greek society, for mak- ing important decisions about an individual’s status in school, college, and work (Lowe, Lee, Witteborg, Prichard, Luhr, Cullinan, Mildren, Raad, Cornelius, & Janik, 2008; Zeidner, 1998), it is no wonder that test anxiety is a significant educa- tional problem affecting many of students in our schools and colleges.
Students with test anxiety feel tense, fearful and worried in evaluative situations (Spielberger, Gonzalez, Taylor, Anton, Algaze, Ross, & Westberry, 1979; Spielberger & Vagg, 1995). Research relating test anxiety to academic performance has established that high levels of test anxiety are associated with lower levels of students’ learning and performance (Sub & Prabha, 2003). Often test-anxious students at all levels of edu- cation perform more poorly on standardized tests (Everson, Millsap, & Rodriguez, 1991) and receive poorer grades (Chapell, Blanding, Silverstein, Takahashi, Newman, Gubi, & McCann, 2005) than they ought to because anxiety and other test-taking deficiencies interfere with their performance, either directly or indirectly (Efklides, Papadaki, Papantoniou, & Ki- osseoglou, 1997, 1999; Lowe et al., 2008; Metallidou & Vla- chou, 2007).
In order to assess individual differences in test anxiety, Spielberger developed the Test Anxiety Inventory (TAI; Spiel-berger, 1980) which is a self-report instrument. The TAI is one of the most widely used of the test anxiety inventories as it has been translated or adapted for many populations (see Ware, Galassi, & Dew, 1990).
Spielberger had two major goals in developing the TAI: (1)
to construct a brief, valid self-report measure of the test anxiety which was highly correlated with other measures of the con-struct and (2) to use factor analytic procedures to measure the emotionality and worry components of the test anxiety identi-fied by Liebert and Morris (1967). Emotionality refers to per-ceived autonomic reactions (physiological arousal) evoked by evaluative stress (Spielberger & Vagg, 1995), whereas worry refers to cognitive concerns about the consequences of failure (Morris & Liebert, 1969). Worry tends to be associated with performance decrements on cognitive and intellectual tasks, but emotionality is not (see Hembree, 1988; Hong, 1998; Spielber-ger et al., 1979; Van der Ploeg, 1984).
For the TAI’s original development, exploratory factors ana-lytic procedures (principal axis factoring with varimax rotation) have been used by its constructors. According to them, the TAI consists of 20 items, and contains two subscales measuring worry and emotionality. Each subscale is defined by eight items, with the remaining four (1, 12, 13, & 19) items not ordinarily included in subscale scores as the results did not indicate clear patterns favoring either subscale (Spielberger et al., 1979).
factors (Benson & Tippets, 1990; Everson, Millsap, & Rodri-guez, 1991; Gierl & Rogers, 1996; Ware, Galassi, & Dew, 1990). Although the 20-item TAI had been administered in Greek samples (Hatzidimitriadou, 1995; Papantoniou & Efklides, 2004; Vasilaki & Vamvoukas, 1997) and its internal consis-tency had been estimated, to our knowledge, neither the 20-item, nor the 16-item TAI have been tested extensively re-garding their factor structure in Greek population. Hence, the main objective of this study was to examine the psychometric properties of the Greek long and short version of the TAI (fac-tor structure, internal consistency and convergent validity) in order to determine whether it is a useful tool for the study of test anxiety in the Greek cultural context.
Based on previous work, we hypothesized that the G-TAI (both the long and the short version) would have the same two- factor structure of Worry and Emotionality. There also were expected interrelations between these factors (Hypothesis 1).
The TAI total score and both subscales have been shown to have high internal consistency in previous research (Benson & Tippets, 1990; Hatzidimitriadou, 1995; Spielberger et al., 1979; Ware, Galassi, & Dew, 1990). Thus we hypothesized that the Greek instrument would show similar range of internal consis-tency (Hypothesis 2).
The relationship between the TAI and its subscales with other anxiety measures (e.g., Sarason’s Test Anxiety Scale, TAS; Liebert & Morris’s Worry and Emotionality Question-naire, WEQ; the STAI State and Trait Anxiety scales, and the STAI State Anxiety scale administered under examination stress conditions) all provide evidence of convergent validity (Spielberger et al., 1979). In the present study, in terms of con-vergent validity, we expected that the G-TAI would be corre-lated positively with a self-report measure of cognitive inter-ference, namely, the Cognitive Interference Questionnaire, CIQ (Sarason, Sarason, Keefe, Hayes, & Shearin, 1986) (Hypothesis 3).
Method
Participants
The total sample consisted of 231 volunteer undergraduate students (124 male, 107 female) attending Schools of social sciences, mathematics, physical sciences, informatics, engi-neering and life sciences at Greek Universities.
Instruments
The Test Anxiety Inventory (TAI). The TAI is a self-report psychometric scale that was designed by Spielberger (1980) to “measure individual differences in test anxiety as a situa-tion-specific personality trait”. The TAI was developed for use with adolescents and adults and consists of 20 items that ask respondents to indicate how they generally feel in test situations by reporting the frequency that they experience specific symp-toms of anxiety before, during and after examinations. Re-spondents rate their responses on a 4-point Likert-type scale. The four response choices are: (1) almost never, (2) sometimes, (3) often, and (4) almost always. Values of item 1 are reversed. The TAI has two subscales that assess worry and emotionality as major components of test anxiety. Each subscale consists of eight items with the remaining four items not ordinarily in-cluded in either subscale. The eight items that form the TAI Worry subscale (TAI-W) are: 3, 4, 5, 6, 7, 14, 17, and 20. The
eight items that constitute the TAI Emotionality subscale (TAI-E) are: 2, 8, 9, 10, 11, 15, 16, and 18. The TAI yields a total score based on all twenty items, a score for Worry based on the subset of eight items and a score for Emotionality based on the other eight-item subscale.
The TAI had been translated into Greek by Hatzidimitriadou (1995; Stogiannidou, Kiosseoglou, & Hatzidimitriadou, 1999) and its reliability had also been assessed. For Hatzidimitriadou’s (1995) sample (N = 296 adolescents, 161 male and 135 female), Cronbach’s α values had been .91 for the twenty-item TAI-T scale, .81 for the eight-item worry subscale, and .86 for the eight-item emotionality subscale. For Vasilaki and Vamvoukas’ (1997) sample (N = 424 elementary school pupils), Cronbach’s
α value had been .80 for the twenty-item TAI-T scale. For Pa-pantoniou and Efklides’ (2004) sample (N = 390 adolescents and young adults, 170 male and 220 female), Cronbach’s α values had been .90 for the twenty-item TAI-T scale, .75 for the eight-item worry subscale, and .86 for the eight-item emotion-ality subscale. However, since none of the aforementioned studies was an adaptation study of the TAI in Greek population, in this study it was preferred the original version of the TAI to be translated into Greek by the first author and back translated by one independent bilingual psychologist. The back-translated questionnaire was then compared to the original and a few mi-nor modifications were applied.
The Cognitive Interference Questionnaire (CIQ). The CIQ (Sarason et al., 1986) is a 22-item questionnaire designed to measure, following performance on a task, the degree to which people experienced various types of thoughts while working on it, and the degree to which these thoughts are viewed as inter-fering with concentration. According to its constructors (see Sarason et al., 1986), the CIQ measures two types of thoughts, task-oriented worries and off-task thoughts. The “Task-oriented Worries” dimension was chosen to test the convergent validity of the G-TAI. For the purposes of previous studies, the first 10 items of the CIQ, providing post-performance reports of the frequency of occurrence of task-oriented worries, had been translated into Greek by the first author; the single factor struc-ture of the Greek version of the “Task-oriented Worries” di-mension of the CIQ was verified with CFA and its reliability was also assessed (see Papantoniou & Efklides, 2004; Papanto-niou, Moraitou, Dinou, & Katsadima, 2010). Participants were asked to indicate the frequency of occurrence of task-related thoughts that intruded while they were working on the exami-nation in an introductory course of their School, on a 5-point scale from 1 (never) to 5 (very often). Cronbach’s α was ac-ceptable: .83 for this sample.
Procedure
Statistical Analysis
Although exploratory factor analysis is useful in test con-struction, it does not provide an especially convincing test of the factorial structure of scale as it does not permit the investi-gator to hypothesize and confirm which of a series of alterna-tive plausible latent factor models best fits the data. Therefore we used confirmatory factor analyses to compare the factor structures, implied for the TAI by previous theory and empiri-cal research, using either the 20 or the 16 items. Structural equation models were conducted in EQS Version 6.1 and per-formed on covariance matrix using the Maximum Likelihood estimation procedure (Bentler, 2005). Starting from the covari-ance matrix, the viability of a two-factor model composed of correlated Worry and Emotionality factors, inferred from Spielberger et al. (1979), was tested in sequential fashion against a series of logically nested alternative models.
A non-statistical significance of the χ2-test indicates that the implied theoretical model significantly reproduces the sample variance-covariance relationships in the matrix. Since this test is sensitive to sample size, model fit was also evaluated by using the root mean squared error of approximation (RMSEA). The RMSEA tests how well the model would fit the population covariance matrix. A rule of thumb is that RMSEA < .05 indi-cates close approximate fit and values between .05 and .08 suggest reasonable error of approximation (Kline, 2005). The Comparative Fit Index (CFI) which is one of the indexes as-sessing the relative improvement in fit of the researcher’s model compared with a baseline model was also used. A rule of thumb for the CFI is that values greater than .90 may indicate reasonably good fit of the researcher’s model (Kline, 2005). In addition, model fit was evaluated by using the standardized root mean squared residual (SRMR). The SRMR is a measure of the mean absolute correlation residual, the overall difference be-tween the observed and the predicted correlations. Values of the SRMR less than .10 are generally considered favourable (Kline, 2005).
As regards the sample size requirements, for SEM techniques, it is recommended as a rule of thumb that there be at least five observations per estimated parameter (Hair, Anderson, Tatham, & Black, 1998). A total of 20 parameters were estimated in confirmatory factor model. Hence, the sample size for path model had to exceed 100. Thus, the sample size exceeded the minimum recommended level for performing confirmatory factor analysis.
Results
Initially, we used confirmatory factor analyses to examine
the factor structure, established by Spielberger et al. (1979) in the TAI Manual, using the 20 items. More specifically, we compare the following three factor structures: Model A, a one-factor model in which all twenty items loaded on a single latent factor; Model B, a two-factor model in which all sixteen items of the two subscales, Worry and Emotionality, loaded on a first-order latent factor. Both this first-order latent factor and the four items, that are not included in the Worry and Emotion-ality subscales, loaded on a second-order latent factor called TAI-T; and Model C, a three-factor model in which the two subscales, Worry and Emotionality, were first-order latent fac-tors. Both these first-order latent factors and the four items, that are not included in them, loaded on a second-order latent factor called TAI-T.
For each confirmatory factor analysis (CFA) model, a single path was freed from the relevant factor to each item. No cross loadings were allowed. In the last model containing more than one factor, latent factors were defined without any covariance between them as they loaded on a second-order latent factor. For all models, the metric was set by fixing factor variances to 1.0. The fits of the models compared directly using chi-square difference tests.
As shown in Table 1, for all three models, the chi-square goodness-of-fit statistic was significant (p < 0.001), thus lead-ing to the rejection of the null hypothesis of good fit. Therefore information from other indicators of fit was assessed. The RMSEA fell in the marginal range of .05 - .08 (see Kline, 2005) indicating at least adequate fit for these models based on this criterion. Specifically, the RMSEA was below .08 for the single and the two-factor models (Model A: RMSEA = .074, Model B: RMSEA = .074) and below .07 for the three-factor model (Model C: RMSEA = .069). Standardized root-mean- square residual (SRMR) values were below .08 (ranged from .050 to .053) indicating also good fit for all models tested. All CFI values also fell in the marginal range of .90 - .95 (see Brown, 2006). In conclusion, the fit indices of the final model (Model C) indicated that the final model [χ2(168, Ν= 231) = 352.73, p = .000, χ2/df = 2.10, CFI = .93, RMSEA = .069, SRMR = .050] fits the data better than the rest models of this set of analysis (Brown, 2006).
Furthermore, we compared Models A and B with Model C using the chi-square difference test. The results showed that the
Δχ2 was significant in all cases: Model A & Model C: Δχ2(Δdf = 2) = 30.66, p < .001; Model B & Model C: Δχ2(Δdf = 1) = 30.29, p < .001. Thus, on the basis of the chi-square difference tests, comparisons of CFI, and the low value of its RMSEA and SRMR, the best-fitting model was unambiguously the three- factor model with the first-order latent factors (Worry & Emo-tionality) and the four items, that are not included in them,
Table 1.
Summary of fit tests for Confirmatory Factor Analysis Models with 20 ΤΑΙ items.
Model (factor) χ2 P CFI χ2/df SRMR RMSEA
Model A (Single factor) χ2(170, N = 231) = 383.39 < .001 .914 2.26 .053 .074 Model B (Two-factors: one first-order and
one second-order latent factors) χ2(169, N = 231) = 383.02 < .001 .914 2.27 .053 .074 Model C (Three-factors: two first-order
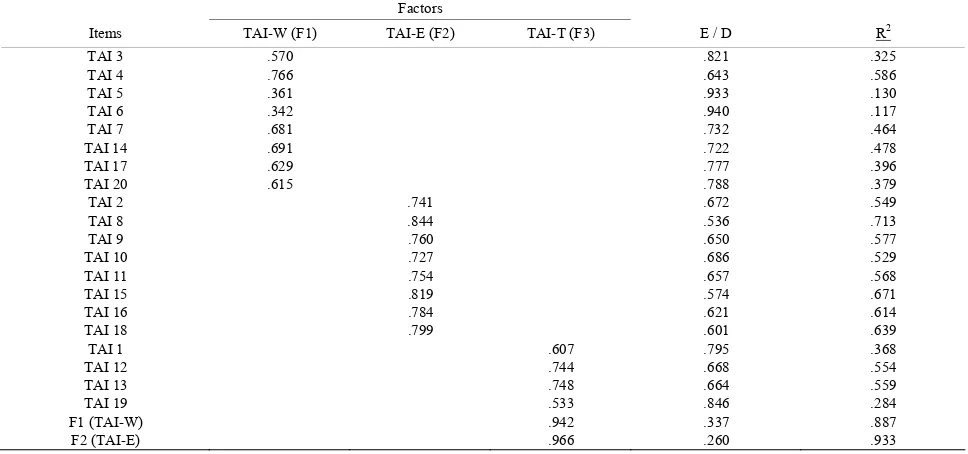
[image:3.595.56.542.641.723.2]loaded on a second-order latent factor called TAI-T (Model C). Moreover, this model has also the advantage of previous theo-retical and empirical validation (see Spielberger et al., 1979). Model C is displayed in Table 2.
Consequently, a second set of confirmatory factor analyses of Models A - C was performed, using only the sixteen TAI items in the Worry and Emotionality subscales. In this revised item set, we excluded the four items (Items 1, 12, 13, & 19) which were not used in computing scores on the Worry and Emotionality subscales because double loadings on these items are reported in the TAI Manual.
More specifically, the CFA models that were tested on the revised set of 16 items were the following: Model A, a one- factor model in which all sixteen items loaded on a single latent factor; Model B, a two-factor model in which the two subscales, Worry and Emotionality, were first-order latent factors. In this model CFA was performed twice. At the first performance, latent factors were defined without any covariance between them (Measurement model: Model B1). At the second per-formance, latent factors were allowed to freely intercorrelate (Structural model: Model B2); and Model C, a three-factor model in which the two subscales, Worry and Emotionality, were first-order latent factors that loaded on a second-order latent factor called TAI.
However, during our trial to test Model C, the EQS program (Bentler, 2005) warned that a parameter estimate is not inside the specific boundaries. More specifically, the disturbance of the first-order Worry factor was being held at the lower bound-ary (.000) specified for the problem. The constraint of this pa-rameter at lower boundary indicates a solution which is not acceptable: that the first-order Worry factor could be perfectly predicted from the second-order latent factor called TAI. In addition, as shown in Table 3, Measurement Model B1 would clearly be rejected, and in the interests of saving space, these
results are not detailed further.
As regards the rest two models, using the sixteen item set, the chi-square goodness-of-fit tests were statistically significant for them (for Models A and B2, p < .001), resulting in a rejec-tion of the null hypothesis of good fit. Therefore informarejec-tion from other indicators of fit was assessed. The CFI values fell in the marginal range of .90 - .95 (see Brown, 2006) and the RMSEA fell in the marginal range of .05 - .08 (see Kline, 2005) indicating adequate fit for these models based on these criteria (Model A: RMSEA = .080, Model B1: RMSEA = .072). Stan-dardized root-mean-square residual (SRMR) values were be-low .08 (ranged from .050 to .054) indicating also good fit for the models tested. In conclusion, the fit indices of Model B2 indicated that this model [χ2(103, Ν= 231) = 224.69, p = .000,
χ2/df = 2.18, CFI = .94, RMSEA = .072, SRMR = 0.050] fits the data better than Model A of this set of analysis (Brown, 2006).
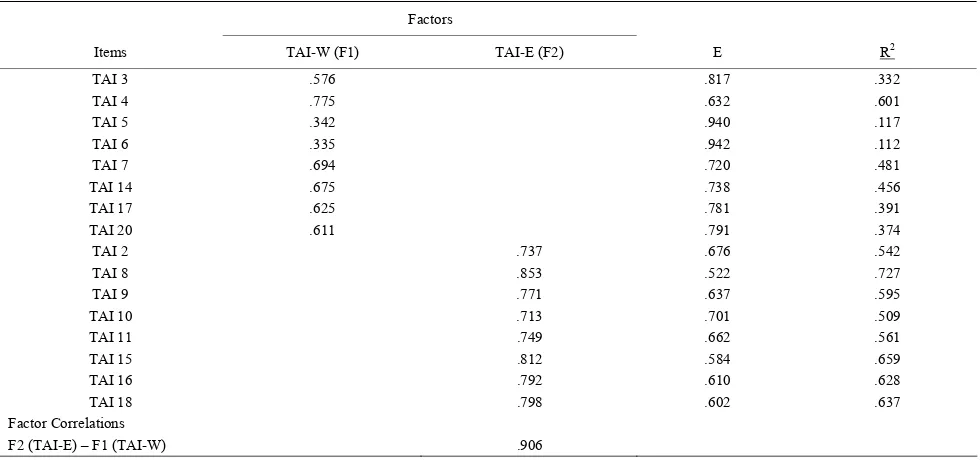
Furthermore, we compared Model A with Model B2 using the chi-square difference test. The results showed that the Δχ2 was significant: Model A & Model B2: Δχ2(Δdf = 1) = 30.83, p < .001. Thus, on the basis of the chi-square difference tests, comparisons of CFI, and the low value of its RMSEA and SRMR, the best-fitting model was unambiguously the two- factor (Worry & Emotionality) model with interrelations be-tween them (Structural Model B2). Similarly to Model C of the first set of confirmatory factor analyses, this model also has the advantage of previous theoretical and empirical validation (see Benson & Tippets, 1990; Ware, Galassi, & Dew, 1990). Model B2 is displayed in Table 4.
In conclusion, the comparison between the best-fitting model of the first set of confirmatory factor analyses, which were performed using the 20 TAI items (Model C: Three-factors: two first-order and one second-order latent factors), and the best-fitting model of the second set of confirmatory factor
Table 2.
The best-fitting model (Model C) in the structure of the 20-item version of the Greek Test Anxiety Inventory (standardized solution). Factors
Items TAI-W (F1) TAI-E (F2) TAI-T (F3) E / D R2
TAI 3 .570 .821 .325
TAI 4 .766 .643 .586
TAI 5 .361 .933 .130
TAI 6 .342 .940 .117
TAI 7 .681 .732 .464
TAI 14 .691 .722 .478
TAI 17 .629 .777 .396
TAI 20 .615 .788 .379
TAI 2 .741 .672 .549
TAI 8 .844 .536 .713
TAI 9 .760 .650 .577
TAI 10 .727 .686 .529
TAI 11 .754 .657 .568
TAI 15 .819 .574 .671
TAI 16 .784 .621 .614
TAI 18 .799 .601 .639
TAI 1 .607 .795 .368
TAI 12 .744 .668 .554
TAI 13 .748 .664 .559
TAI 19 .533 .846 .284
F1 (TAI-W) .942 .337 .887
F2 (TAI-E) .966 .260 .933
[image:4.595.56.540.485.712.2]Table 3.
Summary of fit tests for Confirmatory Factor Analysis Models with 16 ΤΑΙ items.
Model (factor) χ2 P CFI χ2/df SRMR RMSEA
Model A (Single factor) χ2(104, N = 231) = 255.52 < .001 .922 2.46 .054 .080 Model B1 (Two-factors: two first-order latent
factors) χ
2(104, N = 231) = 450.68 < .001 .820 4.33 .292 .120
Model B2 (Two factors: two first-order latent
factors + interrelation between factors) χ2(103, N = 231) = 224.69 < .001 .937 2.18 .050 .072 Model C (Three-factors: two first-order and
[image:5.595.54.542.108.222.2]one second-order latent factors)
Table 4.
The best-fitting model (Model B2) in the structure of the 16-item version of the Greek Test Anxiety Inventory (standardized solution). Factors
Items TAI-W (F1) TAI-E (F2) E R2
TAI 3 .576 .817 .332
TAI 4 .775 .632 .601
TAI 5 .342 .940 .117
TAI 6 .335 .942 .112
TAI 7 .694 .720 .481
TAI 14 .675 .738 .456
TAI 17 .625 .781 .391
TAI 20 .611 .791 .374
TAI 2 .737 .676 .542
TAI 8 .853 .522 .727
TAI 9 .771 .637 .595
TAI 10 .713 .701 .509
TAI 11 .749 .662 .561
TAI 15 .812 .584 .659
TAI 16 .792 .610 .628
TAI 18 .798 .602 .637
Factor Correlations
F2 (TAI-E) – F1 (TAI-W) .906
Note: TAI-W = The TAI-Worry factor; TAI-E = The TAI-Emotionality factor.
analyses, which were performed using only the 16 TAI items (Model B2: Two factors: two first-order latent factors + inter-relation between factors), on the basis of their NC (χ2/df) (Model C: NC = 2.10, Model B2: NC = 2.18), CFI (Model C: CFI = .925, Model B2: CFI = .937), RMSEA (Model C: RMSEA = .069, Model B2: RMSEA = .072), and SRMR (Model C: SRMR = .050, Model B2: SRMR = .050), suggests a good fit for both of the two models.
Reliability
Internal consistency was estimated, for the twenty-item TAI-T scale and for the eight-item worry and emotionality subscales, using Cronbach’s α coefficient. The values were .94, .81, and .92, respectively.
Convergent Validity
Pearson correlations between the G-TAI-T and its subscales TAI-W and TAI-E, on the one hand, and the CIQ, on the other,
were computed. Moderate positive correlations were found. The values were .46, .40, and .46, respectively (p < .01).
Discussion
The main aim of this study was to examine the psychometric properties of the Greek long and short version of the TAI; namely, the factor structure, internal consistency, and concur-rent validity.
[image:5.595.53.543.261.491.2]first-order latent factors. Both these first-order latent factors and the four items, that are not included in them, loaded on a second-order latent factor called TAI-T. Similarly, the best fitting model of the second set of confirmatory factor analyses, which were performed using only the 16 TAI items (Structural Model B2: Two-factors: two first-order latent factors + interre-lation between factors), assumed that the two subscales, Worry and Emotionality, were first-order latent factors with covari-ance between them. These findings confirm our Hypothesis 1, and they are consistent to previous work either on the original and revised English version (Benson & Tippets, 1990; Hedl, 1984; Spielberger et al., 1978, 1979; Ware, Galassi, & Dew, 1990) or on the original Canadian and German versions (Gierl & Rogers, 1996; Schwarzer, 1984) that assumed a positive correlation between the two subscales.
However, the results from this study indicate that the first- order latent factors loadings (.94 for the Worry and .97 for the Emotionality factor) on the second-order latent factor called TAI-T (Model C: Three-factors: two first-order and one sec-ond-order latent factors), as well as their interrelation (.91) (Structural Model B2: Two-factors: two first-order latent fac-tors + interrelation between facfac-tors) were higher than those typically reported in the literature (Everson, Millsap, & Rodri-guez, 1991; Schwarzer, 1984; Spielberger et al., 1978, 1979; Van der Ploeg, 1983). This magnitude of the covariance be-tween the latent Worry and Emotionality factors is comparable to that reported by Benson and Tippets (1990) and Ware, Ga-lassi, and Dew (1990). According to them, the higher interrela-tion might be attributed to the relatively higher age and greater heterogeneity of their samples as compared with other studies. Similarly to the aforementioned studies (Benson & Tippets, 1990; Ware, Galassi, & Dew, 1990), the current sample, which included undergraduate students from a variety of academic disciplines and class levels, was considerably older and more diverse than those used in the studies where moderate interrela-tion between the Worry and Emointerrela-tionality factors was reported.
Hypothesis 2 regarded the internal consistency of the Greek version of the TAI. The results were consistent to previous work either on the original and revised English version (Benson & Tippets, 1990; Spielberger et al., 1979; Ware, Galassi, & Dew, 1990) or on the 20-item Greek version (Hatzidimitriadou, 1995; Papantoniou & Efklides, 2004). In this study, as well as in previous studies, the internal consistency of the TAI total score and both subscales tend to be high (Cronbach’s α coeffi-cients were ranged from .81 to .94).
Hypothesis 3 regarded the concurrent validity of the G-TAI. The results were in the predicted direction, with the TAI-T, the Worry and the Emotionality factors associating positively with the measure of cognitive interference. This finding suggests that persons with high TAI Total, Worry and Emotionality scores are more disposed to report that they incurred task-ori- ented worries during performance of a recently completed task than persons with low scores on this measure. This is in accor-dance with research on cognitive interference (Sarason, Pierce, & Sarason, 1996) and test anxiety (Spielberger et al., 1979; see Zeidner, 1998). In conclusion, our study showed that the G-TAI-T, and its subscales TAI-W and TAI-E are moderately related to cognitive interference. Future studies aiming to ex-amine psychological properties of the G-TAI should investigate further its convergent and divergent validity with other
meas-ures that are, or have already been, in the procedure of adapta-tion in Greek populaadapta-tion, like STAI (Fountoulakis, Papadopou-lou, Kleanthous, PapadopouPapadopou-lou, Bizeli, Nimatoudis, Iakovides, & Kaprinis, 2006). Finally, given the inconsistencies with regard to gender differences in previous factor studies of the TAI (Benson & Tippets, 1990; Everson, Millsap, & Rodriguez, 1991; Gierl & Rogers, 1996; Hedl, 1984; Schwarzer, 1984; Spielberger et al., 1978, 1979; Van der Ploeg, 1984; Ware, Galassi, & Dew, 1990), the question arises as to whether the TAI measures the same construct to the same degree for both male and female participants. Therefore, future studies should also determine whether the two verified factor structures from this study are invariant across gender.
Although more research is needed to further validate the G-TAI and to replicate our current findings, the results of our study show that both the 20-item version and the 16-item ver-sion of the G-TAI are efficient instruments for measuring test anxiety in the Greek cultural context, as they are of equal psy-chometric strength in confirmatory factor analyses. As such, the two versions of the G-TAI provide an initial base in examining cross-cultural differences in test anxiety which, as being one of the negative activating test emotions, contributes to the under-standing of academic performance and self-regulated learning (see Efklides, 2011). Consequently, we recommend the 16-item version of the G-TAI, as an economical measure of worry and emotionality, and the 20-item version of the G-TAI, as a meas-ure that can further provide with a total test anxiety score. In conclusion, the short version of the G-TAI can be used for checking the impact of each test anxiety dimension on various cognitive, metacognitive, and volitional aspects of learning and achievement. In the same logic, the long version of the G-TAI can be used for providing more information on this specific emotion of a learner’s affective profile.
References
Benson, J., & Tippets, E. (1990). Confirmatory factor analysis of the Test Anxiety Inventory. In C. D. Spielberger, & R. Diaz-Guerrero (Eds.), Cross-cultural anxiety (pp. 149-156). New York: Hemi-sphere/Taylor-Francis Publishing.
Bentler, P. M. (2005). EQS 6.1., Encino, CA: Multivariate Software, Inc.
Brown, T. A. (2006). Confirmatory factor analysis for applied research.
New York: Guilford.
Chapell, M. S., Blanding, Z. B., Silverstein, M. E., Takahashi, M., Newman, B., Gubi, A., & McCann, N. (2005). Test anxiety and aca-demic performance in undergraduate and graduate students. Journal of Educational Psychology, 97, 268-274.
doi:10.1037/0022-0663.97.2.268
Efklides, A. (2011). Interactions of metacognition with motivation and affect in self-regulated learning: The MASRL model. Educational Psychologist, 46, 6-25. doi:10.1080/00461520.2011.538645
Efklides, A., Papadaki, M., Papantoniou, G., & Kiosseoglou, G. (1997). Effects of cognitive ability and affect on school mathematics per-formance and feelings of difficulty. The American Journal of Psy-chology, 110, 225-258. doi:10.2307/1423716
Efklides, A., Papadaki, M., Papantoniou, G., & Kiosseoglou, G. (1999). Individual differences in school mathematics performance and feel-ings of difficulty: The effects of cognitive ability, affect, age, and gender. European Journal of Psychology of Education, XIV, 57-69.
doi:10.1007/BF03173111
Meas-urement, 51, 243-251. doi:10.1177/0013164491511024
Fountoulakis, K. N., Papadopoulou, M., Kleanthous, S., Papadopoulou, A., Bizeli, V., Nimatoudis, I., Iakovides, A., & Kaprinis, G. S. (2006). Reliability and psychometric properties of the Greek translation of the State-Trait Anxiety Inventory form Y: Preliminary data. Annals of General Psychiatry, 5, 2. doi:10.1186/1744-859X-5-2
Gierl, M. J., & Rogers, W. T. (1996). A confirmatory factor analysis of the Test Anxiety Inventory using Canadian high school students.
Educational and Psychological Measurement, 56, 315-324.
doi:10.1177/0013164496056002012
Hair, J., Anderson, R., Tatham, R., & Black, W. (1998). Multivariate data analysis. NJ: Prentice Hall.
Hatzidimitriadou, E. (1995). Self-esteem, test anxiety and school achievement: Interactions during adolescence. Unpublished MSc Thesis, Thessaloniki: Aristotle University of Thessaloniki [In Greek]. Hedl, J. J. Jr. (1984). A factor analytic study of the Test Anxiety
In-ventory. International Review of Applied Psychology, 33, 267-283.
doi:10.1111/j.1464-0597.1984.tb01435.x
Hembree, R. (1988). Correlates, causes, effects, and treatment of test anxiety. Review of Educational Research, 58, 47-77.
Hong, E. (1998). Differential stability of individual differences in state and trait test anxiety. Learning and Individual Differences, 10, 51-69.
doi:10.1016/S1041-6080(99)80142-3
Kline, R. (2005). Principles and practice of structural equation model-ing. New York: The Guilford Press.
Liebert, R. M., & Morris, L. W. (1967). Cognitive and emotional com-ponents of test anxiety: A distinction and some initial data. Psycho-logical Reports, 20, 975-978.
Lowe, P. A., Lee, S. W., Witteborg, K. M., Prichard, K. W., Luhr, M. E., Cullinan, C. M., Mildren, B. A., Raad, J. M., Cornelius, R. A., & Janik, M. (2008). The Test Anxiety Inventory for Children and Ado-lescents (TAICA): Examination of the psychometric properties of a new multidimensional measure of test anxiety among elementary and secondary school students. Journal of Psychoeducational Assessment, 26, 215-230. doi:10.1177/0734282907303760
Metallidou, P., & Vlachou, A. (2007). Motivational beliefs, cognitive engagement, and achievement in language and mathematics in ele-mentary school children. International Journal of Psychology, 42,
2-15. doi:10.1080/00207590500411179
Morris, L. W., & Liebert, R. M. (1969). The effects of anxiety on timed and untimed intelligence tests: Another look. Journal of Consulting and Clinical Psychology, 33, 240-244. doi:10.1037/h0027164
Papantoniou, G., & Efklides, A. (2004). Affective and cognitive effects on action control. Psychology: The Journal of the Hellenic Psycho-logical Society, 11, 285-302 [Ιn Greek].
Papantoniou, G., Moraitou, D., Dinou, M., & Katsadima, E. (2010). Psychometric properties of the Greek version of the Action Control Scale. The International Journal of Educational and Psychological Assessment, 5, 45-60.
Sarason, I. G., Pierce, G. R., & Sarason, B. R. (1996). Domains of cognitive interference. In I. G. Sarason, G. R. Pierce, & B. R.
Sara-son (Eds.), Cognitive interference: Theories, methods, and findings
(pp. 139-152). Mahwah, NJ: Erlbaum.
Sarason, I. G., Sarason, B. R., Keefe, D. E., Hayes, B. E., & Shearin, E. N. (1986). Cognitive interference: Situational determinants and trait-like characteristics. Journal of Personality and Social Psychology, 51,
215-226. doi:10.1037/0022-3514.51.1.215
Schwarzer, R. (1984). Worry and emotionality as separate components in test anxiety. International Review of Applied Psychology, 33,
205-220. doi:10.1111/j.1464-0597.1984.tb01429.x
Schwarzer, C., & Kim, M-J. (1984). Adaptation of the Korean form of the Test Anxiety Inventory: A research note. In H. M. Van der Ploeg, R. Schwarzer, & C. D. Spielberger (Eds.), Advances in test anxiety research (pp. 277-285). Hillsdale, NJ: Erlbaum.
Spielberger, C. D. (1980). Test Anxiety Inventory. Palo Alto, CA: Con-sulting Psychologists Press.
Spielberger, C. D., Gonzalez, H. P., Taylor, D. J., Algaze, B., & Anton, W. D. (1978). Examination stress and test anxiety. In C. D. Spiel-berger, & I. G. Sarason (Eds.), Stress and anxiety (pp. 167-191). New York, NY: Hemisphere/Wiley.
Spielberger, C. D., Gonzalez, E. P., Taylor, C. J., Anton, W. D., Algaze, B., Ross, G. R., & Westberry, L. G. (1979). Preliminary manual for the Test Anxiety Inventory. Palo Alto, CA: Consulting Psychologists Press.
Spielberger, C. D., & Vagg, P. R. (1995). Test anxiety: A transactional process model. In C. D. Spielberger & P. R. Vagg (Eds.), Test anxi-ety: Theory, assessment and treatment (pp. 3-14). Washington, DC: Taylor & Francis.
Stogiannidou, A., Kiosseoglou, G., & Hatzidimitriadou, E. (1999). Relation between “rationality”, self-esteem and school achievement in Greek high school students. Psychology: The Journal of the Hel-lenic Psychological Society, 6, 72-87 [In Greek].
Sub, A., & Prabha, C. (2003). Academic performance in relation to perfectionism, test procrastination and test anxiety of high school children. Psychological Studies, 48, 7-81.
Van der Ploeg, H. M. (1983). The validation of the Dutch form of the Test Anxiety Inventory. In H. M. Van der Ploeg, R. Schwarzer, & C. D. Spielberger (Eds.), Advances in test anxiety research (pp. 191-202). Hillsdale, NJ: Erlbaum.
Van der Ploeg, H. M. (1984). Worry, emotionality, intelligence, and academic performance in male and female Dutch secondary school children. In H. M. Van der Ploeg, R. Schwarzer, & C. D. Spielberger (Eds.), Advances in test anxiety research (pp. 201-210). Hillsdale, NJ: Erlbaum.
Vasilaki, E., & Vamvoukas, M. (1997). Test anxiety and coping strate-gies employed by school children aged 11 - 12 years old. Pedagogi-cal Inspection, 25, 1-17 [In Greek].
Ware, W. B., Galassi, J. P., & Dew, K. M. H. (1990). The Test Anxiety Inventory: A confirmatory factor analysis. Anxiety Research, 3,
205-212.