Contents
1 Introduction 3
2 Research Questions and Related Work 5
2.1 DDoS . . . 5
2.1.1 DDoS attack types . . . 6
2.1.2 DDoS Defenses . . . 7
2.1.3 Network/service reconfiguration as a DDoS Defense . . . 7
2.2 IP-anycast. . . 8
2.2.1 Catchment measurement. . . 9
2.2.2 Controlling catchment . . . 10
3 Methodology & Measurements 11 3.1 Mapping attack traffic to anycast instances . . . 11
3.1.1 Anycast Testbed . . . 11
3.1.2 DDoS Attack data . . . 12
3.2 Measurements. . . 12
3.2.1 Anycast deployments. . . 12
3.2.2 DDoS attacks . . . 13
3.3 Prepending strategies . . . 14
3.3.1 Vacuum cleaner. . . 15
3.3.2 Redistribute to large sites/ Save the children . . . 15
3.3.3 Dynamic redistribution/ Breakwaters . . . 16
3.4 Prepending method. . . 16
4 Results 17 4.1 Vacuum cleaner . . . 17
4.1.1 Measurements with global anycast configuration . . . 18
4.1.2 European anycast configuration: Copenhagen and Paris blackhole . . . 20
4.1.3 No big 3 anycast configuration: Copenhagen blackhole . . 21
4.1.4 Summary . . . 22
4.2 Save the children . . . 22
4.2.1 Measurement with a global anycast configuration . . . 23
4.2.2 Measurement with Europe based anycast configuration. . 24
4.3 Dynamic redistribution. . . 27
4.3.1 Measurements with global anycast configuration . . . 27
4.4 Summary . . . 29
5 Discussion & Conclusion 32 5.1 Discussion . . . 32
5.1.1 Side effects, collateral damage and precision . . . 32
5.1.2 Reliability . . . 33
5.1.3 Ethics . . . 33
5.1.4 Effectiveness . . . 34
5.2 Challenges & Future work . . . 34
5.2.1 Mapping method . . . 34
5.2.2 Testbed . . . 35
5.3 Conclusion . . . 35
Chapter 1
Introduction
Research Questions & Contributions In this work we investigate the im-pact of DDoS attacks on anycast services and the possibilities of anycast recon-figuration as a possible mitigation against the effects of a DDoS attacks. To analyse the effects of a DDoS attack on anycast services we combined DDoS attack data and an anycast testbed developed for research purposes. We used DDoS attack data from captured real DDoS attacks [2] and simulated DDoS attacks based on captured botnet traffic. The anycast testbed consists of 9 sites spread around the world and is capable of measuring which IPs reach each instance using active measurements. DDoS attack defense and mitigation is a popular and broad subject and active research domain. One mitigation method used to alleviate the effects of a DDoS attack is (anycast) network reconfig-uration. Anycast services are generally configured to spread the traffic load across sites according to site capacity. But anycast services can be reconfigured to spread the load of DDoS traffic in various other ways. The anycast service could for instance be configured to redirect all (DDoS) traffic to one site with scrubbing devices installed. We reconfigured the anycast testbed using a method called AS-path prepending and measured the impact of several of these mitiga-tion strategies. Several other anycast configuramitiga-tion and manipulamitiga-tion methods exist, such as BGP communities, but we decided to choose AS-path prepending only to be able to evuluate this method more thoroughly and prevent attribu-tion problems when two methods are used at the same time. The goal of this research is formulated as follows:
Exploring whether IP-anycast reconfiguration and manipulation can minimize the impact of DDoS attack traffic on an anycasted service. To reach this goal we address the following related research questions:
RQ 1 Which anycast configuration scenarios exist and what are the positive
ef-fects for DDoS traffic mitigation that AS-path prepending might achieve?
RQ 2 Which AS-path prepending strategies yield positive effects for mitigating
DDoS traffic depending on the scenario?
RQ 3 Based on the answers to the previous questions what would be an effective
way to automatically determine the best AS-path prepending strategies depending on the scenario?
The results show that although the reconfiguration and mitigation goals can be achieved, AS-path prepending is not a reliable method for DDoS traffic redistribution in an anycast service. Some strategies such as moving all traffic to a specific site were more reliable, but came with unwanted side effects. Other strategies such as containing the traffic to a few sites performed worse. In all cases the reconfiguration affected non-DDoS traffic as well as DDoS traffic which is usually undesirable.
Chapter 2
Research Questions and
Related Work
In this chapter we present the background on DDoS and mitigation approaches. In the first section we will introduce DDoS attacks and existing mitigation solutions. The next section will discuss IP-anycast and research related to its behavior and manipulation of this behavior. And finally we will combine these two subjects with the main research question and more detailed subquestions.
2.1
DDoS
Distributed Denial of Service (DDoS) attacks are attacks on Internet services or hosts aimed at overloading the target host or service with more traffic it can handle from many different sources. These attacks are difficult to defend against because the attack traffic comes from many different sources and can easily be confused with legitimate traffic. Another difficulty is that the distributed nature of the attacks often require the cooperation from many different parties who are not affected themselves to effectively defend against them.
DDoS attacks have become a common problem in the Internet. Several
reports have shown significant increases in the number and volume of attacks over 2016 [7] [14]. Arbor Networks reported an increase of the number of DDoS attacks of 8% over 2016 where almost half of the respondents who experienced DDoS attacks did so with a frequency of 11 attacks per month or more. In the same report the respondents, from government organizations, educational institutes and enterprises, reported average total cost estimates ranging from $10000 to over 1 million dollar.
DDoS attacks traffic volumes have reached peaks of 600Gb/s to 1.2Tb/s in 2016, enough to cause trouble for almost any target. Average traffic volumes have also increased and the number of attacks over 2016 has doubled [7] [14]. Two of of the most notable recent attacks are the one on the security blog KrebsOnSecurity [20] of around 600Gb/s in September 2016 and the one on DNS provider Dyn in October 2016, performed with the IoT botnet Mirai, reportedly hitting a 1.2 Tb/s traffic volume [32].
”zombies”, which together form a ”botnet”. There exist various different tech-nical means to create a botnet and to communicate with it. Performing a DDoS attack however, does not have to require any technical skill as there exists DDoS-for-hire services, also called ”booters”, which rent out botnets to perform DDoS attacks [25].
2.1.1
DDoS attack types
DDoS attacks come in many different types and flavors, as outlined in [21]. One
important but subtle distinction is between semantic and brute-force attacks,
also called flooding attacks. Brute-force attacks use seemingly legitimate traffic to deplete the victims computing resources or try to completely fill the network pipe to the Internet. Semantic DDoS attacks exploit a weakness or bug in a specific protocol to consume more resources than the victim can handle while requiring less resources from the attacker side than would be required in a brute-force attack. An example of a semantic attack is a SYN-flood attack [23], which is aimed at filling up a hosts connection pool by opening many connections but never closing them. Brute-force attacks can also be executed with the help of protocol flaws or bugs to generate a large amount of traffic but these are not semantic attacks because the effect on the victim is still the depletion of resources due to sheer volume without abuse of protocol flaws or bugs on the victim side. Sometimes the distinction is less clear. Traffic from brute-force attacks can be indistinguishable from regular traffic to the victim and therefore very hard to filter.
Attacks can be further categorized based on the type of target. Some at-tacks target the network and aim to complete consume the available network bandwidth of the target’s network. Other attacks are aimed specifically on a certain application, resource or host. Brute-force attacks are typically aimed at either consuming the host’s or application’s resources, or the available network bandwidth. In the last quarter of 2016 more than 98% of DDoS attacks was aimed at the infrastructure level, including network bandwidth, according to [7].
A special kind of brute-force attacks are so called reflector attacks. In these attacks the attacking hosts do not send traffic to the victim directly, but they use mis-configured third party services to relay traffic to the victim. Reflector attacks are effective in hiding the sources of attack since the victim only sees traffic from legitimate third-party services. Some reflector attacks can increase the amount of traffic generated by the attacker hosts because the response sent to the target is larger than the request sent by the attacking host. Therefore, these attack are often also called amplification attacks.
An example are DNS-amplification attacks which use reflection and ampli-fication to generate large volumes of traffic to the target. The attacking botnet sends queries which generate a large response, such as an ANY query, to an open DNS-resolver (a DNS resolver which accepts queries from anyone) with the source IP-address set to the target’s IP-address. This relatively small query will cause the open resolver to send a much larger response to the target, effec-tively amplifying the volume of traffic an attacking botnet can generate.
DDoS attacks. Attackers almost always spoof the source IP-address to hide the attacking machines and confuse defenders. Spoofing IP-addresses makes it difficult to filter traffic based on IP-address as the attacker can change the spoofed IP-addresses the botnet uses frequently and even spoof the IP-address of legitimate users, causing filtering to block legitimate users. Reflection attacks are one of the few cases, except for non-spoofed traffic, in which the target can see the real IP-addresses from which the traffic is generated, i.e. the IP-addresses of the intermediaries.
Other characteristics include the type of traffic, the traffic rate and the impact on the victim. There are many more differences between several types of DDoS attacks, but the aspects highlighted in this section are most relevant to this work. For more information on the different types of DDoS attacks and their differences refer to [21] and [23]
2.1.2
DDoS Defenses
DDoS defense strategies are usually divided along the lines of reactive and pre-ventive measures, the deployment location and the level of cooperation needed. Preventive measures are meant to prevent DDoS attacks from happening before they start, e.g. fixing flaws in Internet protocols that allow DDoS attacks to oc-cur. Reactive measures deal with the mitigation of the effects of a DDoS attack. The first step in reacting to a DDoS attack is detecting the attack. Detection methods fall in two broad categories: pattern recognition and anomaly detec-tion. The second step is responding to the attack. Attack responses include identification of the attack sources, filtering of the attack traffic based on the detection method used or identified attack sources and reconfiguration of the target network to add more resources or isolate attack traffic [21] [23].
Both preventive and reactive methods can be further classified based on the deployment location of the defense. Defense methods can focus on the source networks, intermediate networks or the target network.
An example of a preventive method is egress filtering at the source network. Egress filtering blocks outgoing traffic from IP-addresses that do not belong in the network and thus prevents certain DDoS attacks that rely on spoofing IP-addresses outside of the source network [23] [17].
2.1.3
Network/service reconfiguration as a DDoS Defense
In this research we will focus on the use of network reconfiguration via IP-anycast to mitigate the effects of a brute-force DDoS attack. Brute-force DDoS attacks aim to overload the network or hosts of a service and changing the network topology can be used to allow the service the either handle the high load of DDoS traffic or isolate the DDoS traffic from (parts of) the service. Network reconfiguration is a first step in mitigating the effects of a DDoS and helps keeping the service available, but it does not stop a DDoS attack in any way. Other mitigation methods such as filtering of attack traffic will be needed in addition to reconfiguration, but these methods will often need time to discover the difference between attack and legitimate traffic. In the meantime network reconfiguration helps keeping the service available for its users.
reconfiguration of the network in the event of failures of parts of the network[28] [10]. These networks consist of public nodes that act as gateways to protected services. Many papers have covered the use of IP-anycast to create overlay networks that take advantage of the scaling and distribution of traffic properties that IP-anycast can provide. Some proposed overlay networks that provide filtering before allowing traffic to reach the target service, using the distribution of traffic and scaling properties of IP-anycast to facilitate the filtering process
[13] [29] [19]. In [18] an anycast proxy network is used to hide the target
services from the attackers and only allow proven legitimate clients to access the service. Another use of IP-anycast for DDoS protection is proposed in [34] to provide an ad-hoc IP-anycast overlay to services under DDoS and using the replication and increased scale of a large anycast deployment to absorb the DDoS traffic. All techniques referred to above that use IP-anycast depend on the fact that the IP-anycast will provide the resource multiplication and distribution of traffic needed to handle the load of a DDoS attack before filtering or another mitigation method is applied and the clean traffic is send on to the receiving target. While this may apply to large anycast providers with over-provisioned anycast deployments that can handle the traffic volume of all current large DDoS attacks, this does not always have to be the case. This research will focus on how anycast deployments can handle large volumes of attack traffic by reconfiguring the anycast deployment itself. Anycast deployments do not always have the required scale and capacity required to handle the large traffic volumes generated by DDoS attacks or an uneven traffic distribution might cause single sites to collapse [22]. Manipulation of anycast deployments is currently done manually and is not always effective. A more sophisticated and thought out way of reconfiguring the anycast in the event of a DDoS attack is therefore necessary.
2.2
IP-anycast
IP-anycast is a form of IP-addressing, where one IP-address is reachable on multiple locations on the Internet and refers to multiple different hosts. As opposed to commonly used unicast IP-addresses which only belong to one host. Each location on which the anycast IP address can be reached is called an anycast site or instance, and may consists of one or a group of servers. Users who try to reach the anycast IP address are routed to the topologically ”closest” instance as determined by the Border Gateway Protocol (BGP), the global routing system. The subset of users who reach a particular anycast instance is called that instance’s catchment. The anycast IP address is also referred to as the anycast prefix, because most networks in the Internet do not propagate BGP announcements of a single IP-address but only accept announcements of
IP subnets covered by a /24 prefix or larger. Anycast instances can be aglobal,
their presence is announced to the whole Internet, orlocal, their announcement
in BGP contains the so calledno-exportattribute, and only visible in the local
and/or neighboring ASes.
agreements, making it difficult to get a complete picture of routes from users to anycast instances. This means for example, that a user from one network might not be routed via the topologically shortest path across a certain intermediate network because the user’s network prefers to send its traffic over another in-termediate network (or series of networks) resulting in a longer path. Adding to the complexity is the fact that routes in BGP can change frequently, causing the catchment to change over time.
IP-anycast brings several advantages over a traditional single site service. The main advantage is reduced latency caused by localization of traffic [26] [15], although this requires careful configuration and planning and is not automati-cally provided. Resiliency and scalability are other benefits of using IP-anycast which stem from the replication of the service.
IP-anycast may be unsuitable for services that require state-full sessions such as TCP based services, since in subsequent messages from a client to an anycast service might suddenly be routed to different instances if the routing topology changes in between these messages. This phenomenon is called route flapping, although it appears that this does not occur frequently and only for small subsets of users [11], which means affinity of clients to anycast instances is usually stable. Other drawbacks may include a long failover time due to BGP route convergence if one of the anycast sites fails, but failover times were found to be less than a minute in most cases and might not be very relevant if anycast sites host multiple load-balanced servers.
One example of the use of IP-anycast is in the domain name system (DNS) [22][9]. The DNS protocol is very suitable as it stateless and usually requires only one request message and a response. Out of the 13 root DNS operators (named after the letters A through M), 12 use IP-anycast [4] [9]. Other examples are Content Delivery Networks (CDN) an DDoS mitigation services [12] [1] [27].
2.2.1
Catchment measurement
When analyzing anycast infrastructures one of the most important aspects is discovering the catchment of the anycast infrastructure. Several methods to determine anycast catchment have been used in previous works. The methods to determine the catchment of an anycast service can be roughly divided in two categories: active and passive. Passive methods register all source IP-addresses reaching each site at the site itself. This results in the catchment among all IP-addresses that connected to the anycast service and is almost always incomplete or biased towards the user population of the anycast service. Active methods use some kind of vantage points (VPs) to actively send some message to the anycast prefix and infer the anycast site reached from the response. The catchment among the VP IP-addresses is determined from the combined data from all VPs. The completeness of these kind of methods depends on the number of VPs and their location, but the catchment representation tends to be better as VPs can be selected to represent whole networks and spread evenly across the globe. A variation on these kind of methods use VPs to send probes to the anycast prefix and records source IP-addresses of the probes at each anycast instance.
Catchment measurements have been performed before in various studies,
mainly focused on the DNS root servers. Most of these studies [26][16][15]
of the root DNS servers from different numbers of vantage points. Some DNS servers are configured according to a common convention to respond to a DNS
CHAOS class, TXT type query for the hostnamehostname.bindorid.server
with a text record identifying the responding DNS server.
In [26] a combination of four root and TLD DNS servers were evaluated using this method with 400 vantage points from PlanetLab. They targeted four root DNS servers and found that the majority of clients did not reach the closest anycast instance.
PlanetLab vantage points in combination with CHAOS queries were also used in [16] complemented with traceroutes measurements and another set of 64000 Netalyzr vantage points to measure the catchment of F-root and Packet Clearing House anycast services. This study also proposes a different type of DNS query to identify DNS servers to allow catchment measurements with open recursive DNS resolvers, potentially further increasing the number of vantage points.
CHAOS queries were also combined with 7000 RIPE Atlas vantage points in [15] to study four of the DNS root servers. This work focused on major factors influencing the performance of anycast and found that the location and debugging BGP routing of anycast instances was more important for optimal catchments in terms of latency than the number of sites.
Another method to measure the catchment of an anycast service was intro-duced by [30] and is used in this work. This method involves sending ICMP Echo requests (ping) with the anycast prefix as the source and listening for the responses on the anycast instances. The source IP-addresses of all received re-sponses at each site constitutes the measured catchment for that site. A lot of hosts on the Internet respond to ping requests, allowing measurements with a large number of vantage points. In order to generate a complete picture of the catchments, ping requests are sent to one known responding IP-address of each /24 subnet of the IPv4 address space.
2.2.2
Controlling catchment
Anycast operators have limited options to influence the catchment of anycast instances with BGP. The catchment can be influenced by choosing the upstream AS and making peering agreements. Or by using for example AS-path prepend-ing, artificially increasing the length of the path to a certain instance. These methods however, often have unpredictable results and are applied on a trial-and-error basis [24] [31].
Chapter 3
Methodology &
Measurements
To answer the main research question on how to configure anycast deployments for DDoS mitigation we test different anycast deployment scenarios on the any-cast testbed and simulate traffic from real DDoS attacks for each scenario.
First we introduce the anycast testbed and how we determine the catchment of the anycast testbed. Next we describe the available DDoS attack data and how they are combined with the catchment data from the anycast testbed. In §3.2.1we explain which anycast deployment scenarios we use in our measure-ments and the reasoning behind them.
3.1
Mapping attack traffic to anycast instances
In order to determine the effect of a DDoS attack on a certain anycast deploy-ment configuration we map the attack traffic on anycast instances. We combine the catchment of each instance, which contains a mapping of a large part of the IPv4 address space to instances, with the source IP-addresses found in the DDoS attack data. This results in a share of attack traffic for each instance and allows us to calculate the load on each anycast instance if the DDoS attack would have been directed at the anycast deployment.
3.1.1
Anycast Testbed
The anycast testbed, as introduced by [30], is an anycast service which allows measuring the catchment of each of its instances. The testbed consists of 9
instances, which are shown inTable 3.1.
To determine the complete catchment of each instance among all IPv4 ad-dresses, each /24 IP-address prefix with a known responding host receives an ICMP Echo request from the anycast testbed. Each anycast instance collects all source IP-addresses from the ICMP Echo responses it receives and all the collected IP-addresses form the catchment for this instance. This method sends ICMP Echo requests to 6.4 million IP-addresses and covers 90% of all ASes.
The testbed can be configured with local and global nodes and nodes can be disabled. AS path-prepending can also be used to change the route to an instance, which makes the route to the instance appear longer to BGP and therefore decreases the chance of the instance being selected as the closest in-stance. After each configuration change the catchment is determined again to reflect the changes in the configuration.
For a more detailed description of the anycast testbed, see [30].
3.1.2
DDoS Attack data
The DDoS attacks used in this research are captured from so called Booter or Stresser services [25]. These DDoS for hire services can provide large DDoS attacks without requiring any form of technical knowledge on DDoS attacks.
Selecting some of these Booter services to attack a controlled target which captures all the DDoS traffic resulted in a dataset of several DDoS attack cap-tures. The largest of these attacks generated an average attack traffic rate of 5.48 Gbps, while the rest managed to generate around 1 Gbps or below.
3.2
Measurements
The goal of the measurements is to find the best mitigation strategies using AS-path prepending for different combinations of DDoS attacks and anycast de-ployment scenarios. For each combination we try different AS path-prepending strategies, evaluate the effects and extract the strategies that have a positive effect and possibly refine them.
3.2.1
Anycast deployments
To determine which configuration manipulations are best suited for DDoS miti-gation we define several deployment scenarios to simulate on the anycast testbed and evaluate the prepending strategies against. The anycast deployments are defined with the following properties in mind: the goals/policies of the anycast service, the number of anycast sites and the capacity of each site.
The policies of the anycast service can differ per type of service. Some
services require maximum availability to all users. Other services require a
certain minimum performance possibly at the cost of availability to some users. These policies, which can also be seen as constraints, determine which anycast manipulations are acceptable solutions for DDoS mitigation.
We define two different types of policies for anycast services:
2. Minimum required performance, a certain level of performance is deemed more important than availability to all users
Anycast comes in many different configurations depending on the number of instances, capacity of each instance, local or global BGP configuration and other BGP route adjustments. The configuration variables we use to define our initial deployment configurations are as follows:
1. Number of instances and instance location 2. Capacity per node
The number of instances is limited to the number of anycast sites available in the testbed. The capacity is not however, because the DDoS attacks are not actually executed against the testbed but simulated based on the mapping of source IP-addresses on the catchment of the anycast testbed.
These variables combined determine our initial configuration and function as constraints when we evaluate each mitigation strategy.
Anycast configurations
Here we give a short overview of the different IP-anycast configurations used for evaluation and modeled on the testbed.
Description Number of sites Sites
All sites 9
Washington (US) Miami (US) Enschede (NL) Sydney (AU) Paris (FR) Sao Paolo (BR) Copenhagen (DK) Tokyo (JP) London (UK)
Europe 4
Enschede (NL) Paris (FR) Copenhagen (DK) London (UK)
No big 3 6
Miami (US) Enschede (NL) Sydney (AU) Sao Paolo (BR) Copenhagen (DK) Tokyo (JP)
Table 3.1: Anycast testbed configuration used
3.2.2
DDoS attacks
Table 3.2: Overview of the DDoS attacks used Short name Full name Protocol Nr. of
IPs
Nr. of ASes
Date
CONS-NTP-01 Connection-stresser
NTP-01
NTP 1200 191 2014-12-22 15:45
CONS-NTP-02 Connection-stresser
NTP-02
NTP 1013 187 2014-12-23 23:28
DEJA-DNS Deja-booter DNS DNS 2762 803 2013-08-14 23:04
GRIM-DNS Grim-booter DNS DNS 66 18 2013-08-14 22:41
IPSTR-SNMP-02 IP-stresser SNMP-02 SNMP 1249 303 2014-12-25 17:38
IPSTR-CHARGEN-02 IP-stresser Chargen-02 Chargen 1487 220 2014-12-25 15:12
IPSTR-NTP-01 IP-stresser NTP-01 NTP 1223 201 2014-12-22 23:12
IPSTR-NTP-02 IP-stresser NTP-02 NTP 1227 194 2014-12-25 15:54
KRYPT-NTP-02 Kryptonic NTP-02 NTP 3025 810 2015-01-06 23:58
REBEL-CHARGEN Rebel-security
Char-gen
Chargen 258 123 2013-08-14 22:09
REST-DNS-01 Restricted DNS-01 DNS 2092 375 2014-12-22 10:05
REST-DNS-02 Restricted DNS-02 DNS 1089 240 2014-12-25 19:09
They differ in the types of protocols used, amplification techniques used (or not used), number of attack sources and their location. Since we are only interested in the volume of traffic the attacks would generate for instances of an anycast service, we define two types of attacks:
1. Many different locations with (roughly) evenly distributed traffic
2. Fewer locations, with a significant amount of traffic originating from a single location or area
Most attacks use some kind of amplification to achieve a greater attack traffic volume. With this type of attack, the source of the traffic, as observed from the target, becomes the point where the traffic is amplified. We consider these amplification points, such as open DNS resolvers, as the sources of attack in our scenarios, because there is often no easy way to find the real sources of the attack traffic. Another reason is that the real origin of the traffic does not matter for mitigation at the target, since the traffic originates from the amplification points from the perspective of the target.
All DDoS attacks taken into account are real DDoS attacks from previous captures, so the distribution of traffic over the different anycast sites is realistic.
The DDoS attacks used are listed inTable 3.2and are all reflected DDoS attacks
and therefore do not have spoofed source-IPs from the targets point of view.
3.3
Prepending strategies
under attack, then the end result would not have been positive for the anycast service. If it where the other way around it would be. Furthermore, anycast service specific properties such as the server capacity and network bandwidth per site will vary per deployment and over time. Therefore we will not take into account anycast service specific parameters, but instead focus on the ability of AS-path prepending to effectively redistribute attack traffic.
To evaluate whether AS-path prepending can be used to redistribute at-tack traffic we developed three strategies which each define a goal as to how the attack traffic should be redistributed. Each strategy is applied with dif-ferent combinations of testbed configuration and DDoS attack. The AS-path prepending strategies used are described in the following subsections.
3.3.1
Vacuum cleaner
Goal This strategy aims to divert all attack traffic to one of the anycast sites,
ideally with minimal impact on non-attack traffic.
How Path prepend all sites except the blackhole site until most of the attack
traffic reaches the blackhole site.
Situation/conditions Works best if the DDoS traffic mainly comes from one topological location and the blackhole site has additional anti-DDoS measures such as a scrubbing service in place to further mitigate the attack.
Benefits Further mitigation efforts can be focused on one anycast sites while the other sites remain in normal operation. Clients routed to the remaining sites are not affected by the DDoS attack
Downsides Clients from the same network as the attack traffic will be routed to the blackhole site and will experienced degraded or no service.
3.3.2
Redistribute to large sites/ Save the children
Goal Take the load of small sites that cannot handle the load the DDoS
attack traffic by redistributing the attack traffic to the larger capacity sites in the anycast deployment until the larger capacity sites are at capacity.
How Path prepend all smaller sites until either the smaller sites can handle
the traffic load or the larger sites are at capacity.
Situation/conditions DDoS attack has many topologically spread out source locations. Larger sites have sufficiently more capacity than smaller ones.
Benefits The capacity of the ancyast deployment is used efficiently to handle the load of attack traffic.
3.3.3
Dynamic redistribution/ Breakwaters
Goal Distribute all attack traffic from nodes that are overloaded by the DDoS
traffic to sites with spare capacity. Traffic can also be offloaded from the sites over capacity without redirecting to a specific instance.
How Path-prepend all sites that receive a larger traffic share than they can
handle at the same time in steps until the traffic share for all of them becomes smaller.
Situation/conditions DDoS attack traffic has topologically distributed source locations. Does not work if the total capacity is smaller than the total attack volume.
Benefits Most efficient way of traffic redistribution. Prevents one site from absorbing all attack traffic (which means this site does not need the capacity to do so)
Downsides Requires constant updates on the load per instance. Depends heavily on the actual DDoS traffic and is hard to generalize. Traffic from one overloaded site may end up tipping other sites over the edge and overload them as well.
3.4
Prepending method
Chapter 4
Results
In this chapter we present and discuss our findings on path-prepending strategies
under different conditions. We first look at what we call the vacuum cleaner
strategy (§4.1), in which (attack) traffic is shifted to a single anycast site. We
then move to the save the children strategy (§4.2), where the goal is to spare
the low-resource, low-capacity sites from receiving large amounts of (attack)
traffic. And finally, we look at dynamic redistribution strategy (§4.3), focused
on redistribuing (attack) traffic equally across the anycast deployment.
4.1
Vacuum cleaner
The first evaluated prepending strategy is the vacuum cleaner. This strategy
aims at creating a blackhole site to which all attack traffic, and ideallyonly
at-tack traffic, is redirected. The blackhole site should preferably be a site which,
a) can handle large traffic volumes, b) is equipped to deal with DDoS traffic
using some form of mitigation and c) is the only site that possesses the
previ-ously listed properties, because it does not make sense to move traffic around otherwise. Which sites are suitable to receive the attack traffic also heavily depends on the anycast operators and the specific characteristic of each site (agreements with upstream providers etc.) The anycast testbed does not have DDoS protection and none of the sites has special properties or more capacity than another site and generally does not receive much traffic at all. Therefore we chose the blackhole site at random.
We validated different scenarios, varying the blackhole site, anycast urations and DDoS attacks. The blackhole sites vary across anycast config-urations because in some configconfig-urations a previously chosen blackhole is not included. The attacks were chosen based on the traffic distribution without any
path prepending per anycast configuration and blackhole combination. In§4.1.1
and§4.1.1we use a global anycast configuration with Washington and London
as blackhole sites respectively. In§4.1.2we use the anycast configuration with
Attacks used in this validation.
The attack selection only took into account whether not all attack traffic was already sent to the blackhole site.
• Deja-booter DNS
• Grim-booter DNS
• Rebel-security Chargen
• Restricted DNS-01
• IP-stresser SNMP-02
• IP-stresser Chargen-02
• IP-stresser NTP-02
SeeTable 3.2for more details on the attacks.
4.1.1
Measurements with global anycast configuration
All measurements in this section were performed using the global anycast con-figuration with all 9 available sites enabled.
Washington blackhole
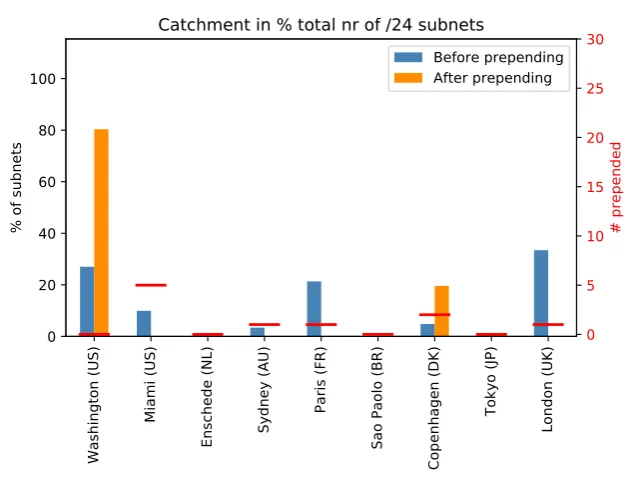
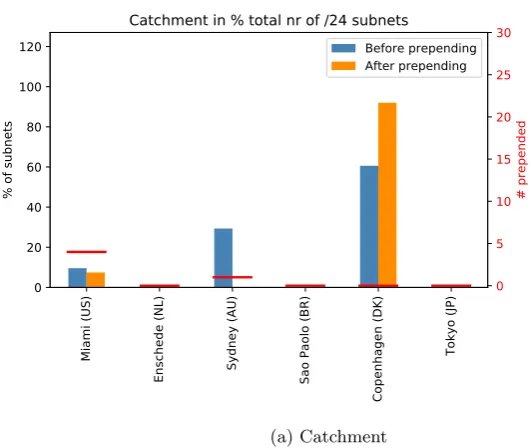
We applied this prepending strategy with the Deja-booter and Grim-booter DDoS attacks as a starting point. Each of these attacks have a different dis-tribution of traffic sources, from wide-spread globally to localized. The Deja-booter attack’s traffic is very much distributed around the world and the initial
mapping of the traffic onto the catchment reflects that, as shown inFigure 4.1a.
The blue columns show the percentage of subnets going the each site before the prepending attempt and the orange columns after. The red bars show the amount of prepending applied after all the last iteration of the prepending at-tempt. In the scenario all sites are active and the goal is to move all traffic to one large site for scrubbing or other purposes, in this case the site chosen was the one in Washington, US (US-WAS). The Grim-booter attack traffic mainly targets the Miami site when the catchment is measured without any prepending. In the Dejabooter case, the goal was achieved fairly easy, and all attack
traffic was routed to the Washington site as can be seen in Figure 4.1b. The
catchment, however, as seen in the orange columns of Figure 4.1awent along
Washington (US)
Miami (US)
Enschede (NL) Sydney (AU)
Paris (FR)
Sao Paolo (BR)
Copenhagen (DK) Tokyo (JP) London (UK) 0 20 40 60 80 100 120
% of subnets
Catchment in % total nr of /24 subnets
Before prepending After prepending 0 5 10 15 20 25 30 # prepended
(a) Catchment of the anycast testbed before and after prepending
Washington (US)
Miami (US)
Enschede (NL) Sydney (AU)
Paris (FR)
Sao Paolo (BR)
Copenhagen (DK) Tokyo (JP) London (UK) 0 200 400 600 800 1000 1200 Mbit/s
Per site attack traffic in Mbit/s
Before prepending After prepending 0 5 10 15 20 25 30 # prepended
(b) Mapping of attack traffic on anycast testbed before and after prepending
Figure 4.1: Catchment and traffic mapping before and after prepending for the Deja-booter attack on the global anycast configuration
Washington (US)
Miami (US)
Enschede (NL)
Sydney (AU)
Paris (FR)
Sao Paolo (BR)
Copenhagen (DK)
Tokyo (JP)
London (UK)
0
20
40
60
80
100
% of subnets
Catchment in % total nr of /24 subnets
[image:20.595.138.457.426.665.2]Before prepending
After prepending
0
5
10
15
20
25
30
# prepended
Washington (US)
Miami (US)
Enschede (NL)
Sydney (AU)
Paris (FR)
Sao Paolo (BR)
Copenhagen (DK)
Tokyo (JP)
London (UK)
0
20
40
60
80
% of subnets
Catchment in % total nr of /24 subnets
Before prepending
After prepending
0
5
10
15
20
25
30
[image:21.595.135.458.128.361.2]# prepended
Figure 4.3: Catchment before and after prepending for the Vacuum strategy on the global anycast configuration with the IP-stresser SNMP-02 attack
London, Copenhagen and Paris blackhole
Switching to a different blackhole site and suitable DDoS attacks yielded the same results. We applied the strategy with the London site as the blackhole site and Rebel-stresser as the attack, Copenhagen as blackhole and the Resticted DNS-01 attack and Paris as blackhole combined with the Restricted DNS-01 and IP-stresser SNMP-02 attacks. The goal of the prepending strategy, moving all attack to the blackhole site is achieved in all 4 cases. The original catchment however, is also disturbed and moved almost completely to the blackhole site. The only case which showed a slightly different result was Paris as a blackhole with the IP-stresser SNMP-02 attack. The global catchment seems to be less affected with this combination, because 4 out of 6 sites still have the same share of the catchment after prepending, as can be seen when comparing the blue and
orange columns in figure Figure 4.3.
4.1.2
European anycast configuration: Copenhagen and
Paris blackhole
IPSTR-CHARGEN-Enschede (NL)
Paris (FR)
Copenhagen (DK)
London (UK)
0
50
100
150
200
250
300
Mbit/s
Per site attack traffic in Mbit/s
Before prepending
After prepending
0
5
10
15
20
25
30
# prepended
Figure 4.4: Mapping of attack traffic on the testbed before and after prepending for the Vacuum strategy on the European anycast configuration with the IP-stresser NTP-02 attack
02 failed due to missing attack traffic after prepending which could not be explained. In the case of the IPSTR-NTP-02 attack with Paris as the black-hole, the attack traffic could not be moved away from the Copenhagen site towards the Paris site, even after prepending the Copenhagen site 20 times (see Figure 4.4).
When looking into this specific attack we see inFigure 4.5the attack traffic
is unequally distributed over the ASes that were part of the attack. This leads us to speculate that one of these ASes reponsible for a large part of the attack traffic sent traffic to the Copenhagen instance because of for instance a routing policy or other factor which could not be influenced by AS-path prepending.
4.1.3
No big 3 anycast configuration: Copenhagen
black-hole
0
20
40
60
80
100
Mbit/s
0
20
40
60
80
100
120
140
AS count
Traffic bandwidth distribution for attack ASes (185 ASes total)
Figure 4.5: Attack traffic distribution over ASes for the Vacuum strategy on the European anycast configuration with the IP-stresser NTP-02 attack
4.1.4
Summary
The overall results for the vacuum cleaner strategy show that attack traffic can be diverted to one specific site successfully with different target blackhole sites, anycast site configurations and attacks. The main downside of this strategy is the disruption of the catchment of the anycast service, most likely causing all legitimate traffic to shift to the blackhole site as well. In this case, disabling all sites would but the blackhole site would yield the same result quicker. Other disadvantages can include the potential overloading of the blackhole site or the collateral damage caused at the site were the blackhole is hosted. Despite these disadvantages this strategy can still be useful in an anycast configuration with one main large site with almost all of the server capacity/bandwidth and many smaller sites.
All omitted prepending results for the different combinations of blackhole
sites and DDoS attacks can be found inAppendix A.
4.2
Save the children
Washington (US)
Miami (US)
Enschede (NL) Sydney (AU)
Paris (FR)
Sao Paolo (BR)
Copenhagen (DK) Tokyo (JP) London (UK) 0 10 20 30 40 50 60 70
% of subnets +6.89%-16.95%
+0.00%+0.26% +3.17%
-2.97%
+9.44%
Catchment in % total nr of /24 subnets
Before prepending After prepending
Prepending per instance (times prepended)
0 5 10 15 20 25 30 # prepended
(a) Catchment of the anycast testbed before and after prepending
Washington (US)
Miami (US)
Enschede (NL) Sydney (AU)
Paris (FR)
Sao Paolo (BR)
Copenhagen (DK) Tokyo (JP) London (UK) 0 50 100 150 200 Mbit/s +47.37% -93.16% +0.00%+0.38% -99.86% +51.47%
Per site attack traffic in Mbit/s
Before prepending After prepending
Prepending per instance (times prepended)
0 5 10 15 20 25 30 # prepended
(b) Mapping of attack traffic on anycast testbed before and after prepending
Figure 4.6: Catchment and mapping of attack traffic from the IP Stresser NTP-01 attack on the global anycast testbed configuration before and after prepend-ing for the Save the children strategy
Attacks used in this validation
For the tests we selected combinations of anycast configurations and DDoS attacks where the DDoS traffic would not already select the larger sites, since in those situations the goal is already achieved without any prepending.
• Connection-stresser NTP-01
• IP-stresser NTP-01
• Restricted DNS-02
• Connection-stresser NTP-02
• IP-stresser NTP-02
SeeTable 3.2for more details on the attacks.
4.2.1
Measurement with a global anycast configuration
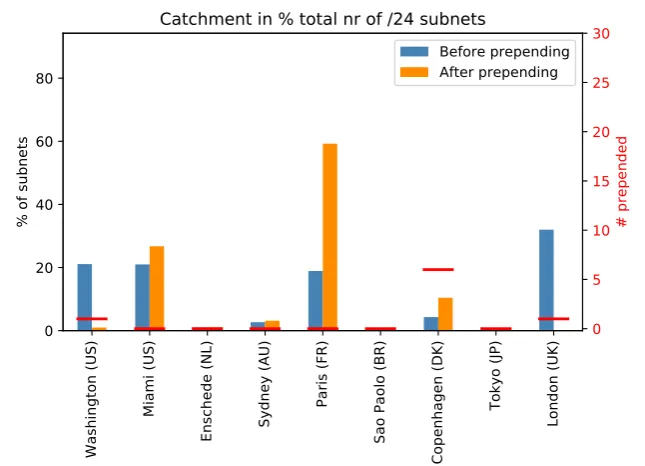
In the first set of measurements we used an anycast configuration with all 9 sites and the 3 sites with the largest catchment (London, Paris, Washington) were also designated as the largest sites; this follows the scenarios we see in real world deployments, where higher capacity sites are typically those there most of
the traffic goes (either legitimate or attack traffic). We performed prepending
After 4 iterations of prepending we see inFigure 4.6bthat for the IP-stresser attack the majority of DDoS traffic moved from Copenhagen and Miami to Washington and London. The results for Connection-stresser and Restricted-stresser attacks are the same, except for a higher amount of prepending needed at the Miami site for the Restricted-stresser attack. So the goal of moving the attack traffic away from the smaller sites has been achieved.
The difference in the catchment for the IP-stresser attack before and after
the prepending is shown inFigure 4.6a. The Miami site loses more than half of
the subnets in its catchment, as does the Copenhagen site. Some of the smaller variations in the catchment are caused by a different number of responding sites for each catchment measurements. The large change in catchment at the Miami site however, is caused by the prepending.
The difference in catchment before and after prepending for the Connection-stresser attack are very similar. The catchment after prepending for the Restricted-stresser did not have any subnets in the catchment for the Miami and Copen-hagen sites. In this case disabling the CopenCopen-hagen and Miami sites would have had the same effect as prepending.
When comparing the catchment changes for all subnets versus subnets that
send attack traffic, we can see in Figure 4.7 that attacker subnets were not
targeted specifically by the path prepending. Only in one case, the Restricted stresser traffic at the Copenhagen site, did the attack subnets shift significantly more than the other traffic. Because in all cases the attack traffic did shift away from the prepended sites, the prepending caused the relatively small amount of subnets that generated the most attack traffic to shift away from these sites. This also means that the collateral damage of the path prepending in these specific three cases is low in terms of total non-attacker subnets shifted, but can be expected to be higher in general because attacker subnets shift away from sites at the same rate as normal sites. Compared to other prepending strategies the impact on the catchment for normal users is relatively low, because the aim is to divert traffic away from smaller sites in terms of user traffic.
4.2.2
Measurement with Europe based anycast
configura-tion
We applied the the same strategy with an anycast configuration which only has sites in Europe (Enschede, Paris, Denmark, and London). The Paris and London sites where designated as the larger sites, since they normally have the largest catchment and therefore are expected to receive most of the traffic. We applied the strategy with two NTP based DDoS attacks, from IP- and Connections-stresser, which direct a larger share of their traffic to the Enschede and Copenhagen sites under normal circumstances.
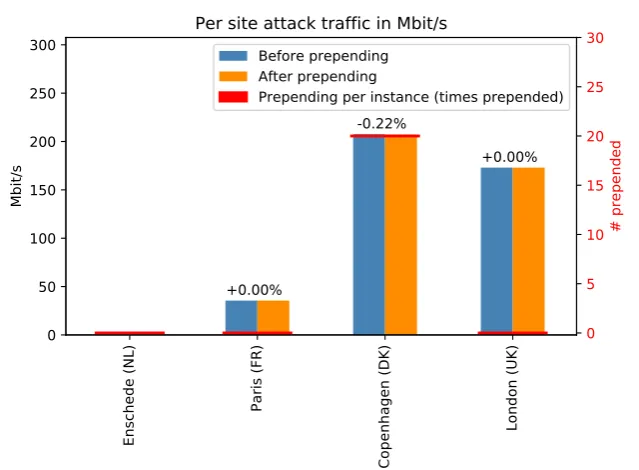
As can be seen inFigure 4.8a the prepending strategy did not work with
this testbed configuration. Even after prepending the Copenhagen site 20 times the traffic did not move to either Paris or London which was the goal. When comparing the number of attack subnets and normal subnets that shifted (or did not), moving any traffic away from Copenhagen was impossible and not just
attack traffic (seeFigure 4.8b). This suggests that, for example, either the path
Enschede (NL)
Paris (FR)
Copenhagen (DK)
London (UK)
0
50
100
150
200
250
300
Mbit/s
+0.00%
-0.22%
+0.00%
Per site attack traffic in Mbit/s
Before prepending
After prepending
Prepending per instance (times prepended)
0
5
10
15
20
25
30
# prepended
(a) Mapping of attack traffic on European testbed configuration before and after prepending
Enschede (NL)
Paris (FR)
Copenhagen (DK)
London (UK)
0
20
40
60
80
% of subnets
+0.00%
+0.97%
-3.90%
+2.94%
Catchment in % total nr of /24 subnets
Before prepending
After prepending
Prepending per instance (times prepended)
0
5
10
15
20
25
30
# prepended
[image:27.595.138.458.136.371.2](b) Catchment of the European testbed configuration before and after prepending
4.3
Dynamic redistribution
The dynamic distribution strategy is focused on redistributing DDoS traffic as equally as possible among all available anycast sites through the use of prepend-ing. The sites that should be prepended depend on the initial attack traffic distribution and on the total volume of attack traffic. The goal is that any large peak of attack traffic that was visible before the strategy took place, is no longer present and the attack traffic is “more equally” distributed across the anycast sites. As with the other strategies normal traffic, i.e. the original catchment should be disturbed as little as possible.
Attacks used in this validation
The selected DDoS attacks for the measurements all showed large traffic peaks at at least one of the sites.
• Connection-stresser NTP-01
• IP-stresser SNMP-02
• Restricted DNS-01
• IP-stresser Chargen-02
• Kryptonic NTP-02
SeeTable 3.2for more details on the attacks.
4.3.1
Measurements with global anycast configuration
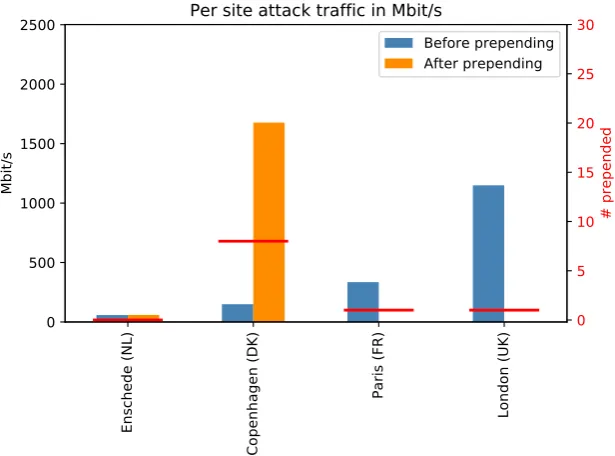
The first testbed configuration tested had all sites enabled. For all three dif-ferent DDoS attacks the prepending strategy failed. The attempts to remove attack peaks from sites by prepending them did not cause the traffic to split up and distribute to other sites, instead the traffic moved around as a whole
to another site. Examples of this behaviour can be seen in Figure 4.9a and
Figure 4.9b, where a blue column at one site representing attack traffic before prepending, shows up as an orange column at another site representing traffic after prepending. Sometimes the traffic moved from one site to another and back again after a new iteration and the end results sometimes even show more
large peaks than in the starting situation, as shown inFigure 4.9c.
Looking at the attack traffic distribution per ASN inFigure 4.10we can see
that there is one ASN that is responsible for a relatively large peak of around
100 Mbit/s. Prepending could never redistribute this traffic because path
prepending works on the AS level. This peak however, does at most represent 1/4th of the total attack traffic and is therefore not an explanation as to why the rest of the traffic could not be redistributed equally across all sites.
4.3.2
Measurements with Europe based and without 3
largest site configurations
Washington (US)
Miami (US)
Enschede (NL) Sydney (AU)
Paris (FR)
Sao Paolo (BR)
Copenhagen (DK) Tokyo (JP) London (UK) 0 20 40 60 80 100 120 140 160 Mbit/s
Per site attack traffic in Mbit/s
Before prepending After prepending 0 5 10 15 20 25 30 # prepended
(a) Mapping of attack traffic on global testbed configuration before and after prepend-ing (Connection stresser NTP-01)
Washington (US)
Miami (US)
Enschede (NL) Sydney (AU)
Paris (FR)
Sao Paolo (BR)
Copenhagen (DK) Tokyo (JP) London (UK) 0 100 200 300 400 Mbit/s
Per site attack traffic in Mbit/s
Before prepending After prepending 0 5 10 15 20 25 30 # prepended
(b) Mapping of attack traffic on global testbed configuration before and after prepend-ing (IP-stresser SNMP-02)
Washington (US)
Miami (US)
Enschede (NL) Sydney (AU)
Paris (FR)
Sao Paolo (BR)
Copenhagen (DK) Tokyo (JP) London (UK) 0 500 1000 1500 2000 Mbit/s
Per site attack traffic in Mbit/s
Before prepending After prepending 0 5 10 15 20 25 30 # prepended
Figure 4.10: AS attack traffic distribution for the IP-stresser SNMP-02 attack (all sites enabled)
for this prepending strategy. Figure 4.11a and Figure 4.11b show the result
for prepending with the Restricted DNS based DDoS attack for both different testbed configurations. Both attempts failed to redistribute the traffic evenly across all sites.
4.4
Summary
An overview of the measurements performed is given inTable 4.1. The overall
Enschede (NL)
Copenhagen (DK)
Paris (FR)
London (UK)
0
500
1000
1500
2000
2500
Mbit/s
Per site attack traffic in Mbit/s
Before prepending
After prepending
0
5
10
15
20
25
30
# prepended
(a) Mapping of attack traffic on Europe based testbed configuration before and after prepending
Miami (US)
Enschede (NL)
Sydney (AU)
Sao Paolo (BR)
Copenhagen (DK)
Tokyo (JP)
0
200
400
600
800
1000
1200
1400
1600
Mbit/s
Per site attack traffic in Mbit/s
Before prepending
After prepending
0
5
10
15
20
25
30
# prepended
[image:31.595.134.442.137.365.2](b) Mapping of attack traffic on testbed configuration without 3 largest sites before and after prepending (Restricted DNS-01)
Table 4.1: Overview of the measurements performed Strategy Testbed
config
DDoS attack Success? Iterations Max
prepend count
Vacuum Cleaner (§4.1)
All
Deja-booter (Washington blackhole) Yes 7 10
Grim-booter (Washington blackhole) Yes 6 5
Rebel (London blackhole) Yes 7 7
Restricted DNS-01 (Copenhagen
blackhole)
Yes 3 3
Restricted DNS-01 (Paris blackhole) Yes 5 5
IP-stresser SNMP-02 (Paris blackhole) Yes 7 6
Europe
Restricted DNS-01 (Copenhagen
blackhole)
Yes 1 1
Restricted DNS-01 (Paris blackhole) Yes 4 4
IP-stresser Chargen-02 (Copenhagen blackhole)
(mapping error) 1 1
IP-stresser NTP-02 (Paris blackhole) No 7 20
No big 3
Restricted DNS-01 (Copenhagen
blackhole)
Yes 4 4
Save the children (§4.2)
All
Connection NTP-01 Yes 4 4
IP-stresser NTP-01 Yes 4 4
Restricted DNS-02 Yes 5 5
Europe Connection NTP-02 No 10 10
IP-stresser NTP-02 No 5 20
Dynamic redistribution (§4.3)
All
Connection NTP-01 No 5 5
IP-stresser SNMP-02 No 8 4
Restricted DNS-01 No 12 12
Europe Restricted DNS-01 No 6 8
IP-stresser CHARGEN-02 Without
big 3
Connection NTP-01 No 12 12
Kryptonic NTP-02 No 2 2
Chapter 5
Discussion & Conclusion
5.1
Discussion
In this section, based on our methodology and results from previous chapters we make considerations related to pros and cons of proposed strategies for using
anycast against DDoS (§5.1.1); reliability of proposed approaches (§5.1.2); ethics
on shifting traffic by means of anycast manipulation (§5.1.3); and finally the
effectiveness of proposed strategies (§5.1.4).
5.1.1
Side effects, collateral damage and precision
The main goal of applying prepending is to reroute DDoS traffic while minimiz-ing the impact on normal traffic. In the results from the previous section we see that the main goal is often achieved but the impact on normal traffic, .i.e. the global catchment, is high. The results for the vacuum cleaner strategy show this most clearly. After prepending the catchment of the blackhole site includes nearly all subnets, effectively disabling all other sites for both attack traffic and normal sites. The problem here is that, although the blackhole site might be able handle all traffic and employ anti DDoS measures such as scrubbing etc., the same could be achieved by simply disabling all other sites except for the blackhole. Prepending does not have much additional value, except that the other sites remain available to local clients.
The other prepending strategies do not perform much better in this regard.
As discussed in §4.2.1, Figure 4.7, the rate at which subnets sending attack
traffic switch site in response to prepending is lower on average than that of a normal subnet which does not send any attack traffic. This means that for every attack subnet that switches site because of prepending at least one other subnet is also expected to switch site, which is not in line with the goals of the prepending strategies and means the collateral damage to the catchment is high.
prepending never targets only the ASes that send attack traffic, because when the AS path length to one site increases enough for the attacker AS (AS sending attack traffic) to switch site, this will happen for many normal ASes at that same level of prepending as well. So in two different ways the prepending strategies do not have enough precision to target attack traffic from the evaluated DDoS attacks to limit the collateral damage to a level that most operators would deem acceptable.
5.1.2
Reliability
Prepending sites to reroute traffic proved to be rather unpredictable. One ex-ample are the results with a European testbed configuration when applying the ”Save the Children” strategy, where after prepending the Copenhagen site 20 times the catchment for this site would not change. In other occasions the catchment also appeared to be ”stuck” at one site, where simply applying more prepending to this site did not further decrease the size of its catchment notice-ably.
Another frequently occurring event is site catchments jumping from one site to another (usually a site which does not normally receive a large share of traffic) in subsequent iterations of prepending. So before the end goal of the prepending is reached, these catchment jump from one site to the other and back might negatively impact the reachability or stability of the anycast service during the process of iteratively prepending.
A final aspect covering the reliability of prepending for DDoS mitigation is the varying number of iterations needed when prepending. The number of prepending iterations necessary to get to the same result for different DDoS at-tacks varies from 4 to 8 iterations with outliers for (partially) failed attempts. In the experiments the longest prepending attempt had 12 iterations after which prepending the same site no longer seemed to have any effect, as might be expected as this site probably had a longer AS-path than any other
conceiv-able path to the same prefix. In this case stopping the process was based
on a straightforward decision (prepending was expected to not have any ef-fect anymore), but in some cases after twelve iterations the longest amount of prepending might still be in the range of what is considered normal and then this decision becomes harder.
5.1.3
Ethics
5.1.4
Effectiveness
For all prepending strategies, the primary goal, i.e. moving the DDoS traffic to a predefined site, was reached in 12 out of 24 cases. This means that for most prepending strategies the success rate was not very high. Moreover, even when the goals are achieved the collateral damage in terms of legitimate traffic shifted and large catchment changes is medium to high in all cases. Other side effects also have to be taken into account when considering prepending, such as seemingly random shifts of traffic among sites. The amount of iterations of prepending it took to reach the predefined goals also varied, meaning that the time needed to apply a prepending strategy is also uncertain and might be quite long if applying the same step by step algorithm as used here. Time is an important factor when considering the effectiveness of AS-path prepending as a first-line defense system, because it is supposed to be a quick defense against the effects of a DDoS attack until actual mitigation of the DDoS traffic can be started. All these factors combined suggest that the effectiveness of AS-path prepending is not very high as a first-line DDoS defense system.
5.2
Challenges & Future work
In this section we outline the challenges and possible future work related to our methodology and approaches.
5.2.1
Mapping method
The technique used to map DDoS traffic on anycast sites can be improved in several ways. The catchment of the anycast testbed was measured using the method as described in [30]. Measuring the catchment using this method yields a good but not complete picture of the anycast testbeds catchment. Not every IPv4 subnet has a responding host to answer pings and the number of responding hosts from the known responding hosts varies. Therefore, when mapping DDoS attack traffic on sites, some traffic will not be mapped because the catchment picture is not complete. The mapping percentage of DDoS traffic is on average around 90 % and this is usually sufficient to give an accurate view of the amount of attack traffic each site would receive from the DDoS traffic.
There is a chance however that some of the attack traffic that could not be mapped due to an incomplete catchment measurement contains a dispropor-tionate share of the attack traffic in which case the calculated mapping of DDoS attack traffic might be less accurate than desired. Furthermore, IP version 6 traffic is excluded as a whole, since it is unfeasible to find a host in a small enough subnet responding to pings in a significant share of the huge IPv6 ad-dress space. Therefore, although we believe the current method for determining catchment is the best currently available and sufficient for showing the impact of almost entirely IPv4 based DDoS traffic on an anycast service, it is still a challenge to find a better catchment measurement method, especially since more and more traffic is moving towards IPv6.
disconnected from the Internet and a different routing situation cause the map-ping of attack traffic on sites to be different than if the mapmap-ping was performed at the time the DDoS occurred. Again we do not believe this is a problem for the goals of this research as the goals is not to create a 100% accurate mapping of DDoS traffic on anycast sites, but show the general DDoS traffic behaviour when mapped on anycast services. A more ideal situation would be when the anycast service continuously measures its catchment and keeps a historical record of its catchment.
Another aspect that is not covered in the DDoS mapping methodology is the attackers response to the prepending. Actual DDoS attacks can adapt to the mitigations of the defenders. Switching tactics after a short period might cause the prepending to fail because the attacker now uses different attack source hosts or another reflection technique with different amplification points. The prepending strategies only consider a relatively static set of attack sources, at least for a certain while. Changing attack sources during prepedending would make it difficult to assess whether a shift in traffic from one site to another is due to the effect of prepending or the attacker changing attack sources or tactics.
5.2.2
Testbed
The anycast testbed has 9 sites, with 4 in Europe and 5 spread around the world. Comparing this configuration with other anycast configuration such as the DNS root servers [9], the number of sites is at the low end of the spectrum. B-root still has fewer sites but most other root servers that use anycast, and large CDN’s as well, have more sites; deployments with more than 100 sites are not uncommon nowadays. The ongoing trend among anycast operators is to add more and more sites. This begs the question whether an anycast testbed of 9 sites represents anycast services in general. Anycast services with significantly more sites might react differently to prepending. The challenge here lies in increasing the size of the anycast testbed that would allow for more and better testing in the future with more possible configurations to better model anycast services used in the wild. The conclusions on path prepending remain valid however, because a larger testbed would make path prepending more complex and not more likely to yield better results.
Another difference from larger commercial anycast operations is the type of sites the testbed uses. The testbed uses a combination of donated and rented sites at different locations, while commercial anycast sites are hosted in large datacenters with probably better peering. Commercial anycast operators likely opt for peering in datacenters close to large Internet exchanges. Running the same experiments on a an actual large scale anycast service would provide more insight into these differences and may be considered as future work; although with the obvious challenge of running such experiments in large scale or even within production networks.
5.3
Conclusion
deter-mine if the effects of a DDoS attack on an anycast service can be mitigated by redistributing traffic among the anycast sites by prepending the AS path an-nouncements for the anycast service. This kind of DDoS defense technique falls under the category of network reconfiguration and is meant as a first response before other mitigation tactics focusing on stopping the DDoS traffic can come into effect.
Appendix A
Washington (US)
Miami (US)
Enschede (NL) Sydney (AU)
Paris (FR)
Sao Paolo (BR)
Copenhagen (DK)
Tokyo (JP)
London (UK)
0 250 500 750 1000 1250 1500 1750
Mbit/s
Per site attack traffic in Mbit/s
Before prepending After prepending
0 5 10 15 20 25 30
# prepended
(a) Attack traffic mapping
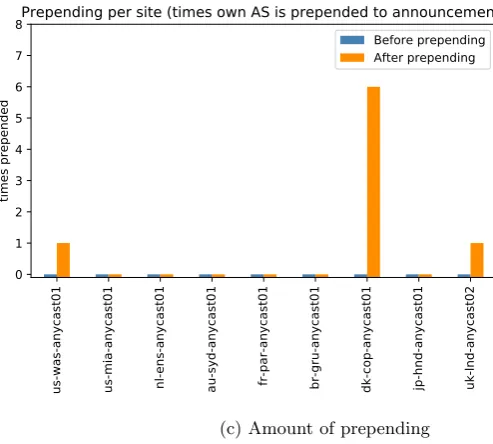
us-was-anycast01 us-mia-anycast01 nl-ens-anycast01 au-syd-anycast01 fr-par-anycast01 br-gru-anycast01 dk-cop-anycast01 jp-hnd-anycast01 uk-lnd-anycast02 0
1 2 3 4 5 6 7
times prepended
Prepending per site (times own AS is prepended to announcement)
Before prepending After prepending
(b) Amount of prepending
Washington (US)
Miami (US)
Enschede (NL) Sydney (AU)
Paris (FR)
Sao Paolo (BR)
Copenhagen (DK)
Tokyo (JP)
London (UK)
0 20 40 60 80 100
% of subnets
Catchment in % total nr of /24 subnets
Before prepending After prepending
0 5 10 15 20 25 30
# prepended
[image:39.595.132.398.68.294.2](c) Catchment
Figure A.1: Catchment, attack traffic mapping and amount of prepending be-fore and after applying the Vacuum cleaner prepending strategy on the global
Washington (US)
Miami (US)
Enschede (NL) Sydney (AU)
Paris (FR)
Sao Paolo (BR)
Copenhagen (DK)
Tokyo (JP)
London (UK)
0 100 200 300 400 500
Mbit/s
Per site attack traffic in Mbit/s
Before prepending After prepending
0 5 10 15 20 25 30
# prepended
(a) Attack traffic mapping
Washington (US)
Miami (US)
Enschede (NL) Sydney (AU)
Paris (FR)
Sao Paolo (BR)
Copenhagen (DK)
Tokyo (JP)
London (UK)
0 20 40 60 80
% of subnets
Catchment in % total nr of /24 subnets
Before prepending After prepending
0 5 10 15 20 25 30
# prepended
(b) Catchment
us-was-anycast01 us-mia-anycast01 nl-ens-anycast01 au-syd-anycast01 fr-par-anycast01 br-gru-anycast01 dk-cop-anycast01 jp-hnd-anycast01 uk-lnd-anycast02 0
1 2 3 4 5 6 7 8
times prepended
Prepending per site (times own AS is prepended to announcement)
Before prepending After prepending
[image:40.595.134.381.467.689.2](c) Amount of prepending
nl-ens-anycast01 fr-par-anycast01 dk-cop-anycast01 uk-lnd-anycast02 0.0
2.5 5.0 7.5 10.0 12.5 15.0 17.5 20.0
times prepended
Prepending per site (times own AS is prepended to announcement)
Before prepending After prepending
(a) Amount of prepending
Enschede (NL)
Paris (FR)
Copenhagen (DK)
London (UK)
0 50 100 150 200 250 300
Mbit/s
Per site attack traffic in Mbit/s
Before prepending After prepending
0 5 10 15 20 25 30
# prepended
(b) Attack traffic mapping
Enschede (NL)
Paris (FR)
Copenhagen (DK)
London (UK)
0 20 40 60 80 100 120
% of subnets
Catchment in % total nr of /24 subnets
Before prepending After prepending
0 5 10 15 20 25 30
# prepended
[image:41.595.131.396.77.526.2](c) Catchment
Figure A.3: Catchment, attack traffic mapping and amount of prepending before and after applying the Vacuum cleaner prepending strategy on the European
Washington (US)
Miami (US)
Enschede (NL) Sydney (AU)
Paris (FR)
Sao Paolo (BR)
Copenhagen (DK)
Tokyo (JP)
London (UK)
0 250 500 750 1000 1250 1500 1750 2000
Mbit/s
Per site attack traffic in Mbit/s
Before prepending After prepending
0 5 10 15 20 25 30
# prepended
(a) Attack traffic mapping
Washington (US)
Miami (US)
Enschede (NL) Sydney (AU)
Paris (FR)
Sao Paolo (BR)
Copenhagen (DK)
Tokyo (JP)
London (UK)
0 20 40 60 80 100 120
% of subnets
Catchment in % total nr of /24 subnets
Before prepending After prepending
0 5 10 15 20 25 30
# prepended
(b) Catchment
us-was-anycast01 us-mia-anycast01 nl-ens-anycast01 au-syd-anycast01 fr-par-anycast01 br-gru-anycast01 dk-cop-anycast01 jp-hnd-anycast01 uk-lnd-anycast02 0
1 2 3 4 5
times prepended
Prepending per site (times own AS is prepended to announcement)
Before prepending After prepending
[image:42.595.131.398.67.532.2](c) Amount of prepending