University of Warwick institutional repository: http://go.warwick.ac.uk/wrap
This paper is made available online in accordance with
publisher policies. Please scroll down to view the document
itself. Please refer to the repository record for this item and our
policy information available from the repository home page for
further information.
To see the final version of this paper please visit the publisher’s website.
Access to the published version may require a subscription.
Author(s): Yingping Huang and Ken Young
Article Title: Binocular Image Sequence Analysis: Integration of
Stereo Disparity and Optic Flow for Improved Obstacle Detection and
Tracking
Year of publication: 2008
Link to published article: http://dx.doi.org/10.1155/2008/843232
Publisher statement: © Yingping Huang and Ken Young. This is an
open access article distributed under the Creative Commons
Volume 2008, Article ID 843232,10pages doi:10.1155/2008/843232
Research Article
Binocular Image Sequence Analysis: Integration of
Stereo Disparity and Optic Flow for Improved Obstacle
Detection and Tracking
Yingping Huang1and Ken Young2
1International Automotive Research Centre (IARC), Warwick Manufacturing Group, University of Warwick, Coventry CV4 7AL, UK 2International Manufacturing Research Centre, Warwick Manufacturing Group, University of Warwick, Coventry CV4 7AL, UK
Correspondence should be addressed to Yingping Huang,huang [email protected]
Received 28 August 2007; Revised 15 February 2008; Accepted 28 March 2008
Recommended by Ati Baskurt
Binocular vision systems have been widely used for detecting obstacles in advanced driver assistant systems (ADASs). These systems normally utilise disparity information extracted from left and right image pairs, but ignore the optic flows able to be extracted from the two image sequences. In fact, integration of these two methods may generate some distinct benefits. This paper proposes two algorithms for integrating stereovision and motion analysis for improving object detection and tracking. The basic idea is to fully make use of information extracted from stereo image sequence pairs captured from a stereovision rig. The first algorithm is to impose the optic flows as extra constraints for stereo matching. The second algorithm is to use a Kalman filter as a mixer to combine the distance measurement and the motion displacement measurement for object tracking. The experimental results demonstrate that the proposed methods are effective for improving the quality of stereo matching and three-dimensional object tracking.
Copyright © 2008 Y. Huang and K. Young. This is an open access article distributed under the Creative Commons Attribution License, which permits unrestricted use, distribution, and reproduction in any medium, provided the original work is properly cited.
1. INTRODUCTION
Driving safety is a serious issue for our society. Statistical data shows about 40 million road accidents happen every year in Europe, and 1.5 million peoples are killed by these accidents. Analysis of these accidents indicates that about 70 percent of serious injury accidents are caused by lack of driver attention. This fact necessitates developing advanced driver assistance systems (ADAS) for modern vehicles. The target of ADAS is to make the vehicle aware of its surroundings and allow it to take proper action in response to dangerous situations.
Vision-based sensing systems have been widely adapted for object detection in modern intelligent vehicles. Stereovi-sion and motion analysis are two common computer viStereovi-sion techniques for extracting objects from sets of images. In stereovision, two images captured at the same time but from different positions are used to compute depth information of objects [1–4]. The motion analysis method segments objects according to their optic flows (motion vectors) by analysing two or more consecutive images taken with the same camera
[5–8]. These two methods have been researched separately, but very little attention has been paid to integrating them. In fact, integration of these two methods may generate some distinct benefits. This paper proposes two fusion algorithms for improving object detection and tracking. The basic idea is to fully make use of two pairs of image sequences captured from a stereovision rig, that is disparity from left and right pair images and optic flows from consecutive images.
correspondence matching and may generate a number of false matching points because there are often many points in an image that have the same or very similar intensities. In this paper, we propose a method to improve the quality of correspondence matching. In this method, optic flows obtained from the left and right image sequences are used as extra constraints for correspondence matching.
In addition, object tracking is important to achieve more accurate object speeds in both longitudinal and lateral directions. Use of a Kalman filter is an effective method for object tracking and requires measurements to update prediction results. It is known that stereovision is able to measure object longitudinal distance while motion analysis is capable of measuring the lateral displacements of an object. This implies that a Kalman filter provides a natural way to fuse stereovision and motion analysis by using them as measurement tools. In this paper, we will also examine how stereovision and motion analysis can be fused by a Kalman filter for object tracking.
Stereomotion integration has been studied in a theoret-ical manner for extracting the relationship between them. Waxman and Duncan [9] claimed that “stereovision and motion analyses can be combined in such a way that each can help “to overcome the other’s shortcomings” and proposed a 5-step fusion strategy for extracting shape information. One important result was a correlation between relative image flow (i.e., binocular difference flow) and stereo disparity. Their implementations were limited and based on scenes consisting of white objects covered by black dots. Li et al. [10,11] presented a method for recovering 3D translational motion and structure from binocular image flows. Transla-tion moTransla-tion parameters were first determined from a group of linear equations generated from measured optical flows of a number of image points. The estimated motion parameters were then used to find the correspondence between binoc-ular image pairs. Results were presented upon laboratory scenes consisting of surfaces covered with either grids or regular patterns of black dots. Zhang and Kambhamettu [12] have proposed twoalgorithms for computing dense three-dimensional scene flow and structure from multiview image sequences. Stereo constraints under a multiview camera setup were investigated and utilized in model-based algorithms and extended gradient-based algorithms. Sudhir et al. [13] and Clifford and Nasrabadi [14] used Markov random fields to combine the stereo and motion. In Sudhir’s method, the discontinuities are used to predict and enforce the preservation of stereo correspondences through the motion estimates. They presented the computed optical flow and stereo disparity on some tailored images. These researches did not consider object grouping issues, and therefore are difficult to apply in real scenarios. Tirumalai et al. [15] presented an approach for incremental refinement of disparity maps for a mobile robot. They utilized the motion vectors calculated from a least median of squares (LMS)-based algorithm for recursive disparity prediction and refinement. More recently, Dang et al. [16] proposed using a Kalman filter for fusing optical flow and stereo disparity for object tracking. In their method, a complicated extended Kalman filter is used for the iteration process. In our study,
we propose a decoupling filtering method by decomposing the state vector into three groups. The decomposed Kalman filter for each group of vectors has a linear relation, leading to a greatly simplified computation. In addition, the Kalman filter proposed by Dang et al. used a simplified motion prediction equation by considering accelerations as noise. This approach can reduce the computational complexity of the extended Kalman filter, but will bring a bigger error to the tracking results when the car is moving with acceleration. In our work, we use a complete motion equation as the prediction equation. The experimental results demonstrate that our Kalman filter is able to effectively track the distance and speed for all dynamic cases.
This paper consists of four sections.Section 2, following this introduction, describes fusion algorithm I that is fusing optic flows to stereo matching for improving the quality of the disparity map.Section 3presents fusion algorithm II that introduces how stereovision and motion analysis can be fused by a Kalman filter for object tracking.Section 4gives the conclusions.
2. INTEGRATING OPTIC FLOWS WITH STEREO MATCHING
For a stereovision-based object detection system, two images (left and right) sequences can be simultaneously acquired. This enables acquisition of a pair of motion fields by analyzing the left and right image sequences. Since true motion fields are not accessible, optical flow representing the displacement of corresponding points in consecutive images is used as an approximation. Optic flows for the same target calculated from the left and right image sequences should be similar. This similarity of optic flows can be taken as extra matching constraints. To fulfill this, we firstly need to calculate the optic flows for the left and right image sequences.
2.1. Optic flows of moving obstacles
Many approaches have been designed for obtaining optic flows for moving objects from image sequences [17]. Basi-cally, these approaches can be split into two categories, that is, spatiotemporal gradient-based techniques and correspon-dence matching techniques. The spatiotemporal gradient-based techniques calculate optic flows gradient-based on assumptions such as globe smoothness or direction smoothness, and the-oretical mathematical derivation. These assumptions cannot be guaranteed to be true in practical situations. The cor-respondence matching-based techniques detect optic flows by searching for correspondence points between consecutive images. These are, therefore, more suitable for dynamic road scene images. In this research, we employ a correspondence matching approach based on greyscale similarity to acquire optic flows.
In our previous work [2], we have designed an edge indexed stereo matching method. A summary for this method is as follows.
50
100
150
200
50 100 150 200 250 300
50
100
150
200
50 100 150 200 250 300
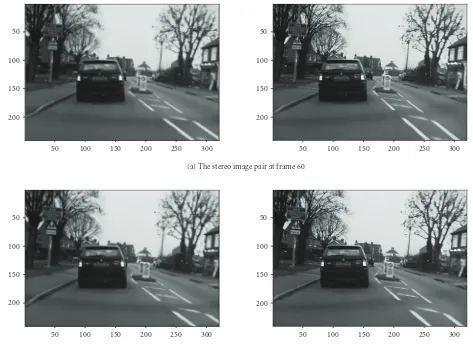
(a) The stereo image pair at frame 60
50
100
150
200
50 100 150 200 250 300
50
100
150
200
50 100 150 200 250 300
[image:4.600.63.536.71.418.2](b) The stereo image pair at frame 61
Figure 1: Consecutive stereo image sequence pairs.
(ii) Normalized cross correlation coefficients are used as a measure of greyscale similarity of two window blocks centred at the points to be assessed. The correspondence points are considered as those with the maximum cross correlation coefficients, which must be greater than a predefined threshold.
(iii) A quadratic interpolation was introduced to achieve a subpixel disparity estimation. This is to improve the depth resolution so that a higher depth detection accuracy can be achieved.
In this research, we also use the same method to calculate optic flows for the left and right image sequences. Some alterations have been made as follows.
(i) The correspondence searching is conducted in con-secutive images rather than left and right image pairs. (ii) No epipolar constraint can be applied, therefore the range of correspondence searching is within a square area centred at the seed point position.
(iii) For the right image sequence, the optic flows will be calculated on all candidate points to be matched with the seed points in the left image.
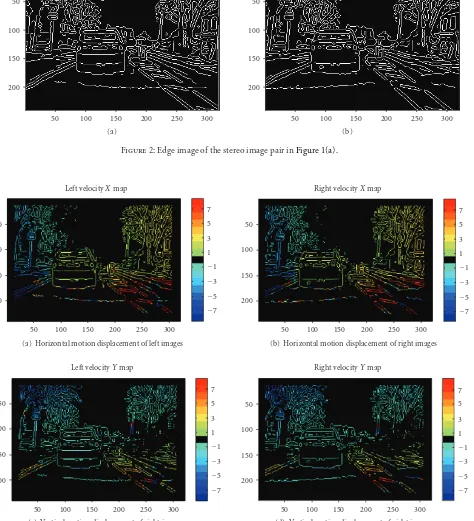
Figure 1shows two stereo image pairs captured at consec-utive time frames. A Canny edge detector has been used to achieve edge information as detailed as possible. Figure 2
50
100
150
200
50 100 150 200 250 300
Left image edge
(a)
50
100
150
200
50 100 150 200 250 300
Right image edge
[image:5.600.81.537.81.251.2](b)
Figure 2: Edge image of the stereo image pair inFigure 1(a).
50
100
150
200
50 100 150 200 250 300
7 5 3 1 −1 −3 −5 −7 Left velocityXmap
(a) Horizontal motion displacement of left images
50
100
150
200
50 100 150 200 250 300
7 5 3 1 −1 −3 −5 −7 Right velocityXmap
(b) Horizontal motion displacement of right images
50
100
150
200
50 100 150 200 250 300
7 5 3 1 −1 −3 −5 −7 Left velocityYmap
(c) Vertical motion displacement of right images
50
100
150
200
50 100 150 200 250 300
7 5 3 1 −1 −3 −5 −7 Right velocityYmap
[image:5.600.72.546.114.635.2](d) Vertical motion displacement of right images
Figure 3: Optic flows for left and right images using edge-indexed crosscorrelation matching.
search range, was set to 8 in both directions. For a zero displacement, the colour is set to black. Actually, the calculated displacements have subpixel accuracy. Comparing
Figure 3(a)to3(b)and3(c)to3(d), we can find the motion
2.2. Using optic flows as extra constraints for stereo matching
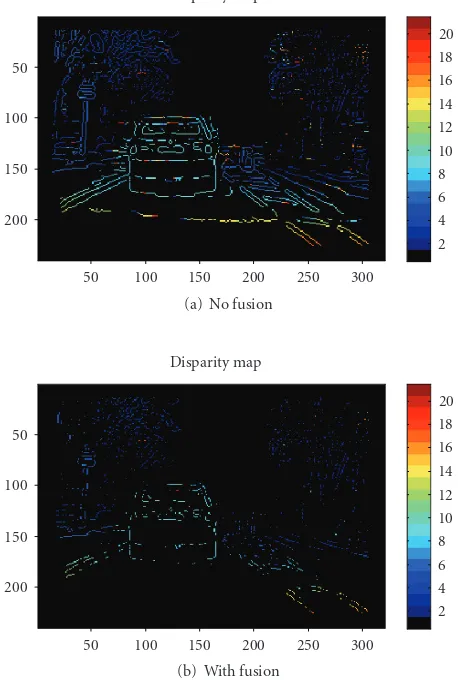
Our previous work only used the normalized cross correla-tion coefficient as a measure to assess the correlation of the point pair. The point pair with the maximum correlation coefficient is considered as the correspondence points. In fact, this is not always true because of an intensity difference between the two images caused by lighting angle, iris or exposure gain of the cameras. The disparity map generated by this method for the image pair at frame 60 is shown in
Figure 4(a). It can be seen that some colour discontinuity occurs in the same object indicating mismatching points.
By introducing optic flows as extra constraints, we are defining multiple measures for stereo matching. As well as the normalized cross correlation coefficient, two other measures are defined as the differences of the horizontal and vertical displacements of two points to be assessed. Actually, texture measure is also very important to assess the matching quality in some nontextured regions of the image [1]. In this study, we only conduct stereo matching for edge points where the image patches are normally textured. Furthermore, as we only want to assess the effect of optic flows on the stereo matching, we do not consider the texture measure.
Applying the epipolar line constraint, we can search the correspondence point in the same row. For a seed point at position (il,j) in the left edge image and a candidate point
at position (ir,j) in the right image, the differences of the
motion displacements in horizontal and vertical directions,
MVDx(il,j) and MVDy(il,j) , are defined as
MVDx
il,j
=MVx
il,j
−MVx
ir,j,
MVDy
il,j
=MVy
il,j
−MVy
ir,j,
(1)
where MVxand MVyare the horizontal and vertical motion
displacements obtained inSection 2.1.
Accordingly, we define a three-dimensional measure vectorM(il,j) as follows:
Mil,j
= MVDx
il,j
MVDy
il,j
1 −coefil,j T,
(2)
where coef(i,j) is the normalized cross correlation coefficient for the seed point at position (il,j) in the left image.
To achieve the best matching, MVDx(i,j) and MVDy(i,j)
should be minimised while coef(i,j) should be maximised. The matching errorE(il,ir,j) between pixel (il,j) in the
left image and pixel (ir,j) in the right image is defined as a
weighted sum of the individual measures
Eil,ir,j
=
k
wk
Mil,j
k, (3)
where k represents the measure vector index. The selection of the weighting is objective and empirical. The weighting for the third measure (1−coef(i,j)) should have a greater value than the motion displacement differences. For an edge point
(xl,y) in the left image, the correspondence point in the
50
100
150
200
50 100 150 200 250 300
20 18 16 14 12 10 8 6 4 2 Disparity map
(a) No fusion
50
100
150
200
50 100 150 200 250 300
20 18 16 14 12 10 8 6 4 2 Disparity map
[image:6.600.316.545.80.421.2](b) With fusion
Figure 4: Disparity maps with fusion and no fusion with optic flows.
right image is the one (xmr,ym) generating the minimum
matching error, and xl−xmr gives out the disparity. The
disparity map generated by this method for the image pair at frame 60 is shown in Figure 4(b). The comparison between Figures4(a) and4(b) indicates that the disparity map obtained from the fusion method is much cleaner with many false matching points eliminated.
3. FUSION USING A KALMAN FILTER FOR 3D OBJECT TRACKING
3.1. Modelling
For a point P(X Y Z) in the world coordinate,
the state vector to be tracked is defined by SV =
[X X X Y Y Y Z Z Z]2, where X, Y, Z are the first-order derivative of X, Y, Z that is 3D speeds of the point, X, Y, Z are the second-order derivative of
X, Y, Z, that is 3D accelerations of the point. Assuming the
as the object motion equation
SVk+1=A·SVk+ξk, (4)
where k is the sampling index,ξkprocess noise,
A= ⎡ ⎢ ⎢ ⎢ ⎢ ⎢ ⎢ ⎢ ⎢ ⎢ ⎢ ⎢ ⎢ ⎢ ⎢ ⎢ ⎢ ⎢ ⎢ ⎢ ⎣
1 T 0.5T2 0 0 0 0 0 0
0 1 T 0 0 0 0 0 0
0 0 1 0 0 0 0 0 0
0 0 0 1 T 0.5T2 0 0 0
0 0 0 0 1 T 0 0 0
0 0 0 0 0 1 0 0 0
0 0 0 0 0 0 1 T 0.5T2
0 0 0 0 0 0 0 1 T
0 0 0 0 0 0 0 0 1
⎤ ⎥ ⎥ ⎥ ⎥ ⎥ ⎥ ⎥ ⎥ ⎥ ⎥ ⎥ ⎥ ⎥ ⎥ ⎥ ⎥ ⎥ ⎥ ⎥ ⎦ , (5)
and T the sampling interval. The Kalman filter also needs a measurement vector and measurement equations to update the prediction.
For an ideal pinhole camera model, the projection point
p(x y) of the point P(X Y Z) in the image plane can be
expressed as x y = ⎡ ⎢ ⎢ ⎣
m·X
Z
m·Y
Z ⎤ ⎥ ⎥
⎦, (6)
where m is the camera constant regarding the focal length and the pixel size. This equation indicates the relationship between real 3D world coordinates and 2D image coordi-nates. It can be seen from (6) that three variables x, y, and Z are crucial for updating prediction equation (4). Therefore, we can define the measurement vector as MV =
[x y Z]T. It is known that the distance Z can be measured from the stereovision technique. Horizontal and vertical coordinates (x,y) can be measured because horizontal and vertical displacementsΔxandΔybetween the imagescan be measured by the motion analysis, and the initial position (xc,yc) of the tracking point are known from (17). Thus, the
Kalman filter provides a natural way to fuse stereovision with motion analysis for three-dimensional object tracking.
The measurement equation can be written as
MVk=C·SVk+ηk, (7)
whereηkis the measurement noise,
C= ⎡ ⎢ ⎢ ⎢ ⎢ ⎣ m
Z 0 0 0 0 0 0 0 0
0 0 0 m
Z 0 0 0 0 0
0 0 0 0 0 0 1 0 0 ⎤ ⎥ ⎥ ⎥ ⎥
⎦. (8)
Equation (4) forms a complete object motion equation. The process estimation noise only comes fromX, Y, Z, that is 3D accelerations. Therefore, the process noiseξkin (4) can
be modelled as ξk = [0 0 ax 0 0 ay 0 0 az]T.ax, ay,
andaz are considered as Gaussian white noise with a mean
value of zero. Their variances are ∂2
ax, ∂2ay, and∂2az. The
processing noise covarianceQkis
Qk=E
ξk·ξkT
= ⎡ ⎢ ⎢ ⎢ ⎢ ⎢ ⎢ ⎢ ⎢ ⎢ ⎢ ⎢ ⎢ ⎢ ⎢ ⎢ ⎢ ⎢ ⎢ ⎣
0 0 0 0 0 0 0 0 0
0 0 0 0 0 0 0 0 0
0 0 ∂2
ax 0 0 0 0 0 0
0 0 0 0 0 0 0 0 0
0 0 0 0 0 0 0 0 0
0 0 0 0 0 ∂2
ay 0 0 0
0 0 0 0 0 0 0 0 0
0 0 0 0 0 0 0 0 0
0 0 0 0 0 0 0 0 ∂2
az ⎤ ⎥ ⎥ ⎥ ⎥ ⎥ ⎥ ⎥ ⎥ ⎥ ⎥ ⎥ ⎥ ⎥ ⎥ ⎥ ⎥ ⎥ ⎥ ⎦ . (9)
The measurement noise ηk consists of ηxk, ηyk, and ηZk.
Their variance∂2
x, ∂2y, ∂2Z can be calculated from
measure-ment data. Measuremeasure-ment noise covarianceRkare
Rk=E
ηk·ηT
k = ⎡ ⎢ ⎢ ⎣ ∂2
x 0 0
0 ∂2 y 0
0 0 ∂2
Z ⎤ ⎥ ⎥ ⎦. (10)
The state vector SV contains three groups of state variables (X X X), (Y Y Y), and (Z ZZ) , which are not directly related to each other. Thus, we decouple the state vector SV into three groups; each group with two state variables. Correspondingly, (4) and (7) are also split into three groups. Each group forms a linear Kalman filter with the computation reduced from 63to 3∗23. For example, for
the third group, the longitudinal distance and speed, the state vector is SV =[Z Z Z]T, and the measurement vector is MV=[Z]. The prediction and measurement equations keep the same format as (4) and (7) with some changes in matrix
A and C, that is
A3=
⎡ ⎢ ⎢ ⎣
1 T 0.5T2
0 1 T
0 0 1
⎤ ⎥ ⎥ ⎦,
C3=
1 0 0.
(11)
Kalman filtering is an iteration process, and can be described with five equations consisting of two time update and three measurement update equations. The time update equations for the filter are
SV−k+1=A·SVk,
Pk+1− =A·Pk·AT+Qk,
(12)
wherePk is the variance of the estimation error. The three
measurement update equations are
Kk+1=
Pk+1− ·CT
C·P−k+1·CT+Rk
, (13)
SVk+1=SV−k+1+Kk+1
MVk+1−C·SV−k+1
, (14)
Pk+1=
15
14.5
14
13.5
13
12.5
12
0 10 20 30 40 50 60 70 80 90 100
Distanc
e
Z
(m)
Distance tracking results
Frames (a) The longitudinal distance
15
10
5
0
−5
−10
0 10 20 30 40 50 60 70 80 90 100
L
o
ng
itudinal
speed
Z
’(m/s)
Longitudinal speed tracking results
Frames (b) The longitudinal speed
7 6 5 4 3 2 1 0 −1 −2 −3
0 10 20 30 40 50 60 70 80 90 100
Lat
er
al
speed
X
’(m/s)
Lateral speed tracking results
Frames (c) The lateral speed
8
6
4
2
0
−2
−4
0 10 20 30 40 50 60 70 80 90 100
V
er
tical
speed
Y
’(m/s)
Vertical speed tracking results
Frames (d) The vertical speed
Figure 5: Experiment 1: tracking results by using a Kalman filter as a mixer (red: the true state of the system, green: the measurement results, blue: the estimation of the Kalman filter).
where K is the Kalman gain,Rk=∂2Z, and
Qk=
⎡ ⎢ ⎢ ⎣
0 0 0
0 0 0
0 0 ∂2 az
⎤ ⎥ ⎥
⎦. (16)
SVk+1 gives the tracking results for the longitudinal distance
and speed.
The other two groups of state variables, the lateral and vertical movements, have the same iteration equations with a small change in matrix C, that is,C1=C2=[m/Z 0 0 ],
which requires knowing the longitudinal distance Z. There-fore, in practice, we first calculate the third group of the variables and then use the obtained results for the other two groups of variables.
3.2. Experiments
Object longitudinal distance (Z) is detected by the stereovi-sion method explained in [1,2]. In this method, an object to be detected is segmented as a point cluster in the depth map. The point cluster is then remapped back into the original image, which generates an object image region Robj. The
centroid point of an object detected is selected as the tracking point. The centroid point (xc,yc) is defined as
xc=
i∈Robj
j∈Robji·G(i,j)
i∈Robj
j∈RobjG(i,j)
,
yc=
i∈Robj
j∈Robjj·G(i,j)
i∈Robj
j∈RobjG(i,j) ,
35
30 25
20 15
10 5
0 10 20 30 40 50 60 70 80 90 100
Distanc
e
Z
(m)
Distance tracking results
Frames (a) The longitudinal distance
12 10 8 6 4 2 0 −2 −4
0 10 20 30 40 50 60 70 80 90 100
L
o
ng
itudinal
speed
Z
’(m/s)
Longitudinal speed tracking results
Frames (b) The longitudinal speed
16.5
16
15.5
15
14.5
14
13.5
0 10 20 30 40 50 60 70 80 90 100
M
easur
ed
hor
iz
o
ntal
co
or
dinat
e
x
(pix
el)
Measured horizontal coordinatex
Frames
(c) Measured horizontal coordinatex
5 4.5 4 3.5 3 2.5 2 1.5 1 0.5
0 10 20 30 40 50 60 70 80 90 100
Lat
er
al
distanc
e
X
(m)
Lateral distance tracking results
Frames (d) The lateral distanceX
15
10
5
0 −5
−10
−15
0 10 20 30 40 50 60 70 80 90 100
Lat
er
al
speed
X
(m/s)
Lateral speed tracking results
Frames (e) The lateral speedX
Figure 6: Experiment 2: tracking results by using Kalman filter as a mixer (red: the true state of the system, green: the measurement results, blue: the estimation of the Kalman filter).
where
G(i,j)=
⎧ ⎨ ⎩
1 ifi∈Robj∩j∈Robj,
0 other. (18)
sequences containing 100 frames as shown in Figure 1. When using (12)–(15) to calculate the optimal estimation, two parameters, the measurement noise covarianceand the processing noise covariance must be prespecified. In this work, the measurement covariance noise was evaluated from the measurement data ∂2
x = ∂2y = 0.04 and∂2Z =
0.05. The process noise was modelled as a Gaussian white noise with a mean value of zero and a standard deviation of 0.03, therefore, processing noise covariance ∂2
ax = ∂2ay = ∂2az ≈ 0.001. Initial values of the state
vector SV and the variance of the estimation error Pk
required by the iteration process were randomly set. Our experiments demonstrate that the tracking results are not very sensitive to the settings of the process noise or the initial values.
Experiment 1 gives the simplest scenario where the car under detection is moving 12.8 m ahead of the equipped car at a relative speed of zero in both longitudinal and lateral directions. Thus, the longitudinal and lateral distances between the two cars are kept constant. The tracking results of the longitudinal distance and relative speed are shown in Figures5(a)and5(b). The lateral and vertical relative speeds are shown in Figures5(c)and5(d). In the figures, the red line is the true state of the system, the green curve measurement results, and the blue curve the estimation of the Kalman filter. It can be seen that after about 10 frames, the estimation converges on the true values. Furthermore, we find that the tracking results are more stable and closer to the true values than the measurement results.
Experiment 2 covers a more generic case where the car under detection is moving away from the equipped car with a constant acceleration of 0.4 m/s2 and an initial
speed of 0.556 m/s in the longitudinal direction. In the lateral direction, the car under detection is moving from the equipped car at a speed of 0.4 m/s. Figures 6(a) and
6(b)shows the tracking results of the longitudinal distance and speed. The longitudinal distance between the two cars varies from 6.8 m to 32.1 m in a form of a parabolic curve. The longitudinal speed increases linearly from 0.556 m/s to 4.556 m/s.Figure 6(c)shows the measured horizontal coor-dinatex. Correspondingly, the lateral distanceXbetween the two cars and the tracking results are shown inFigure 6(d). It can be seen that the horizontal coordinate varies around a mean value of 15 pixel while the lateral distance varies in a form of an approximate parabolic curve, affected by the measured longitudinal distance. Lateral speed tracking results are displayed in Figure 6(e). As in the previous experiment, all estimation values converge on the true values after about 10 frames. Furthermore, we also find that the tracking results are more stable and closer to the true values than the measurement results, which indicates the designed Kalman filter is able to generate an optimal estimation. The results of experiment 2 demonstrate that the designed Kalman filter is able to dynamically track the distance and speed in both longitudinal and lateral directions while the car under detection is accelerating away.
4. CONCLUSIONS
In this paper, we proposed two algorithms for fusing stereo-vision and motion analysis. The first algorithm is to fuse the optic flows into stereo matching, where the optic flows are used as extra constraints for stereo matching. The matching error is defined as the weighted sum of multiple measures including the normalized cross correlation coefficient, and differences of horizontal and vertical motion displacements. The experimental results demonstrated that the disparity map obtained from the fusion method is much cleaner than the normal method with many false matching points eliminated. The second fusion algorithm is to use a Kalman filter as a mixer to combine the measurements generated from stereovision and motion analysis for 3-dimensional object tracking. A decoupling strategy has been designed to achieve a simplified linear Kalman filter, which greatly reduces the computation complexity and burden. The exper-imental results have demonstrated that the tracking results converge on the true values. Furthermore, the tracking results are more stable and closer to the true values than the raw measurement results, indicating that the proposed Kalman filter is able to generate optimal estimations for 3D object motion parameters.
REFERENCES
[1] Y. Huang, S. Fu, and C. Thompson, “Stereovision-based object segmentation for automotive applications,” EURASIP Journal
on Applied Signal Processing, vol. 2005, no. 14, pp. 2322–2329,
2005.
[2] Y. Huang, “Obstacle detection in urban traffic using stereovi-sion,” in Proceedings of the 8th IEEE International Conference
on Intelligent Transportation Systems (ITSC ’05), pp. 357–362,
Vienna, Austria, September 2005.
[3] U. Franke and A. Joos, “Real-time stereo vision for urban traffic scene understanding,” in Proceedings of IEEE Intelligent
Vehicles Symposium (IV ’00), pp. 273–278, Dearborn, Mich,
USA, October 2000.
[4] Y. Kimura, T. Kato, and M. Ohta, “Stereo vision for obstacle detection,” in Proceedings of the 13th World Congress &
Exhibition on Intelligent Transportation Systems and Services,
London, UK, October 2006.
[5] T. Suzuki and T. Kanada, “Measurement of vehicle motion and orientation using optical flow,” in Proceedings of the
IEEE/IEEJ/JSAI International Conference on Intelligent Trans-portation Systems (ITSC ’99), pp. 25–30, Tokyo, Japan, October
1999.
[6] Z. Hu and K. Uchimura, “Tracking cycle: a new concept for simultaneous tracking of multiple moving objects in a typical traffic scene,” in Proceedings of IEEE Intelligent Vehicles
Symposium (IV ’00), pp. 233–239, Dearborn, Mich, USA,
October 2000.
[7] N. Ancona, “A fast obstacle detection method based on optical flow,” in Proceedings of the 2nd European Conference on
Computer Vision (ECCV ’92), pp. 267–271, Santa Margherita
Ligure, Italy, May 1992.
[8] D. Willersinn and W. Enkelmann, “Robust obstacle detection and tracking by motion analysis,” in Proceedings of IEEE
[9] A. M. Waxman and J. H. Duncan, “Binocular image flows: steps towards stereo-motion fusion,” IEEE Transactions on
Pattern Analysis and Machine Intelligence, vol. 8, no. 6, pp. 715–
729, 1986.
[10] L. Li and J. H. Duncan, “3-D translational motion and structure from binocular image flows,” IEEE Transactions on
Pattern Analysis and Machine Intelligence, vol. 15, no. 7, pp.
657–667, 1993.
[11] W. Wang and J. H. Duncan, “Recovering the three-dimensional motion and structure of multiple moving objects from binocular image flows,” Computer Vision and Image
Understanding, vol. 63, no. 3, pp. 430–446, 1996.
[12] Y. Zhang and C. Kambhamettu, “On 3-D scene flow and structure recovery from multiview image sequences,” IEEE
Transactions on Systems, Man, and Cybernetics B, vol. 33, no.
4, pp. 592–600, 2003.
[13] G. Sudhir, S. Banarjee, K. Biswas, and R. Bahl, “Cooperative integration of stereopsis and optical flow computation,”
Journal of the Optical Society of America A, vol. 12, no. 12, pp.
2564–2572, 1995.
[14] S. P. Clifford and N. M. Nasrabadi, “Integration of stereo vision and optical flow using Markov randomfields,” in
Pro-ceedings of IEEE International Conference on Neural Networks,
vol. 1, pp. 577–584, San Diego, Calif, USA, July 1988. [15] A. P. Tirumalai, B. G. Schunck, and R. C. Jain, “Dynamic stereo
with self-calibration,” IEEE Transactions on Pattern Analysis
and Machine Intelligence, vol. 14, no. 12, pp. 1184–1189, 1992.
[16] T. Dang, C. Hoffmann, and C. Stiller, “Fusing optical flow and stereo disparity for object tracking,” in Proceedings of the
5th IEEE International Conference on Intelligent Transportation Systems (ITSC ’02), pp. 112–117, Singapore, September 2002.
[17] B. McCane, K. Novins, D. Crannitch, and B. Galvin, “On benchmarking optical flow,” Computer Vision and Image
Preliminaryȱcallȱforȱpapers
The 2011 European Signal Processing Conference (EUSIPCOȬ2011) is the
nineteenth in a series of conferences promoted by the European Association for
Signal Processing (EURASIP,www.eurasip.org). This year edition will take place
in Barcelona, capital city of Catalonia (Spain), and will be jointly organized by the Centre Tecnològic de Telecomunicacions de Catalunya (CTTC) and the Universitat Politècnica de Catalunya (UPC).
EUSIPCOȬ2011 will focus on key aspects of signal processing theory and
li ti li t d b l A t f b i i ill b b d lit
OrganizingȱCommittee
HonoraryȱChair
MiguelȱA.ȱLagunasȱ(CTTC)
GeneralȱChair
AnaȱI.ȱPérezȬNeiraȱ(UPC)
GeneralȱViceȬChair
CarlesȱAntónȬHaroȱ(CTTC)
TechnicalȱProgramȱChair
XavierȱMestreȱ(CTTC)
Technical Program CoȬChairs
applications as listed below. Acceptance of submissions will be based on quality, relevance and originality. Accepted papers will be published in the EUSIPCO proceedings and presented during the conference. Paper submissions, proposals for tutorials and proposals for special sessions are invited in, but not limited to, the following areas of interest.
Areas of Interest
• Audio and electroȬacoustics.
• Design, implementation, and applications of signal processing systems.
l d l d d
TechnicalȱProgramȱCo Chairs
JavierȱHernandoȱ(UPC) MontserratȱPardàsȱ(UPC)
PlenaryȱTalks
FerranȱMarquésȱ(UPC) YoninaȱEldarȱ(Technion)
SpecialȱSessions
IgnacioȱSantamaríaȱ(Unversidadȱ deȱCantabria)
MatsȱBengtssonȱ(KTH)
Finances
Montserrat Nájar (UPC) • Multimedia signal processing and coding.
• Image and multidimensional signal processing. • Signal detection and estimation.
• Sensor array and multiȬchannel signal processing.
• Sensor fusion in networked systems. • Signal processing for communications. • Medical imaging and image analysis.
• NonȬstationary, nonȬlinear and nonȬGaussian signal processing.
Submissions
MontserratȱNájarȱ(UPC)
Tutorials
DanielȱP.ȱPalomarȱ (HongȱKongȱUST)
BeatriceȱPesquetȬPopescuȱ(ENST)
Publicityȱ
StephanȱPfletschingerȱ(CTTC) MònicaȱNavarroȱ(CTTC)
Publications
AntonioȱPascualȱ(UPC) CarlesȱFernándezȱ(CTTC)
I d i l Li i & E hibi
Submissions
Procedures to submit a paper and proposals for special sessions and tutorials will
be detailed atwww.eusipco2011.org. Submitted papers must be cameraȬready, no
more than 5 pages long, and conforming to the standard specified on the EUSIPCO 2011 web site. First authors who are registered students can participate in the best student paper competition.
ImportantȱDeadlines:
P l f i l i 15 D 2010
IndustrialȱLiaisonȱ&ȱExhibits
AngelikiȱAlexiouȱȱ (UniversityȱofȱPiraeus) AlbertȱSitjàȱ(CTTC)
InternationalȱLiaison
JuȱLiuȱ(ShandongȱUniversityȬChina) JinhongȱYuanȱ(UNSWȬAustralia) TamasȱSziranyiȱ(SZTAKIȱȬHungary) RichȱSternȱ(CMUȬUSA)
RicardoȱL.ȱdeȱQueirozȱȱ(UNBȬBrazil)
Webpage:ȱwww.eusipco2011.org
Proposalsȱforȱspecialȱsessionsȱ 15ȱDecȱ2010
Proposalsȱforȱtutorials 18ȱFeb 2011
Electronicȱsubmissionȱofȱfullȱpapers 21ȱFeb 2011
Notificationȱofȱacceptance 23ȱMay 2011