C. J. Siero
Biomedical Engineering
3rd of September 2015, Enschede
Master Thesis
In vitro studies of the interaction between α-synuclein and SNAREs
University of Twente
Faculteit Technische Natuurwetenschappen
Department of Nanobiophysics
Examination Committee
Prof. Dr. Ir. M. M. A. E. Claessens NBP
Dr. C. Blum NBP
2
Abstract
Previous studies have hinted at the role of α-synuclein on the SNARE mediated release of synaptic vesicles and one of these studies has shown an interaction between α-synuclein and one of these SNARes, synaptobrevin1-4. Thus far no information is available on the affinity of α-synuclein with the
SNAREs in terms of dissociation constant. No data is known about the strength of the interaction between α-synuclein and synaptobrevin or if any interaction takes place between α-synuclein and the SNAREs SNAP25 and syntaxin at all. The affinities between α-synuclein and these three SNAREs have been investigated in this report.
The SNAREs have been produced and purified untill the desired concentrations and purity of protein has been achieved. Using the first plasmid constructs to produce these SNAREs resulted in low production yield and a high concentration of impurities. Attempts have been made to optimize the production of the SNAREs but these results did not fulfill the requirements. The requirements have been met with the acquisition and production of new plasmid constructs of the desired SNAREs. The affinity for the interaction between α-synuclein and the SNAREs was analyzed using microscale thermophoresis. One of the interacting partners was labelled covalently and the other binding partner was used to create a serial dilution series to find the dissociation constant of the interaction between the α-synuclein and the SNAREs.
The α-synuclein protein was shown to interact with all three of the SNAREs however the interaction between synuclein and synaptobrevin proved to be of higher affinity than the interaction of α-synuclein with SNAP25 or syntaxin. The interaction between α-α-synuclein and synaptobrevin is not dependent on the isoelectric point of the molecules but an increase in Ca2+ concentration increases
the affinity between these proteins. Both the α-synuclein and the synaptobrevin interact with Ca2+
-ions and upon monitoring the binding between these proteins in condit-ions of increasing Ca2+
3
Table of Contents
Abstract ... 2
Table of Contents ... 3
Introduction ... 5
Parkinson’s disease ... 5
Parkinson’s disease and α-synuclein ... 5
Synaptic transmission ... 6
SNAREs ... 7
Protein production ... 9
Recombinant protein biosynthesis ... 10
Microscale Thermophoresis ... 12
Research Goal ... 17
Results ... 19
Protein Production ... 19
Improving concentration and purity of SNAREs ... 20
New constructs ... 22
Binding affinity determination ... 24
α-Synuclein with Synaptobrevin B2 ... 24
Charge screening effects on α-synuclein and synaptobrevin interaction ... 26
Interaction of α-synuclein with SNAP25 and syntaxin 1a ... 28
Effect of Ca2+-ions on the binding of α-synuclein with synaptobrevin ... 29
Discussion ... 33
Conclusion ... 35
Recommendations ... 37
Materials and Methods ... 41
Expression of SNAREs ... 41
Purification of expressed SNARE proteins ... 42
Expression and purification of α-synuclein ... 43
Labelling of proteins ... 43
Microscale Thermophoresis ... 44
Acknowledgements ... 45
5
Introduction
Parkinson’s disease
They symptoms of Parkinson’s disease were first described by the English doctor James Parkinson in 1817 as uncontrolled body movements of patients with a shaking palsy. Later the cause of this condition was named after James Parkinson, the first to describe its symptoms with remarkable accuracy, as Parkinson’s disease. Currently Parkinson’s disease is the second most common degenerative disease of the nervous system, only surpassed by Alzheimer’s disease. Parkinson’s disease is characterized by motor symptoms such as uncontrollable tremors during rest, rigidity and bradykinesia, and neuropsychiatric symptoms including disorders in speech, cognition, mood, behaviour, and thought8. The tremor is the most apparent and common symptom of Parkinson’s
disease in which the tremor is most severe at rest and has been known to disappear during voluntary motion and sleep. Rigidity of movement is caused by an excessive and continuous contraction of muscles which results in stiffness and resistance to limb movement. Bradykinesia is a symptom of Parkinson’s disease which results in difficulties during the whole process of the movement of a limb. These processes range from initiation to execution of the movement and result in slowness of movement. This effect depends on the activity and/or emotional state of the patient8. These
symptoms of Parkinson’s disease are a result of degeneration of the neuronal network in the brain.
Parkinson’s disease and α-synuclein
Pathologically Parkinson’s disease is recognized by the patient’s gradual loss of dopamine producing neurons in the brain, especially in the substantia nigra section of the brain which is among other things associated with movement. Lewy bodies have been formed in the dopamine producing regions of the brain of Parkinson’s disease patients. These Lewy bodies are mainly made up of the α-synuclein protein which has been shown to play an influential role in Parkinson’s disease. Mutations in the α-synuclein protein have been observed in the familial forms of Parkinson’s disease in which the mutation results in an early age onset of Parkinson’s disease, rapid development of Parkinson’s disease, and high occurrence of dementia associated with Parkinson’s disease. The mutated α-synuclein protein induces cell death in the familial form of Parkinson’s disease, and elevated concentrations of normal or mutated α-synuclein can result in Lewy bodies and Parkinson’s disease. The α-synuclein protein has a length of 140 amino acids and is highly expressed by the dopaminergic neurons in the substantia nigra pars compacta8. In these neurons the α-synuclein is concentrated in
the nerve terminus close to the synaptic vesicles. The α-synuclein protein belongs to the ‘natively unfolded’ proteins because of the absence of secondary configuration in aqueous solution resulting in a seemingly random-coil structure9. In the α-synuclein molecule three regions are distinguished.
The N-terminal part (amino acids 1-60) contains most of seven imperfect eleven residue repeats which acquire an α-helical configuration when associated with phospholipids9,14. The central part
6
properties typical for folded proteins, the properties of the C-terminal region dominate the properties of the whole protein; resulting in α-synuclein being a natively unfolded protein.
In a healthy person the α-synuclein protein is mostly present in the brain and typically located at the end of neuronal cells. The role of α-synuclein in the process of neuronal function and synaptic transmission is not fully understood, however there is evidence that α-synuclein plays an important role in neurotransmitter release and presynaptic vesicle control. Knockout of α-synuclein has resulted in an altered dopamine release and increased vesicle refilling rate of the presynaptic vesicles2. Sudden increase of α-synuclein concentration by injecting α-synuclein in the neuron results
in increased and long lasting synaptic transmission and can recover α-synuclein knockout in mice4. It
is clear that α-synuclein has an effect on the release of neurotransmitters, however how α-synuclein affects the mechanism of synaptic transmission is still to be investigated.
Synaptic transmission
Synaptic transmission is the process by which a neuronal signal is transmitted from one neuronal cell to the next. The site of signal transmission is called a synapse which are the functional contacts between neurons. There are two types of synapses which can be distinguished based on the mechanism of transmission. There is the electrical synapse where current flows through the neurons by specialized membrane channels called gap junctions. These synapses allow for direct passive ionic current flows from the upstream neuron into the downstream neuron by direct linking the gap junction in both neurons. Synaptic transmission by electrical synapses is bidirectional allowing the ionic current to flow in either direction, this depends in which of the neurons the action potential origionates. The neuron where the action potential arrives is the upstream neuron while the neuron on the other side of the gap junctions is the downstream neuron to which the action potential is transmitted. The gap junctions are composed of pores from both the upstream and downstream neurons aligned to form a channel. The other form of synaptic transmission is achieved by the chemical synapses in which transmission is achieved by secretion of chemical agents, neurotransmitters, into the synaptic cleft between the upstream and downstream neurons. Upon crossing the synaptic cleft these neurotransmitters will activate receptors in the downstream neuron to trigger an action potential in the downstream neuron.
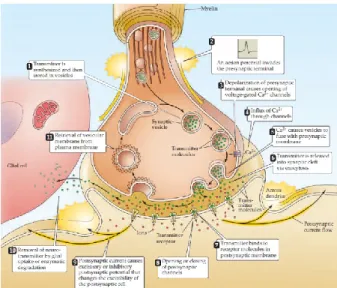
The steps in signal transmission for chemical synapses are shown schematically in Figure 17.
In the rest state of neurons synaptic vesicles, spherical lipid bilayers of phospholipids with a radius of 40 nm are formed and docked near the synapse of the neuron10. Upon the arrival of
an action potential, change of membrane potential of the normally negatively charged neuronal cell as a result of influx of Na+, K+ or
Ca2+ gated ion channels, the Ca2+ channels at
the terminus of the neuron open. The influx of Ca2+ ions increases the Ca2+ concentration from
0.1 µM to 100 µM, causing the docked presynaptic vesicles to fuse with the cell membrane, which is composed of a
7 lipid bilayer with a protein-to-phospholipid ratio of 1:32,7,10. Fusion of the presynaptic vesicle with the
cell membrane releases the contents of the presynaptic vesicle into the synaptic cleft between the neurons. Upon crossing the synaptic cleft the neurotransmitters bind to the receptors of the postsynaptic neuron resulting in an excitatory or inhibitory change in membrane potential. The excitatory change causes the ion channels to open and increases the membrane potential, while an inhibitory change causes a drop in membrane potential. If the resulting change in membrane potential, as a result of multiple neurotransmitters binding to receptors and opening ion channels, exceeds the activation threshold an action potential is created in the postsynaptic neuron. The neurotransmitters in the synaptic cleft are taken up by glial cells or degradated by enzymes to limit the time neurotransmitters are effective. Synaptic vesicles are recycled or new synaptic vesicles are formed from the cell membrane and once again docked for a next action potential.
The fusion of two phospholipid bilayers is no easy feat to accomplish. In order to fuse the synaptic vesicles with the cell membrane an energy barrier needs to be overcome. The SNAREs are a protein family which facilitate docking of synaptic vesicles to the cell membrane and lowers the energy barrier to overcome before fusion occurs2.
SNAREs
Fusion of two separate negatively charged phospholipid bilayers in an aqueous environment requires overcoming a major activation energy barrier. Upon arrival of an action potential multiple synaptic vesicles need to be fused with the cell membrane. This requires multiple synaptic vesicles to be ready and waiting for the action potential to arrive upon which this triggers simultaneous fusion of the docked synaptic vesicles with the cell membrane. Phospholipid bilayers are formed when amphipatic phospholipids, which have both a hydrophilic and a hydrophobic region, try to deal with these conflicting affinities towards water. These phospholipids aggregate in a lipid bilayer with the hydrophilic heads exposed to the outside while the hydrophobic tails are shielded inside of the lipid bilayer. This structure, combined with the different affinities for water, makes these lipid bilayers resilient to changes in structure as disruptions will be repaired by rearrangement of the phospholipids. Close proximity of two intact lipid bilayers alone is not enough to induce fusion, instead both these phospholipids bilayers also need to be disrupted to favour fusion of both membranes over restoration of both membranes. The bilayer disorder requires the naturally shielded hydrophobic regions in the bilayers to be exposed in such a way that allows rearrangement of individual lipids or lipid clusters between the adjacent lipid bilayers and leads to eventual fusion of the lipids2,11.
The SNAREs (SNAP (Soluble NSF Attachment Protein) Receptor) are a family of proteins which mediate the fusion of vesicles with their target membranes. The SNAREs contain a characteristic sequence of about 60 amino acids, the SNARE-motif, which can assemble with other SNAREs to form a SNARE-complex composed of four SNARE-motifs. The four SNARE-motifs in the SNARE-complex are folded into a tight four-helical bundle containing four types of SNARE-motif, classified R, Qa, Qb and Qc based on sequence structure and central region. Upon formation of the SNARE-complex some of the SNAREs are incorporated into the membrane of the vesicle (v-SNAREs) while other SNAREs are located in the target membrane (t-SNAREs)12. The formation of the SNARE-complex forces the v- and
t-SNAREs to be in close proximity and this drags the attached cargo of the v-SNARE close to the cell membrane to whicht the t-SNARE is embedded12. Both negatively charged lipid bilayers are now
8 bilayers.
The t-SNARE used in release of neurotransmitters is synaptobrevin (or VAMP, Vesicle Associated Membrane Protein) which is incorporated in the vesicle by the C-terminal transmembrane region and has the R-SNARE-motif exposed in the cytosol to allow for SNARE-complex formation. The t-SNAREs corresponding to neurotransmitter release are syntaxin and SNAP-25. The syntaxin is connected with the cell membrane by a C-terminal transmembrane region exposing the SNARE-motif exposed in the cytosol. The SNAP-25 protein is docked onto the cell membrane by forming four covalent bonds between cysteine residues in the middle of the protein and palmitoyl side-chains of the cell membrane. Two of the four motifs of a complex are found in SNAP-25, both SNARE-motifs are exposed in the cytosol of the cell but one of those regions is to be found close to the docking site of the protein. This forces the whole SNARE-complex to be located near the cell membrane and hereby ensures that the vesicle and the cell membrane are close together2,11.
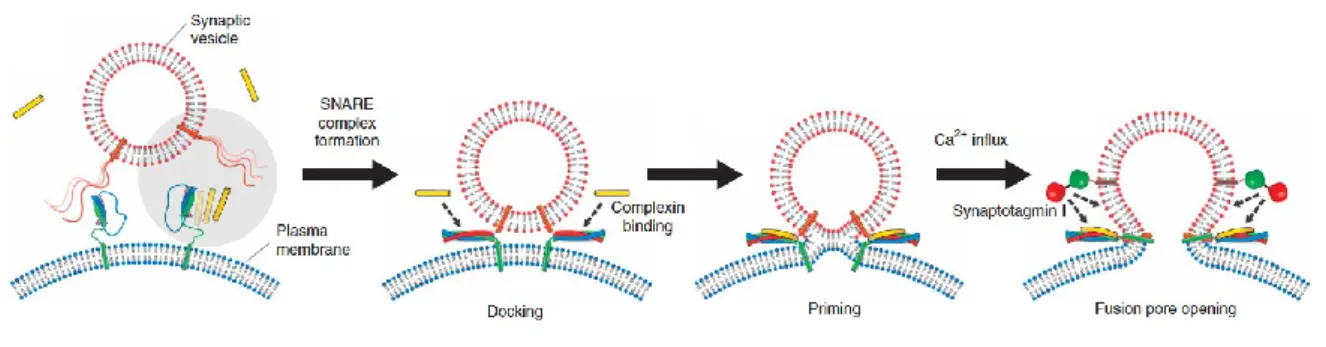
Figure 2: Schematic diagram of presynaptic vesicle docking, priming and SNARE mediated Ca2+-triggered
neurotransmitter release.
The steps leading to formation of the SNARE-complex and the fusion of the vesicle with the cell membrane are illustrated in Figure 2. Synaptic vesicles filled with an incorporated synaptobrevin molecule approach the cell membrane as a result of diffusion and Van der Waals interactions. When the v-SNARE and the t-SNAREs interact to form the SNARE-complex, the vesicle is docked to the cell membrane. Upon binding of the protein complexin with the SNARE-complex , the docked vesicle is primed. Addition of the complexin lowers the energy barriers for vesicle fusion by changing the structure of the lipid bilayers of both the vesicle and the cell membrane in such a way that both bilayers are disrupted without forcing negatively charged phospholipids close together2,13. Influx of
Ca2+ ions, upon arrival of the action potential, triggers the protein synaptotagmin to further lower the
fusion energy barrier to achieve fast fusion-pore opening to release the neurotransmitters into the synaptic cleft2,13,14.
As synaptotagmin is a Ca2+-sensitive trigger for vesicle fusion, the triggered release of
neuro-transmitters is dependent on the arrival of an action potential and the following influx of Ca2+ ions15.
The synaptotagmins are a family of single membrane proteins which occur predominantly in neurons. The synaptotagmins are characterized by their transmembrane region, a variable linker and two C-terminal C2-domains. The C2-domains, in most members of the syntaxin family, are capable of binding Ca2+-ions. This makes most members of the synaptotagmin family a Ca2+-sensor which
couples the Ca2+-influx upon arrival of an action potential to the fast release of neurotransmitters.
This has been confirmed by experiments showing that deletion of the synaptotagmin 1 gene in fruit flies and mice results in a loss of neurotransmitter release upon arrival of an action potential16,17.
9 the SNARE vesicle fusion machinery, are still unclear, but it is expected that the binding of Ca2+ to the
C2-domains results in forcing the different membranes together2. Bringing the membranes of the
vesicle and the plasma membrane together may facilitate formation of a transition state or destabilize the membrane during transition states. Hereby synaptotagmin 1 is expected to mediate the neurotransmitter release upon the arrival of an action potential at the end of the terminus of the presynaptic neuronal cell11.
Studying the fundamentals of interactions occurring during synaptic transmission requires the experimental conditions to be as simple as possible to be able to determinatine which particles interact and exactly how these particles interact with each other. In these simplified experimental conditions the interactions need to be studies outside of the cell to prevent cellular components affecting the interaction one way or another. To achieve pure proteins outside of a cell, these proteins need to be produced in a high concentration and purified.
Protein production
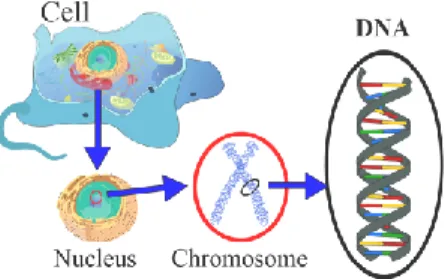
In eukaryotic cells the genetic information (e.g. instructions for development, functioning and reproduction) is stored in the chromosomes of the cell. The chromosomes are located in the cell’s nucleus and are a densely packaged and organized structure containing most of the DNA of the organism, this is schematically visualized in Figure 3. The DNA (Deoxyribonucleic acid) itself consists of two complementary strands of polynucleotide chains in an α-helical configuration held together by hydrogen bonds between the nucleotides of the chains. Several different molecules play a role in condensing the DNA molecule into the chromosome structure
of the cells. After interacting with other proteins and forming hydrogen bonds between the complementary strands, the DNA is safely protected from damages but is also hindered in the production of proteins from its genetic information. The road from the genetic information stored in the DNA to the resulting proteins is known as gene expression and this is tightly regulated. The two main steps in gene expression are transcription and translation12.
The first main step in the gene expression is transcription of the double stranded DNA into the single stranded mRNA (messenger ribonucleic acid). This step occurs in the cell nucleus and is tightly regulated by a number of different factors before the chromosome reveals its information. As the need for a specific protein arises only the corresponding location of the genetic information is uncoiled and made available for transcription. Once the DNA strand is freed from most proteins and uncoiled an enzyme called RNA polymerase attaches itself to the promotor site on one of the DNA strands to initiate transcription of DNA into RNA. In this process the enzyme RNA polymerase breaks the hydrogen bonds between the two strands and starts attaching RNA nucleotides complementary to the DNA strand. The RNA polymerase runs along the gene of the DNA and keeps elongating the single RNA strand untill the RNA polymerase reaches the stop site of the gene upon which it releases from the DNA. As the RNA polymerase moves along the DNA strand, the RNA strand is formed and elongated as the RNA polymerase continues. All the while only 8 nucleotides of one RNA strand are able to form a DNA hybrid at the same time. As the RNA polymerase moves further the RNA-DNA hybrid is broken and the growing RNA strand is released from the RNA-DNA. After passing of the RNA
10
polymerase the DNA reestablishes its double stranded form and other proteins attach themselves to the DNA again to reform its densely packed form12.
After transcription of double stranded DNA into single stranded RNA, the RNA is exported out of the cell nucleus and into the cytoplasm for translation, displayed in Figure 4. During translation the linear sequence of the nucleotides is translated into a linear sequence of amino acids, the building blocks of proteins. This translation is enabled by a ribosome, a complex of over 50 molecules, which work together to translate the sequence of mRNA into a sequence of amino acids. Every combination of three RNA nucleotides is called a codon and every codon corresponds to an amino acid. In the ribosome the amino acid corresponding to that codon is covalently linked to the previous amino acid to form the protein. The amino acid chain is produced starting with the N-terminus of the protein and stops once the ribosome reaches the stop codon. The stop codon itself does not encode for an amino acid and upon reaching the stop codon, the ribosome dissociates and releases the newly formed protein into the cytosol. Proteins are not only a strand of amino acids but have a three dimensional structure which is formed by polar interactions, hydrophobicity, hydrogen bonds (results in α-helixes and β-sheet) and disulphide bonds. In some cases the structure of a protein is affected by other proteins, multiple protein subunits interact together, non-covalently, to form a single complex with a characteristic configuration12.
The road from transferring the genetic information in the DNA into a functional protein is complicated as there are many factors involved in the regulation of gene expression. While this is a successful method to produce proteins, this typically results in low protein concentrations as the host’s own expression mechanism regulates the production of proteins. Acquiring a high protein concentration can be achieved using recombinant DNA encoding for the desired protein and increasing the promotor concentration to induce overexpression of the recombinant DNA.
Recombinant protein biosynthesis
With the understanding how proteins are produced in normal eukaryotic cells, the proteins can also be expressed in other cells. By using genetic manipulation many types of cell can be manipulated to make proteins which normally are not present in those cells or overexpress proteins to concentrations above the standard. Overexpression of proteins is used as a method to acquire proteins of interest. Insulin was one of the first proteins which has been produced by transfecting a cell with non-native DNA and overexpressing this protein.
Transfection of cells occurs in multiple steps, see Figure 5. The first step is to prepare the plasmid (small circular DNA molecules) for transfection by opening the foreign DNA vector just after the promotor and inserting the DNA encoding for the desired protein and closing it afterwards. Next the DNA is inserted into the host cell by applying stress (electric or heat) on the cells after which the cell membrane is temporarily disrupted and the plasmid can enter the host cell12.
11 The plasmid will be expressed in the host cell by the processes occurring
naturally in the host cell, this will result in a small concentration of the inserted DNA. It is common practice, when using bacteria as host cells, to use nutrients with an antibacterial agent and incorporate a resistance to that specific antibacterial agent in the inserted DNA. This addition will result in only maintaining the hosts for which the transfection has been successful, as only successfuly transfected bacteria will be able to survive from the nutrient source and expand. When adding an activator protein to the hosts, the promotor sequence the will be fully functional and transcription will be triggered. These activators (e.g. IPTG) are used to induce overexpression of the inserted DNA segment and result in high concentrations of the corresponding protein in the host cell12,18.
The produced proteins are trapped in the host cells, these host cells will have to be broken down by cell lysis to extract the protein. During cell lysis of the host cells the produced proteins must be protected from oxidation, degradation of the protein by enzymes and contamination. Cell lysis occurs by means of disrupting the host’s cell membrane as a result of viral, chemical (osmotic or detergents), enzymatic (lysozyme) or mechanical (sonification) mechanisms. During lysis other agents can be
added to break down large non-protein structures in the cell, stop enzymes from harming proteins and allow proteins to acquire their natural conformation by binding with ions. Typical examples of these are DNAse to break down DNA, PMSF to block protease and urea to extract and protect proteins from inclusion bodies12,19.
The proteins must be purified from the mixture of all the cellular components. This can be done in several ways; size exclusion, charge separation, affinity chromatography and hydrophobicity. For proteins which do not have properties which makes it easy to separate them using these techniques, a recognizable sequence is added to the inserted DNA in such a way that the extra sequence is attached to the protein. The extra sequence contains a region by which the protein is easy to recognize, such as a polyhistidine region, antibodies or an antigen. Antibodies and antigen bind to one another, using a column with the opposite partner will result in the protein attaching to the column. Using a cleavage enzyme the added sequence can be cleaved from the main protein to release the proteins from the column. The polyhistidine region, or HisTag, is a region with a sequence of 6 to 8 histidines at the N- or C-terminus of the protein. The amino acid histidine has a strong affinity to divalent metal ions such as nickel. Passing a solution with HisTagged proteins through a column with divalent metal ions will result in accumulation of these proteins in the column. Using high concentrations of imidazole the HisTagged proteins can be eluted from the column because imidazole, with a higher affinity for divalent metal ions, competes with the HisTag for the surface area in the columns20-22.
Purified proteins need to be characterized to observe the purity, concentration and type of protein. Depending on the type of purification used multiple types of protein can end up being purified as all these protein properties for purification are similar20. Protein characterization can be performed
using mass chromatography or SDS-PAGE to analyze the contents of the samples upon elution of the purification22. Using mass spectroscopy the protein sample will be reduced to charged fragments and
12
the ratio between the charged fragments will provide critical information on the composition of the sample analyzed, e.g. types of protein, purity and concentration. SDS-PAGE (sodium dodecyl sulphate-polyacrylamide gel electrophoresis) is a method to compare the molecular weight of a sample of proteins against reference proteins. During SDS-PAGE the SDS molecules aggregate at the hydrophobic sites of the protein hereby inducing a “reconstructive denaturation”. In this induced conformation the protein has a mix of α-helical and random-coiled structures. Applying an electrical field, during the electrophoresis, will separate proteins based on their mass-to-charge ratio. The charge will be the result of attachment of the anionic SDS molecules to the protein and the of protein’s natural charge. As both the proteins under investigation and the proteins used for molecular weight calibration undergo the same treatment, this method proves to be a good indicator for the molecular weight of the sample proteins with respect to the calibration proteins23. Using a
dye (e.g. Coomassie Brilliant Blue which interacts with positive amine groups and forms Van der Waals interactions24,25) to stain the protein will provide an estimate of the purity of the sample and
give an indication of the size of the proteins in the purified sample. The concentration of the full protein mixture can be determined by means of UV absorption20.
After the production and purification of the proteins, these proteins can be analyzed to discover their properties. There are several powerful methods suitable to monitor interactions occurring to proteins, each method with its own capabilities, strengths and weaknesses.
Microscale Thermophoresis
There are several successful methods to determine the affinity of an interaction between biomolecules, however these types of detection typically require large sample quantities, controlled conditions and significant changes to allow detection. This leads to some disadvantages to these methods of analysis of interaction, first because large quantities of sample proteins are expensive to produce in high purities. Secondly, the requirement of controlled conditions in some methods of detection limits the effectiveness of these methods. Putting restraints on the conditions used for the determination for interaction between biomolecules, limits the representability of the determined results in biological liquids. And last, interaction between biomolecules often results in small changes as the molecules involved can be very small and the interaction will result in a slight change in e.g. mass, charge or configuration change making it hard to detect these changes26-28. Microscale
thermophoresis is a very sensitive all-optical technique, able to detect small changes requiring only very small sample quantities even in complex solutions by making use tracking of fluorescent particles moving as a result of thermodiffusion.
Thermodiffusion is the effect of molecules behaving differently if affected by a small temperature change (typically 1-7 K). Upon a change of temperature, thermophoresis induces a movement onto particles or molecules to move into or out of the heated area resulting in a accumulation or depletion of molecules as a result of thermodiffusion. Typically molecules deplete from regions with an increased temperature but the reversed effect can also occur. The amount and direction of thermodiffusion depends on the size, charge, hydration shell, conformation of the particles or molecules and the temperature gradient used for thermodiffusion. The thermodiffusion is balanced by ordinary diffusion resulting in a steady state between these types of diffusion26,27.
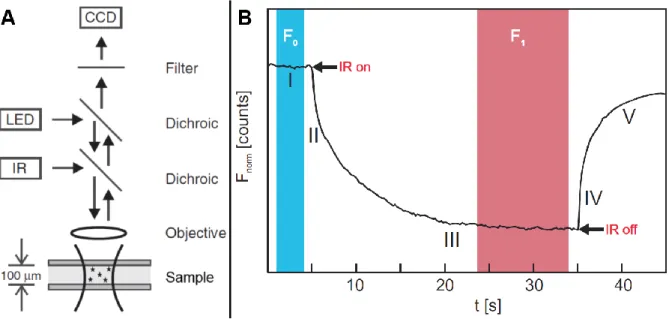
13 optical path is focused onto the sample by an objective allowing excitation of the particles in the focus. At least one of the particles or molecules involved in the interaction should be traceable by the fluorescence excitation. Tracing of molecules can be obtained by using the intrinsic fluorescence of a protein, using a fluorescent fusion protein or attaching a fluorescent label to the protein. The photons emitted from the sample travel through the filter and the dichroic mirrors and can be recorded, e.g. by a CCD camera. The IR laser creates a small temperature change to induce the migration of small particles and molecules on a microscale as a result of thermodiffusion until a steady-state between normal diffusion and thermodiffusion is reached.
A schematic time trace of a MST measurement is displayed in Figure 6-B and five different phases can be identified in the MST measurement. The first phase is the initial fluorescence (I) recorded by emission of particles or molecules before the IR-laser has been initiated. Any change in signal in this region is the result of bleaching of fluorescent particles and normal diffusion of molecules. After initiation of the IR-laser two phases are observed, first the T-jump (II) is the change (within 100 ms after activation of the IR-laser) in fluorophore emission as a result of temperature change by the activation of the IR-laser. After the initial change in signal upon activation of the IR-laser, thermophoresis (III) is the driving force in signal change. During the thermophoresis phase a balance is reached between the thermodiffusion and normal diffusion resulting in a steady-state. Upon deactivation of the IR-laser a fast inverted T-jump (IV) is observed before gradually a steady-state is restored by backdiffusion (V) as a result of normal diffusion.
Figure 6:A) Schematic overview of a MST setup in which an IR-laser and a LED are coupled into the same optical path to ensure that the sample heated by the IR-laser is at the same spot as the area monitored by the LED excitation/emission of traceable particles. B) Schematic representation of a fluorescence time trace recorded by MST. The time trace is composed of five processes happening over time. The initial fluorescence (Finitial in phase I) is measured before the
IR-laser is activated. Once the IR-IR-laser is initiated the in the first 100 ms the T-jump (II) is observed while afterward the thermophoresis (Fsteady-state in phase III) dominates the signal where thermodiffusion and normal diffusion reach a
steady-state. Upon deactivation of the IR-laser an inversed T-jump (IV) is observed followed by backdiffusion (V) of particles since thermodiffusion no longer affects the steady-state.
14
the initial fluorescence is controlled by normal diffusion in a homogeneous solution. In the cases that the initial fluorescence does not stay constant, this is an effect of having fluorophore emission affected by the change in conformation as a result of its proximity to the binding site or there are problems with surface adsorption or aggregation in the solution. Inhomogeneous solutions as a result of surface adhesion and aggregation can be prevented by adding BSA to the solution to coat the surface29 and use Tris (Tris(hydroxymethyl)aminomethane)30 and Tween 20 (Polysorbate 20)31 to
prevent protein aggregation.
During the steady-state in thermophoresis (F1 in Figure 6-B) the normal diffusion and the
thermodiffusion reach an equilibrium. As the thermodiffusion of a molecule depends on properties as size, charge, hydration shell and conformation, these properties also affect the steady-state of diffusion. Any interaction between molecules changes these conditions, which results in a change in the steady-state signal of the sample depending upon the degree of interaction. The steady-state does not have to be completely reached before the differences between different samples can be observed26. Using different ratio’s of binding partners will result in a specific steady-state signal for
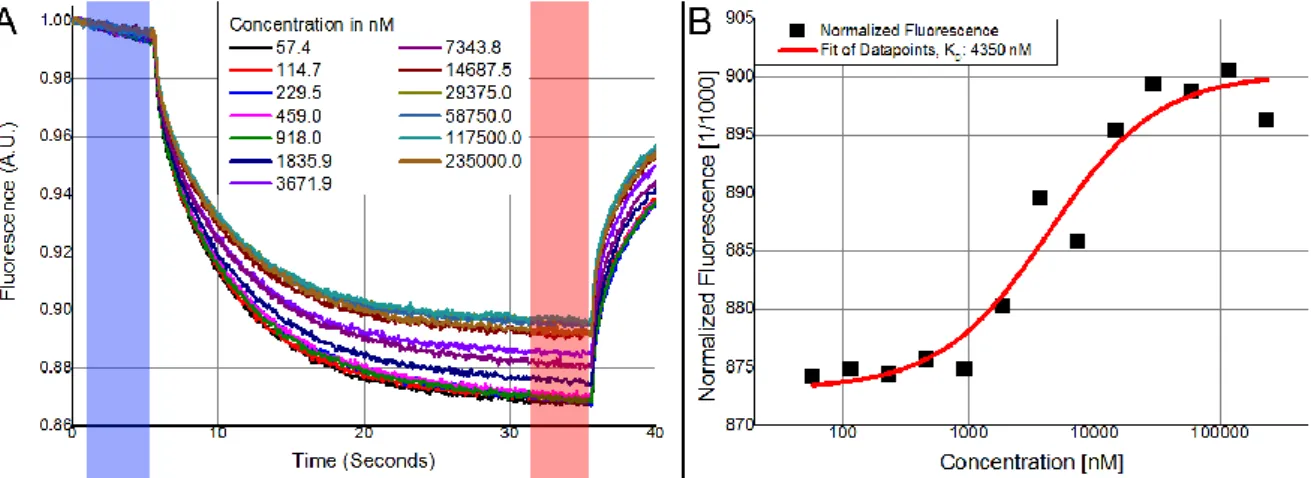
each specific ratio, ranging from completely unbound to fully interacted (this can be observed in Figure 7-A.
The degree of interaction between in the sample for different ratios can be determined by the steady-state fluorescence. As the initial fluorescence should remains constant, the ratio between the steady-state and initial fluorescence shows the degree of binding if the full extent of the binding has been observed. As only the ratio between initial and normalized fluorescence matters, the data points of each time trace are normalized by dividing all the data points by the value found at t=0 for that specific trace to have all the time traces of a full binding curve start at a value of 1. Figure 7-A an example of the normalized time traces in a complete range of binding events. Dividing the time trace by the value at t=0 does not affect the ratio between the initial fluorescence (highlighted blue in Figure 7-A and the fluorescence at the steady state (highlighted red in Figure 7-A for an individual trace, but instead allows an easy overview of the change in a binding experiment covering the full extent of binding. In the red highlighted area of Figure 7-A it the steady state signal rises for an increasing concentration of the unlabelled binding partner. Traceable particles move out of the focus upon activation of the IR-laser but increase in the unlabelled binding partner in the solution results in a higher steady-state signal. This indicates that the unlabelled particles interact with the labelled particles and keeps the labelled particles in the focus. The ratio is the normalized fluorescence (Fnorm)
and is calculated as presented in Equation 1.
𝐹𝑛𝑜𝑟𝑚=
𝐹1
𝐹0
Equation 1 Formula to calculate the normalized fluorescence (Fnorm) as the ratio between the initial fluorescence (F0) and
15
Figure 7: A) Normalized MST measurements for different concentrations of unlabelled protein with the initial fluorescence recorded in the blue highlighted area and the steady-state fluorescence recorded in the red highlighted area. B) Fnorm plotted against the unlabelled protein concentration and fitted to determine the KD of the binding
measurement.
When plotting the values of Fnorm from Figure 7-A against its corresponding concentration of the
titrated binding partner this results Figure 7-B. Near the highest and the lowest concentrations of titrated binding partner, the signals measured at steady-state start to overlap more with directly higher or lower concentrations used. In these cases the traceable particles are completely free or have fully interacted with the titrated binding partner. Changing the concentration beyond these extremes will not affect the steady-state much. Any interaction occuring has already been completed as a result of a surplus of titrated binding partner (high concentrations) or not occurring at all because of a limited availability of the unlabelled binding partner (low concentrations). The affinity between both binding partners is determined by analyzing the change in Fnorm as an effect of the
concentration of titrated binding partner. The fraction of the traceable binding partner which is bound can be derived from the Fnorm by Equation 2, this makes use of the linearity of the
thermodiffusion between the bound and the unbound state of the proteins.
𝐹𝑛𝑜𝑟𝑚= (1 − 𝐹𝐵) ∗ 𝐹𝑛𝑜𝑟𝑚,𝑢𝑛𝑏𝑜𝑢𝑛𝑑+ (𝐹𝐵) ∗ 𝐹𝑛𝑜𝑟𝑚,𝑏𝑜𝑢𝑛𝑑
Equation 2: Formula to derive the fraction of traceable binding partner (FB) from the recorded fluorescence (Fnorm) using
the fluorescence of the bound and the unbound state, Fnorm,bound and Fnorm,unbound respectively.
For an equilibrium reaction in which two different binding partners, A and B, lead to a complex (AB) the binding process is characterized by 𝐴 + 𝐵 ⇌ 𝐴𝐵. The binding affinity of this reaction is defined by the equilibrium constant KD as presented in the first part of Equation 3. In MST measurements the
concentrations of free binding partners are unknown, however the total concentrations are know as these are what the solution started with. The total concentration of each parameter is the sum of the concentration of free partner and the concentration of bound partner [𝐴] = [𝐴]𝑓𝑟𝑒𝑒+ [𝐴𝐵] and
[𝐵] = [𝐵]𝑓𝑟𝑒𝑒+ [𝐴𝐵]. Using these total concentrations instead of free concentrations of binding
partners, the equilibrium dissociation constant can be determined by the right part of Equation 3.
𝐾𝐷=
[𝐴]𝑓𝑟𝑒𝑒∗ [𝐵]𝑓𝑟𝑒𝑒
[𝐴𝐵] =
([𝐴] − [𝐴𝐵]) ∗ ([𝐵] − [𝐴𝐵]) [𝐴𝐵]
16
concentrations of free binding partners but known total concentrations and known bound concentrations, the first part has been rewritten into the second part of the equation.
Equation 4 describes how the equilibrium dissociation constant KD can be derived from the MST data
using the fraction bound FB. In this formula the titrated partner is represented by A while the fluorescence will be measured from the traceable protein B for which the concentration is kept constant. The fraction bound is expressed as the total concentration of the free parameters and the KD is the only free parameter. The fraction bound is directly reported by the Fnorm in Equation 2 to
derive the KD from the MST measurements. Plotting the Fnorm linearly against the logarithmic
concentration of the titrated partner results in a characteristic S-shaped curve with a plateaus for the unbound and the saturated states of the traceable partner, as has previously been displayed in Figure 7: A) Normalized MST measurements for different concentrations of unlabelled protein with the initial fluorescence recorded in the blue highlighted area and the steady-state fluorescence recorded in the red highlighted area. B) Fnorm plotted against the unlabelled protein concentration
and fitted to determine the KD of the binding measurement.-B.
𝐹𝐵 =[𝐴𝐵]
[𝐵] =
[𝐴] + [𝐵] + 𝐾𝐷− √([𝐴] + [𝐵] + 𝐾𝐷)2− 4 ∗ [𝐴𝐵]
2 ∗ 𝐵
17
Research Goal
It is known that α-synuclein is naturally mainly is present in the brain and especially at the end of the neurons. The location of α-synuclein is similar as the location of the SNARE proteins for the end of the neurons are the locations where synaptic transmission takes place32. The role of α-synuclein in
synaptic transmission is still unclear however it has been observed that α-synuclein plays a role in synaptic transmission and is able to bind to the cell membrane32. The α-synuclein protein has been
shown to bind with the SNARE-complex and has an affinity for the SNARE protein synaptobrevin1.
Over expression of α-synuclein inhibits neurotransmitter release whereas knock-out of α-synuclein has been shown to result in a loss of docked synaptic vesicles3, another process where SNAREs are
involved. All in all, it has been observed that the α-synuclein has an effect on synaptic transmission, but what exactly the role is, that is still unknown.
The goal of this research is to investigate the interaction between α-synuclein and the SNAREs; SNAP25, synaptobrevin 2B and syntaxin 1a. The SNAREs assemble into the SNARE-complex in the cytosol of the neurons and also α-synuclein is located in the cytosol of the neuronal cells. Already studies have shown that the α-synculein has an affinity for the soluble C-terminal part of synaptobrevin1. The interaction between α-synuclein and the SNAREs will be investigated using only
the soluble parts of the proteins. The hydrophobic transmembrane region will result in the protein to behave differently than natural conditions and leaving out regions of the protein embedded into a lipid bilayer will make the observes results more representable for the in vivo processes.
19
Results
Protein Production
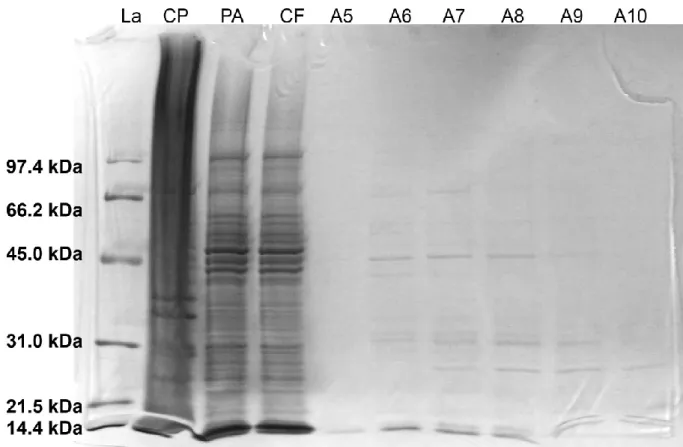
Production of the SNAREs using the method as described in the ‘Materials and Methods’ has resulted in the desired proteins, however the SDS gel shows a relatively low protein production and a high level of impurities for both methods of cell lysis. A typical example of such a SDS gel is shown in Figure 8 here different fractions of syntaxin 1a are separated by the SDS-PAGE. The His6-tagged
syntaxin 1a protein has a molecular weight of 30.6 kDa and the location of this protein should be comparable to the position of the 31.0 kDa protein used in the ladder as a reference. Instead of finding a clear band at the height of the ladder, several bands representing different kDa’s are found over several fractions.
The SDS gel displayed in Figure 8 shows that out of the complete protein solution the expressed protein has been successfuly filtered out of the protein mixture by the Ni2+-affinity chromatography.
The clear bands spread out over the different fractions are not abundantly present in the flow through, otherwise the flowthrough would have shown intense bands for these proteins. The bands in the gel which are smaller than the expected 30.6 kDa are impurities which can have been the result of degradation of the protein into smaller fragments by enzymatic activity or just natural breakdown of the protein itself. Bands larger than the expected 30.6 kDa can be the result of aggregation of multimers of the syntaxin 1a protein and complexes of degradation products with each other or with the protein.
20
The SDS gel in Figure 8 is representable for all the produced proteins using this method of protein production and purification for the initial plasmids as provided by DNF from the University of Lausanne. All the produced proteins showed a low protein yield and a high number of impurities. This method has resulted in a low concentration and insufficient purity of the proteins to perform experiment with. The results of the protein production needed to be improved to ensure better and more reliable method of SNARE production before these proteins can actually be used in further experiments.
Improving concentration and purity of SNAREs
Step by step, the road to acquiring the desired SNAREs has been analysed and improvements for purity and protein yield have been implemented. This has led to a series of repeated processes of protein production in which each time only one aspect of the protein production has been changed from the initial experiment in an attempt to reach better SNARE production. The outcome of these attempts for improvement are compared by the SDS-PAGE gel with additional controls.
Figure 9: SDS-PAGE (10% SDS) gel of syntaxin 1a. In this gel the above mentioned control samples are added to see if protein acquisition from the cell lysis suspension has been successful and to monitor the effectiveness of the Ni2+-affinity
chromatography. From left to right La (ladder), CP (cell pellet after cell lysis), PA (solution before Ni2+-affinity
chromatography), CP (collected fluid, after Ni2+-affinity chromatography) and A5-A10 are the fractions likely to contain
the syntaxin 1a protein. The bands visible in the PA sample are only slightly visible in the CP solution, this indicates that the cell pallet does not contain high concentrations of proteins. The effectiveness of Ni2+-affinity chromatography is hard
to determine based on the PA and CF samples due to the low concentration of proteins in the fractions.
21 filtering the His6-tagged proteins out of the protein solution, also shown in Figure 9. With these extra
controls the following attempts to improve protein production and purification can be monitored better.
The first step where things could have gone wrong has been during the transfection of the bacterial DNA with the plasmid. Complications with the transfection of the SNARE plasmids can have resulted in transferring damage plasmids into the bacterial DNA resulting in production of these damaged plasmids. To rule out that something has gone wrong with the transfection of the bacteria with the provided plasmids this process of bacterial transfection is repeated. After control of the protein production by SDS-PAGE the proteins still showed low yield and a relatively high amount of impurities. Repeated transfection of bacteria with the provided plasmids has shown no improvement from the initial protein production. This means that the first time transfection of the bacterial cells with the plasmids went successful and no further problems have arisen during transfection of the bacteria.
As the transfected bacteria have shown no improvement in protein production the next step in the protein production process is induction of the bacteria to produce the desired proteins. Improvement of this step has been attempted by using a fresh batch of promotor. If there was something wrong with IPTG promotor used this could also have resulted in a reduced protein production. Using a new batch of IPTG the quality of initially used IPTG can be compared by running a SDS-PAGE gel with the new proteins. The gel showed no significant effect on protein purity or yield using the new batch of IPTG.
The conditions during the protein production affect the outcome. Initially a temperature of 37 °C had been used for a duration of 4 hours. This temperature had been selected because at this temperature the enzymatic activity in the bacteria has been increased to stimulate production of proteins. However the increased enzymatic activity as a result of the elevated temperature is not restricted to enzymes taking part in the production of proteins, all enzymatic activity is increased. This includes enzymes playing a role in removal of proteins in the bacteria which can result in degradation of the desired SNAREs and affect purity and protein yield. To reduce the degradation of proteins by enzymes a colder temperature would be preferable but this would in turn reduce the production of proteins by other enzymes. In an attempt to shift the balance of produced proteins in favour of protein production the bacteria are induced at 20 °C and to compensate for reduced productive activity the induction period has been increased to 16 hours. Running a SDS-PAGE gel for this adaptation in protein production has resulted in similar production and quality as initially achieved. Reducing the temperature over an extended period of time has not resulted in an increase in protein production or increase in quality.
22
Mix has a negative effect on protecting the SNAREs a homemade lysis mixture is used to destroy the bacterial cells and easily extract the SNAREs. After confirmation of the concentration and the purity by SDS-PAGE, no improvement in these aspects has been observed. The method of cell lysis by adding the BugBuster® Master Mix has not turned out to be harmful for the SNAREs, has sufficiently protected the proteins and disabled any enzymes from harming the proteins.
New constructs
Each attempt of improvement took two weeks of time if all went well, taking into account all the steps from planning the adjustments to the procedure all the way up to evaluation of the results. After three months of trying to find out how to improve the production yield and protein quality have been in vain and no results have led to an improvement up to this point. All that could be concluded thus far was that the purification of the proteins was successful. All the steps from transfection up to cell lysis have been subject to attempts for improvement and only the quality of the constructs used for transfection have not been changed. These construct might have been damaged prior to the start of the experiments during transport or constructs unsuitable for our method of protein production might have been provided.
New plasmids were once again acquired from the DNF group from the University of Lausanne and with these plasmids BL21 bacterial cells are transfected. The proteins are produced using the initial method of protein production; standard induction of protein expression and the commercial BugBuster® Master Mix method of cell lysis to extract proteins from the bacterial cells. SDS-PAGE has been performed to function as a control for the purity and yield of protein production.
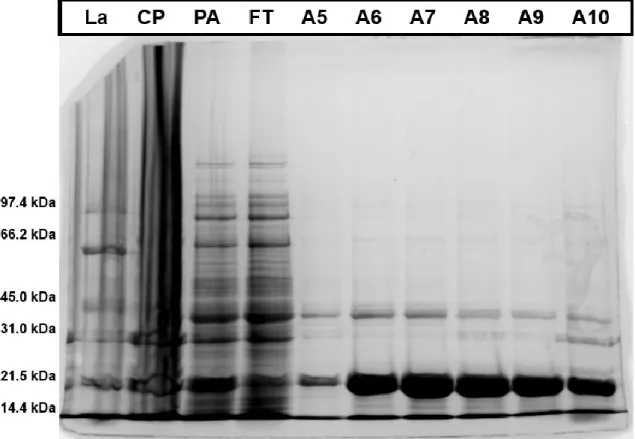
A typical example of the SDS gels is displayed in Figure 10 in which the SNAP25 protein is visualized. These new constructs result in a much higher yield and purity of proteins. The increase in protein yield can be observed by comparing the intensity of the ladder with the intensity of the protein bands in the collected fractions as the concentration of the ladder has remained the same. In the previous gels the bands in the ladder were of higher intensity when compared with the collected proteins but with the new proteins the bands of the proteins are much higher than the bands of the ladder. The ladder used contains the same concentration of proteins and only the concentration of protein in the fractions has changed.
In Figure 10 the role of the CP, PA and FT samples are also visualized better than with the low protein yield SDS gels. Amongst all the components residing in the cell pellet after cell lysis the SNAP25 protein can still be recognized to be present in the cell pellet. It is near impossible to extract all of the proteins out of the pellet so trace amounts will always be present here. The supernatant after cell lysis is the solution right before the Ni2+-affinity chromatography, but not filtered with a 0.2 µm
membrane. In this solution the presence of the SNAP25 is clearly visible and even higher then in the cell pellet. Comparing the samples before and after Ni2+-affinity chromatography (PA and FT) the
23
Figure 10: SDS gel (15% SDS) of SNAP25. The different columns loaded with samples are filled from left to right with the LA (ladder for size comparison), CP (sample of the cell pellet after cell lysis), PA (sample before nickel affinity chromatography), FT (flow through from nickel affinity chromatography) and A5-A10 (protein fractions as collected from nickel affinity chromatography).
With these new constructs production and purification of the SNAREs is successful and results in high yield and purity of the protein. The fractions showing the best yields and purity are pooled together and the protein yield is displayed in Table 1.
Table 1: Overview of the quantity of produced proteins using the new constructs
Protein Volume (ml) Concentration
SNAP25b 10 26.6 µM
Syntaxin 1a (aa 1-262) 12 37.0 µM
Syntaxin 1a (aa 1-262) 10 47.2 µM
Synaptobrevin (aa 1-96) 11 19.9 µM
24
Binding affinity determination
The protein interaction between α-synuclein and the SNAREs has been studied using microscale thermophoresis (MST). The used proteins are produced, purified, labelled and further concentrated by means of centrifugation as described in the ‘Materials and Methods’. Due to the nature of the MST experiments and the use of a serial dilution the concentration of the produced proteins needed to be increased before it was high enough to be used in the binding affinity experiments as shown below. All the MST binding affinity measurements are performed at 20% of the MST IR-laser at buffer conditions of 10 mM Tris pH 7.4, 0.5 mg/ml BSA and 0.05% Tween dissolved in MilliQ-water unless specified differently.
α-Synuclein with Synaptobrevin B2
Previous studies have indicated that there is a stronger interaction between the binding of α-synuclein and the synaptobrevin B2 protein then with the other SNAREs involved in neurotransmitter release in presynaptic terminals1. How strong these interactions between α-synuclein and the
SNAREs are has never been reported previously, while this will provide crucial information regarding the role of α-synuclein on the SNARE-complex. The dissociation constant (kD) is commonly used to
describe the affinity for protein interactions33. Because it has been indicated that the interaction
between α-synuclein and synaptobrevin B2 is stronger than with other SNAREs the binding between these two proteins will be worth looking into to discover the strength of the interaction.
Examples of the resulting dissociation equilibria for different ratios of labelled and unlabelled protein can be found in Figure 11 and Figure 12. In the results of Figure 11 α-syncuclein has been labelled while synaptobrevin has been used for the series dilution and for Figure 12 synaptobrevin has been labelled and a series dilution of α-synuclein has been used. Using both proteins as the labelled and unlabelled partner investigates effect of the choice of labelled binding partner on the calculated dissociation constant. The choice of labelled protein should not have an effect on the resulting dissociation coefficient in the interaction as the calculated kD is dependent on the ratio of free
binding partners to the complex33.
0.01 0.1 1 10 100 1000
910 920 930 940 950 960 970 Fn or m [ 1/1 00 0]
Synaptobrevin [M] Labelled -Synuclein with Synaptobrevin titration Fit - KD: 12.1 M
Labelled -Synuclein with Synaptobrevin titration at 20 MST
0.01 0.1 1 10 100 1000
910 915 920 925 930 935 940 945 Fn or m [ 1/1 00 0]
-Synuclein [M] Labelled Synaptobrevin with -Synuclein titration Fit - KD: 5.3 M
Labelled Synaptobrevin with -Synuclein titration at 20% MST
Figure 12: Determination of the binding affinity between labelled synaptobrevin and using a α-synuclein titration series at 20% of the IR-laser for MST results in a dissociation coefficient of 5.3 µM.
25 The results of Figure 11 and Figure 12 show that MST is an effective method to investigate the affinity between α-synuclein and synaptobrevin and derive the dissociation constant of these experiments. Both the binding curves in Figure 11 and Figure 12 show plateau formation, where the effects of further concentration change has diminished effects on the resulting equilibrium, below 0.1 µM and above 100 µM of the titrated partner. Fitting of these curves results in a dissociation constant, kD, in the range of 5-15 µM, this goes for the results displayed in Figure 11 and Figure 12
and for results not displayed.
While the range in kD from 5 µM to 15 µM seems broad, this is only a slight change when realizing
that the scale of the x-axis is logarithmic and a change from 5 to 15 µM on these axis will only result in a slight shift in position of the fitted curves in Figure 11 and Figure 12. The determined binding affinity for the reaction between these binding partners is in a range typical for most intrinsically disordered proteins like α-synuclein34. Besides documenting the affinity for α-synuclein with
synaptobrevin for the first time, these results also confirm that the choice in labelling one of the binding partners does not affect the resulting dissociation constant.
Interaction under denatured conditions
The protein solutions have been denatured, using a solution of 2% v/v SDS and 20 mM DTT, and their binding affinity for these proteins have been determined once again. During the denaturing process, SDS forces the proteins to lose its secondary structure while DTT breaks covalent disulphide bonds in and among proteins. Without secondary structure and covalent bonds only smaller forces (e.g. electrostatic attraction and Van-der-Waals forces) affect the interaction between these two proteins. With only small forces aiding the interaction between these two protein, it is expected that no binding takes place in the denatured solution. Any change in signal still remaining is not the result of typical protein binding, so denaturing of the protein solutions is performed to confirm that the observed signal change is the result of protein interactions.
A typical example of the MST measurement on a denatured sample has been shown in Figure 13, this is the denatured solution from the experiments shown in Figure 12. Comparing Figure 13 with Figure 12, it can be observed that in the denatured solution there is no change in Fnorm to indicate an interaction which resembles
the effect observed in Figure 12. In fact the Fnorm
observed in the denatured solution has a value comparable to the Fnorm found at the plateau
formed for low concentrations of α-synuclein in Figure 12. At these low concentrations in Figure 12 there are little interactions occurring between the two proteins and nearly no complexes of these two proteins are present. This shows that in the denatured solution no interactions between proteins occur as there is no change in Fnorm
upon increasing the concentration of α-synuclein. The few slight variations in Fnorm for the highest
concentrations of α-synculein in Figure 13 can be contributed to pipetting errors or sedimentation of the labelled partner. Since not interactions between proteins are shown in denatured solutions, all
0.01 0.1 1 10 100 1000
906 908 910 912 914 916 918 Fn or m [ 1/1 00 0]
-Synuclein [M] Labelled synaptobreving with -Synuclein titration
Labelled Synaptobrevin with [-Synuclein] titration at 20 MST
26
change in Fnorm upon increase in unlabelled protein in natural conditions can be contributed to
interaction between the proteins and thus resulting in complex formation.
For all other experiments performed the experiment has been repeated under denatured conditions with similar results. No interactions have been monitored under denatured conditions and a Fnorm
comparable to the lower plateau is recorded. The signal change of Fnorm in natural conditions upon
binding has been confirmed to originate from binding of the proteins, as denaturing the solution prevents the binding reaction to take place and results no Fnorm change can be observed.
Charge screening effects on α-synuclein and synaptobrevin interaction
As binding reaction between α-synuclein and synaptobrevin has been confirmed using MST, the details of this binding reaction can be investigated more in detail. In this section this interaction will be monitored for charge dependence of the proteins by investigating charge screening by adding NaCl to the solution.
Ions of similarly charge repel each other in solution which results in small regions with fewer ions of that particular charge. This local depletion of ions results in a screening hole for oppositely charged particles such as proteins. Increasing the number of ions in the solution reduces the effect in which the charged particles can repel each other,hereby reducing in a reduced electric field created by an individual ion as there another ion is in range to counteract the created electric field. Increasing the concentration of ions in the solution will result in effectively reducing the distance at which all charged particles can attract or repelling each other. This allows the all charged particles to approach each other unhindered to closer distances which in turn increases the binding between charged particles without being repelled.
Using labelled synaptobrevin and an α-synuclein dilution series the binding affinity has been observed under different conditions of NaCl (1, 10 and 100 µM) determine the effect of charge screening on the binding affinity of these proteins. The resulting equilibria of binding for the different concentrations of α-synuclein under different conditions can be observed in figures Figure 14-16. An overview of the found kD’s at the different NaCl concentrations is shown in Figure 17.
0.01 0.1 1 10 100 1000
902.5 905.0 907.5 910.0 912.5 915.0 917.5 920.0 922.5 925.0 927.5 930.0 932.5 Fn or m ( 1/1 00 0)
-synuclein [M]
#1, KD: 2.0 M #2, KD: 1.1 M #3, KD: 0.6 M
Labelled Synaptobrevin with -Synuclein titration
in [1 mM NaCl] at 20 MST Figure 14: Repeated experiments to determine the binding affinity between labelled synaptobrevin and using an α-synuclein titration series under 1 mM NaCl conditions show very similar curves with clear plateau formation for α-synuclein concentrations higher than 50 µM. The α-synuclein concentrations used are too high to observe the lower plateau but based on the fitting it is expected that the plateau is located around 0.05 µM of α-synuclein. The binding affinity has been studied using MST at 20% of the IR-laser and has resulted in
27 The effects of NaCl on the binding affinity are shown in an overview in Figure 17. From this figure it can be observed that there is no significant trend in the binding affinity as a result of charge screening. The discovered kD’s for the 10 mM NaCl conditions are all higher than the other buffer
conditions, but this effect only occurs at this specific condition while any affect of charge screening on the binding affinity would result in a trend increasing with NaCl concentration instead of a sudden peak at one point. While the change in dissociation constant is seems significant compared to the other measured NaCl concentrations, however the change in is minor considering the amount of
Figure 15: Triple repeated measurements of labelled synaptobrevin and using an α-synuclein titration series at 10 mM NaCl conditions show similar and overlapping curves with clear plateaus formed. The lower plateau and the higher plateau starting to occur around 0.1 µM and 100 µM of α-synuclein respectively, further increasing the concentration of α-synuclein has no effect on the recorded Fnorm beyond these plateaus.The binding
affinity of all three experiments has resulted in dissociation constants ranging from 3.4 to 4.5 µM.
0.1 1 10 100
900 905 910 915 920 925 930 935 Fn or m ( 1/1 00 0)
-Synuclein [M]
#1 KD: 4.4 M #2 KD: 4.5 M #3 KD: 3.4 M
Labelled Synaptobrevin with -Synuclein titration in [10 mM NaCl] at 20 MST
0.01 0.1 1 10 100
890 900 910 920 930 940 Fn or m ( 1/1 00 0)
-Synuclein [M]
#1, KD: 1.4 M #2, KD: 1.4 M #3, KD: 1.8 M
Labelled Synaptobrevin with -Synuclein titration
in [100 mM NaCl] at 20 MST Figure 16: Triple repeated between labelled
synaptobrevin and using an α-synuclein titration series at 100 mM NaCl conditions show similar trends in the Fnorm
upon increasing α-synuclein concentration. Formation of plateaus occurs below 0.2 µM and above 20 µM of α-synuclein with no overlap between the similar curves. While the trend in Fnorm upon increasing α-synuclein
remains similar for all three experiments, the Fnorm drops
steadily for each repeat. Despite the drop in Fnorm for
every next experiment this does not result in a large change in dissociation constants as these range from 1.4 to 1.8 µM. The steady drop in Fnorm for next
concentrations can be a result of starting self-aggregation of α-synuclein which has been known to occur more rapidly at high NaCl concentrations5,6 or an error in
sample preparation resulting in less labelled protein in the MST LED focus.
1 10 100
0 500 1000 1500 2000 2500 3000 3500 4000 4500 Kd NaCl [mM]
KD at different [NaCl]
Labelled synaptobrevin with -synuclein titration
at 20 MST Figure 17: Overview of the dissociation coefficients found