University of Warwick institutional repository: http://go.warwick.ac.uk/wrap
This paper is made available online in accordance with
publisher policies. Please scroll down to view the document
itself. Please refer to the repository record for this item and our
policy information available from the repository home page for
further information.
To see the final version of this paper please visit the publisher’s website.
Access to the published version may require a subscription.
Author(s): Daniel Claus, Marco Fritzsche, Daciana Iliescu, Brenda
Timmerman, and Peter Bryanston-Cross
High-resolution digital holography utilized by the subpixel sampling
method
Year of publication: 2011
Link to published article:
http://dx.doi.org/10.1364/AO.50.004711
Publisher statement: Claus, D., Fritzsche, M., Iliescu, D., Timmerman,
B. and Bryanston-Cross, P. (2011). High-resolution digital holography
utilized by the subpixel sampling method. Applied Optics, 50(24), pp.
4711-4719. © 2011 The Optical Society. This paper was published in
Applied Optics and is made available as an electronic reprint with the
permission of OSA. The paper can be found at the following URL on
the OSA website: http://dx.doi.org/10.1364/AO.50.004711. Systematic
or multiple reproduction or distribution to multiple locations via
High-resolution digital holography utilized
by the subpixel sampling method
Daniel Claus,
1,* Marco Fritzsche,
2Daciana Iliescu,
3Brenda Timmerman,
3and Peter Bryanston-Cross
3 1Kroto Research Institute, University of Sheffield, S3 7HQ Sheffield, UK
2Visiting Student, Mechanical Engineering Department, Technische Universität Ilmenau, 98693, Germany 3School of Engineering, University of Warwick, CV4 7AL, Coventry, UK
*Corresponding author: [email protected]
Received 11 February 2011; revised 29 June 2011; accepted 30 June 2011; posted 5 July 2011 (Doc. ID 142484); published 10 August 2011
A novel (to our knowledge) approach for resolution improvement in digital holography is presented in this paper. The proposed method is based on recording the incoming interference field on a complementary metal-oxide semiconductor (CMOS) camera with subpixel resolution. The method takes advantage of the small pixel size of the CMOS sensor, while overcoming the reduced fill factor. This paper describes the experimental and numerical procedures. The improvement of the obtainable optical resolution, image quality, and phase measurement accuracy are demonstrated within this paper. © 2011 Optical Society of America
OCIS codes: 090.1995, 090.2880, 100.2980, 110.0180, 110.1650, 110.6150.
1. Introduction
In optical holography, the interference pattern, which results from the superposition of reference and object wave, is stored on a photographic plate. For most applications, photographic plates have been replaced by digital storage using charged coupled device (CCD) or complementary metal-oxide semi-conductor (CMOS) sensors. The advantages of re-cording holograms in a digital format are faster image acquisition and simplified image processing. However, the typical resolution of CCD and CMOS sensors (200lp=mm) is small compared to the typical resolution of holographic plates (3000lp=mm). This restricts the maximum interference angle between reference and object wave. Consequently, a rather large distance between object and camera needs to be kept for the recording in order not to undersample the interference pattern. Because of the long record-ing distance, the optical resolution of the numerically
reconstructed hologram is smaller than the resolu-tion obtained with optical holography. The optical re-solution can be calculated using Abbe’s criterion, which is represented in Eq. (1). Moreover, inherent in a long recording distance is the appearance of lar-ger speckles; see Eq. (2) adapted from [1], which re-sults in a reduced image quality of the reconstructed hologram. To simplify the equations without loss of generality only the xcomponent is considered here and hereafter.
δx¼ λd
NxΔx0;
ð1Þ
D00x speckle¼
2:44λd NxΔx0;
ð2Þ
whereD00x speckleis the speckle size in thex00direction
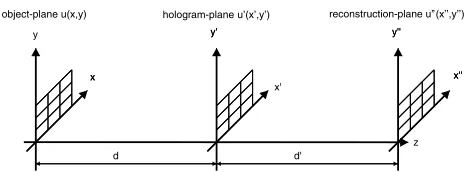
in the reconstruction plane (see Fig.1for nomencla-ture of planes), λ is the wavelength, N is the pixel number,Δx0 is the pixel size in the hologram plane, andd is the recording distance, which is a function of the pixel size. Taking into account the Nyquist 0003-6935/11/244711-09$15.00/0
criterion, the smallest recording distance for a Fresnel hologram [2] is
dmin¼
ð2xþNΔx0ÞΔx0
λ
in-line: x¼X=2 off -axis: x¼1:5·X;
ð3Þ
and for a Fourier hologram [3] is
dmin¼
2xΔx0
λ
in-line: x¼X=2
off -axis: x¼1:5·X; ð4Þ
where X is the size of the object.
A commonly applied resolution improvement tech-nique in digital holography is based on the synthetic aperture method, as presented in [4–7]. This method is based on either shifting a single sensor laterally by an amount equal to or slightly smaller than the sen-sor size (see [4,5,7]) or using laterally distributed multiple sensors (see [6]). Another way to implement the synthetic aperture method is based on tilted ob-ject illumination, in which the obob-ject is illuminated at different angles as discussed in [8]. All these im-plementations of the synthetic aperture method result in an increased numerical aperture, which results, as shown in Eq. (1), in an increased optical resolution.
Another way to improve the resolution is to sample the incident wave field with subpixel resolution, by which the effective sampling pixel size can be re-duced. This allows the reduction of the recording dis-tance, which results in an improvement of the optical resolution. Three different subpixel sampling resolu-tion improvement methods have been reported in [9]. The three methods are based on laterally shifting the sensor by an amount smaller than the pixel size. The methods described by [9] were carried out with a CCD sensor of almost 100% fill factor. The subpixel sampling method described in this paper is based on CMOS technology. CMOS sensors have a smaller fill factor than CCD sensors. This results in a more reli-able integrated irradiance when sampling the incom-ing wave field with subpixel resolution. Moreover, CMOS technology is cheaper than CCD technology, and it is available at smaller pixel sizes, which allow for a further resolution improvement. To the authors’ knowledge, the smallest available pixel sizes for CMOS and CCD sensors are1:4μm (MT9E013, Ap-tina, USA) and3:5μm (ICX625, Sony, Japan),
respec-tively. By comparison with CCD, one major drawback of CMOS sensors is their more noisy readout. The noisy readout can be reduced by hot-pixel elimina-tion and dark-field calibraelimina-tion prior to the mea-surement. The dark-field data correspond to data recorded while no light enters the camera. The term hot pixel corresponds to a pixel that is continuously saturated independent of the magnitude of exposure applied. A minimization of both effects can be ac-complished by recording an image with the laser switched off and the camera set at its experimental exposure parameters. The recorded image, which accommodates the dark field and hot pixels, needs to be subtracted from the recorded hologram.
2. Setup and Methodology
The experiment was performed using the setup sche-matically shown in Fig. 2. A He–Ne laser with a wavelength of632:8nm was used in the experiments. Before recording the hologram, the object was posi-tioned at the minimum distance for the recording of Fresnel holograms, shown in Eq. (3). In order to obtain a good fringe contrast, the optical path length and polarization state [10] of reference and object wave have been matched. The hologram was then re-corded on a 6.6 megapixel CMOS camera (C-Cam, BCi4-6600) with3:5μm pixel size and 35% fill factor. In order to increase the resolution of the numerically reconstructed hologram, the camera was moved clo-ser to the object. At this distance, the recorded inter-ference pattern is undersampled. The camera sensor was then moved with a backlash-free motorized PI M150.11x–ystage with a linear resolution of8:5nm in thex0andy0directions by half the pixel size to four different positions, termed positionsA, B,C, andD and shown in Fig.3. After recording first in position A, the camera was horizontally shifted by half the pixel size to positionB. FromB, the camera was ver-tically shifted by half the pixel size toC. FromC, the camera was horizontally shifted but in the opposite direction with respect to theA–Bmovement to arrive at D. Finally, from D the camera was vertically shifted back to its initial position. The holograms obtained at the four recording positions have then been combined into a hologramH. A simplified com-bination procedure for a2×2pixel array is shown in
x y' y'' x'' x y' x' object-plane u(x,y) hologram-plane u’(x’,y’)
[image:3.594.52.287.33.119.2]d y'' x'' z d' reconstruction-plane u’’(x’’,y’’) y
Fig. 1. Nomenclature for coordinates in object plane, hologram plane, and reconstruction plane.
Fig.4. In this manner, one original pixel was replaced by four subpixels of half the pixel size. The combina-tion procedure can mathematically be described as follows:
Hð2x0−1;2y0−1Þ ¼Aðx0;y0Þ; Hð2x0−1;2y0Þ ¼Bðx0;y0Þ; Hð2x0;2y0Þ ¼Cðx0;y0Þ;
Hð2x0;2y0−1Þ ¼Dðx0;y0Þ: ð5Þ
The recording mechanism on the digital target can be simulated by multiplying the continuously defined incoming wave-field intensity u0ðx0Þ with a comb function, [see Eq. (6)]. The continuous values u0ðx0Þ are transformed into discrete valuesu0dðx0Þseparated by the pixel size (see Fig.5),
u0dðx0Þ ¼u0ðx0Þcomb
x0
Δx0
: ð6Þ
The obtained result is convolved with a rect function of width Δx0 representing the impulse-response of the digital receiver (rectangular pixel area), which is represented in Eq. (7),
u0pixelðx0Þ ¼u0dðx0Þ⊗rect
x0
Δx0
¼F−1½Ffu0
dðx0;y0Þg· sincðνx0Δx0Þ; ð7Þ
whereνx0is the spatial frequency in thex0direction in
the hologram plane. The pixel modulation transfer function (MTF) is the absolute value of the transfer function, which is obtained by applying a Fourier transform to the rect function as discussed in [11],
MTFpixel¼ jsincðνx0Δx0Þj: ð8Þ
The pixel MTF contributes to the overall MTF of the optoelectrical system in a multiplicative manner. The benefits of using the subpixel sampling method in the recording process are
i. Reduced camera–object distance, by which a more detailed reconstruction is enabled and speckle-noise is reduced.
ii. Reduced camera–object distance, by which more object reflected and diffracted light is recorded. Hence electronic noise in the recording process is reduced.
iii. Higher cutoff frequency than when recording with the sensor-specified pixel size; see Fig.6.
iv. Higher contrast recording of spatial frequen-cies (0<νx0 <νsub-pixel); see Fig.6.
[image:4.594.52.289.36.214.2]v. Fill factor maximized to 100%. Fig. 3. Schematic diagram of the relative pixel positions for
subpixel resolution sampling.
[image:4.594.331.524.42.114.2]Fig. 4. (Color online) Combination procedure to obtain a subpixel hologram.
Fig. 5. Simulation of the digital recording mechanism.
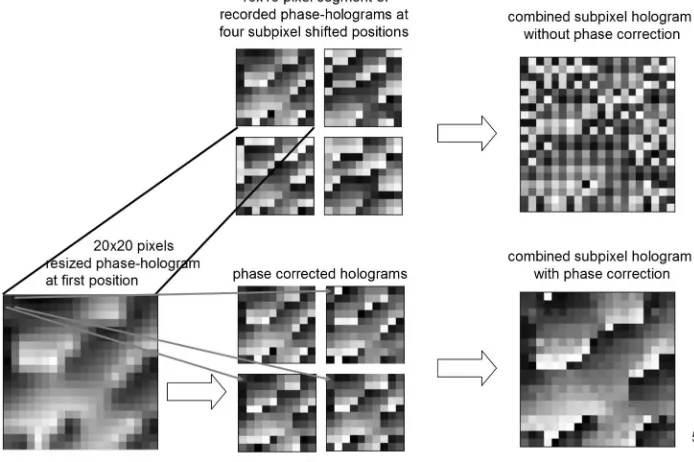
When performing the experiment, it was realized that, due to environmental perturbations, the interference fringes shifted randomly in the x0 and y0directions. Phase stepping was introduced to mini-mize the influence of the environment on the mea-surement. The introduction of phase stepping results in an averaged fringe position. In addition, it enables the application of an in-line setup, which allows a further reduction of object–camera distance [Eqs. (3) and (4)] and consequently results in an increased op-tical resolution [Eq. (1)] and reduced speckle noise [Eq. (2)]. The analysis of the phase-stepped intensity holograms was based on a three-bucket phase-stepping algorithm developed by [12]. This algorithm calculates each individual phase step; hence it does not require environmental stability. At each of the four recording positions (see Fig. 3), three phase-stepped holograms were recorded. The phase step was implemented by a piezo-mounted mirror in the reference arm. After applying the phase-stepping al-gorithm, a phase map at each recording position is obtained. The four phase maps, one from each record-ing position, are then combined into a common phase map applying the combination procedure previously discussed [see Eq. (5)]. The initial phase among the four phase maps might differ. This would result in sudden phase jumps between adjacent pixels in the combined phase map as shown in Fig.7(b). In this case, the combined phase map acts like a phase bin-ary grating, which, when reconstructed, results in additional diffraction orders. These additional dif-fraction orders cause a splitting of the object informa-tion [see Fig. 7(b)], which results in a less detailed reconstruction. This problem can be overcome in two different ways. First, the different diffraction or-ders can be superimposed using cross correlation, and second, by phase adjustment of each individual phase map. The phase adjustment is performed by resizing a part (200×200 pixels) of the first phase hologramAto twice its size. The interpolated phase value of the resized hologramA0serves as a reference phase for the other three phase mapsB,C, andD. For instance, in order to find the phase difference forB with respect toA, a new matrixB0is generated. The finding ofB0can be considered to be the reversed pro-cess of the combination propro-cess represented in Eq. (5). MatrixB0 can hence be calculated as
B0ðx0;y0Þ ¼A0ð2x0−1;2y0Þ: ð9Þ
The phase differenceΔφBis then calculated by aver-aging the difference between the initial matrix and the new matrix:
ΔφB¼ 1
NM
XN
x0¼1 XM
y0¼1
ðBðx0;y0Þ−B0ðx0;y0ÞÞ: ð10Þ
The resulting phase difference ΔφB is then sub-tracted fromBin order to obtain the corrected phase difference map. In the same manner, the phase dif-ference forC andDis determined and corrected. A
schematic diagram of the phase-correction approach is shown in Fig.8.
The final combined phase map possesses a smooth phase transition, which results in a reduced appear-ance of higher diffraction orders in the reconstruc-tion process; see Fig.7(c).
The reconstructed hologram was obtained using the Fresnel propagation method described mathema-tically in Eq. (11),
uðx00;y00Þ ¼iexpðikd 0Þ
λd0 exp
iπ
λd0ðx
002−y002Þ
·F
uðx0;y0Þrefðx0;y0Þ
× exp
iπ
λd0ðx 02þy02Þ
; ð11Þ
where refis the complex conjugated reference wave. For comparison of the subpixel sampling method with the normal recording process, holograms recorded from a cantilever as the object under inves-tigation [see Fig. 9(a)] have been recorded at two camera–object distances, namely 191mm and 300mm. For the first distance, using the3:5μm pixel size consequently violates the Nyquist criterion. Aliasing occurs, which results in the appearance of ghost images in the reconstructed hologram; see Fig.7(a), left side. These artifacts can be avoided using the subpixel sampling method, which is consequently employed at this distance. For the second distance, at the same pixel size the recorded hologram is not un-dersampled, therefore the standard process does not result in the appearance of ghost images. To illus-trate the results obtained from both processes, a small region of interest of the object shown in Fig.9(a)is se-lected for the intensity reconstructions shown in Figs.9(b)and9(c).
In order to evaluate the image quality of the recon-structions, the signal-to-noise ratio (SNR) was applied. The SNR can be calculated as
SNR¼20log
X
σ
; ð12Þ
where X is the mean value of a population and σ the standard deviation. Assuming that the noise is evenly distributed over the entire reconstructed holo-gram, only a small representative region of interest with ideally constant gray level needs to be considered for the calculation of the SNR. Gray level changes in that region should then solely be due to noise. The SNR values for the reconstructions are25:18dB when applying the subpixel sampling method as shown in Fig.9(b)and22:71dB using the camera specified pixel size; reconstruction is shown in Fig.9(c).
2mm in order to produce a high density of fringes in the double-exposure phase map. Because of the high density of fringes, only small regions of the double-exposure phase maps are shown in Fig.10. The 2π discontinuity map can be resolved to a greater degree when employing the subpixel sampling
[image:6.594.125.474.36.601.2]phase reconstruction than the previously used SNR for the intensity reconstruction. Taking into account the setup geometry, the corresponding deformation measurement uncertainties are 6:λ88 for 3:5μm and
λ
7:05 for 1:75μm, respectively. Thus the
double-exposure phase map obtained with the subpixel sampling method can resolve to a higher degree of accuracy.
3. USAF-1951 Test Target
In order to determine the resolution improvement when applying the subpixel sampling method, the USAF 1951 test target was used as the object of study. The setup used originally was changed to a transmission setup by replacing the object with a
mirror. Moreover, the plane reference wave was re-placed by a spherical wave, as shown in Fig.11. This enabled the recording of Fourier holograms, by which the sensor’s space–bandwidth product (SBP) is used more efficiently.
[image:7.594.122.469.42.273.2]The transparent USAF-1951 test target was placed between mirror M4 and the beam splitter. An intensity hologram was then recorded without ap-plying the subpixel method at a recording distance of 295mm. Zero-padding, as discussed in [1], was ap-plied to generate a hologram of equal dimensions in the x and y directions. In this manner, the recon-structed hologram does not suffer from different pixel sizesΔx00and Δy00 in the reconstruction plane [Eq. (13)], which otherwise would result in a Fig. 8. Schematic diagram of the phase-correction procedure.
[image:7.594.56.537.490.681.2]distorted (stretched) reconstruction and might pro-duce different horizontal and vertical resolution and depth of field:
Δx00¼ λd 0
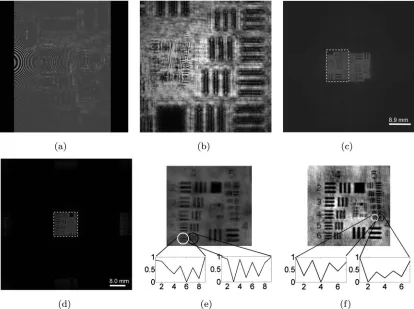
NΔx0: ð13Þ Afterwards the recording distance was reduced to 185mm, at which the subpixel sampling method was applied. The recorded intensity hologram at a 295mm recording distance, the modulus of the com-plex object wave for the subpixel sampled hologram, and their corresponding numerical reconstructions are shown in Fig.12. In order to observe the smallest resolvable test-target element, a small region has been selected, shown in Figs.12(e)and12(f). Rather than only taking a single cross section for a consid-ered test-target element into account, the optical resolution was determined by averaging all cross sec-tions across the test-target element under investiga-tion. This enabled a more accurate determination of the optical resolution obtained. The averaged cross sections are shown in Figs. 12(e) and 12(f), where the xaxis denotes the pixel number and the yaxis the normalized intensity. Care was taken so that the three local minima (black strips) are visible and the
ratio of the largest local minima to the smallest local maxima is less than 0.81 according to the resolution criterion. The black ring in Fig. 12 encircles the horizontal resolution and the white ring the vertical resolution.
In order to have a more complete evaluation of the optical system’s information capacity, the SBP was calculated. The SBP represents the product of the field of view and the highest resolvable spatial fre-quency. The SBP is a more meaningful parameter for the judgment of optical systems, since it is inde-pendent from the recording distance and permits the comparison of different optical systems. The opti-mum SBP is obtained when recording an in-line Fourier hologram,
SBPin-line¼N·M; ð14Þ
[image:8.594.85.515.37.160.2]whereN andM are the pixel numbers for both lat-eral sensor dimensions. For an off-axis Fourier holo-gram, the SBPoff -axis is a quarter of the SBPin-line, as discussed in [13]. In order to measure the setup performance with respect to its optimum SBP, an efficiency parameter,η, is introduced:
Fig. 10. Segment of double-exposure phase maps for191mm recording distance (a) normal hologram with3:5μm pixel size, (b) subpixel sampled hologram with1:75μm pixel size.
[image:8.594.138.469.510.700.2]η¼ SBP SBPin-line:
ð15Þ
In this manner, different optical setups can be compared. The theoretically possible resolution ac-cording to Eq. (1), the achieved resolution, the SBP, andηfor both hologram are shown in Figs.12(a)and
12(b), and the results from two recent papers [7,14]
are shown in Table1. The field of view was obtained by multiplication of the pixel size in the reconstruc-tion plane with the number of pixels displaying the reconstructed image [highlighted by a dashed white line in Figs. 12(c) and 12(d)]. The results obtained could be confirmed by comparison with the real phys-ical USAF test target.
In conclusion, it was found that the result obtained for the maximum resolution matches well with the
expected value. Furthermore, the SBP and the η obtained can compete with the results published in recent papers [7,14]. A larger field of view was ex-pected, which would have led to a larger SBP and
[image:9.594.92.506.37.346.2]η. Only a small part of the reconstructed hologram displays the image, shown in Fig.12(d). The reduced field of view is due to the use of a transparent object. Diffraction only occurs at the edges of the target bar elements. The major part of the recorded light is un-diffracted. A collimated laser beam was used to illu-minate the USAF test target. Thus the size of the undiffracted recorded light corresponds to the projec-tion of the sensor onto the object. In that manner, diffracted light that originates from object points outside the projected sensor area is recorded with almost no background intensity. This results in a reduction of visibility for the corresponding object Fig. 12. (a) Recorded intensity hologram3000×3000pixels, (b) modulus of calculated complex object wave6000×6000pixels, numerical reconstructions with field of view indicated by dashed line (c) without subpixel sampling method, (d) with subpixel sampling method, and (e), (f) corresponding areas of interest to determine smallest resolvable element.
Table 1. Theoretical and Practically Achieved Resolution
Reconstruction
3000×3000at
295mm
6000×6000at
185mm
5000×5000
from Ref. [14]
8000×8000
from Ref. [7]
Maximum theoretical resolution (μm) 17.8 @632nm 11.2 @632nm — 6.7 @632nm Achieved vertical resolution (μm) 17.5 8.7 2.6 6.2 Achieved horizontal resolution (μm) 17.5 8.7 2.6 7.8 Field of view (mm2) 9:0×12:1 11:7×11:7 4×4 30×23
SBP (106) 0.36 1.79 2.37 14.27
[image:9.594.51.547.621.714.2]region. Using a diffuse reflective test target would result in a homogeneous object information distribu-tion across the recorded hologram, and should there-fore yield a larger field of view for the reconstructed hologram.
4. Conclusion and Discussion
A novel (to our knowledge) approach to improve the optical resolution of digital holograms based on sub-pixel sampling of the incident interference pattern in conjunction with the application of CMOS technology and phase stepping was presented in this paper. The low fill factor inherent in CMOS technology could be maximized to 100%. The successful implementation of the subpixel method was shown for an intensity-reconstructed hologram and double-exposure holo-gram of a cantilever. The image quality improvement for these reconstructions was demonstrated by calcu-lating the SNR. Holograms with normal pixel size and with the subpixel sampling method were recorded and reconstructed to prove the resolution improvement. A resolution improvement and an in-crease of the SBP could be demonstrated.
The system as it stands at the moment is limited to static measurements due to shifting the camera to four positions at each of which phase stepping is applied. Potentially, real time measurement can be carried out by minimizing the environmental pertur-bations. This would result in a good laterally loca-lized incoming wave field with respect to the pixel size employed. Rather than recording 12 holograms, only four holograms, one for each shifting position, need to be recorded, which would significantly speed up the acquisition time. The reduction of environ-mental perturbations can be accomplished by the application of, for example, common path interfero-metry or shearing interferointerfero-metry. The shift to the four recording positions and the camera frame rate need to be aligned. Moreover, both camera frame rate and shift speed need to be large enough to avoid speckle decorrelation caused by the object move-ment. Speckle decorrelation needs to be less than half the speckle size, according to [1], while recording the four laterally subpixel-shifted holograms. Thus the frame rate and translation stage shifting velocity required is determined by the frequency of the dy-namic event.
In case the environmental perturbations are still very strong, the subpixel sampling method as de-scribed in the main body of the paper may need to be applied. The investigation of dynamic events would be limited; however, they would still be feasi-ble for dynamic events of small temporal frequency. Another possible application of the subpixel sam-pling method is for digital holographic microscopy.
The usage of a high NA system of relatively small magnification would be enabled, such as a Nikon CFI Apo LWD 25XW (25×, NA¼1:1), Nikon Corp., Japan. The application of such a microscope objective would result in an increased FOV and hence an in-creased SBP.
The applications and improvements discussed above could be the basis of future work for this method.
This project was supported by the Innovative Manufacturing Research Centre, project R.ESCM 9231. We would like to express our gratitude to Prof. Derek Chetwynd, who generously allowed us to use some of his equipment. Last, but not least, we would like to thank the School of Engineering technicians for manufacturing the devices needed in the scope of these experiments.
References and Notes
1. T. Kreis,Handbook of Holographic Interferometry: Optical and Digital Methods(Wiley-VCH, 2005).
2. Interference of object wave with a plane reference wave. 3. Interference of object wave with a spherical reference wave
that originates from the object plane.
4. F. Le Clerc and M. Gross,“Synthetic-aperture experiment in the visible with on-axis digital heterodyne holography,”Opt. Lett.26, 1550–1552 (2001).
5. J. H. Massig, “Digital off-axis holography with a synthetic aperture,”Opt. Lett.27, 2179–2181 (2002).
6. T. Kreis and K. Schlüter,“Resolution enhancement by aper-ture synthesis in digital holography,”Opt. Eng.46, 055803 (2007).
7. D. Claus,“High-resolution digital holographic synthetic aper-ture applied to deformation measurement and extended depth of field method,”Appl. Opt.49, 3187–3198 (2010).
8. L. Granero, V. Micó, Z. Zalevsky, and J. Garcia, “Synthetic aperture super-resolved microscopy in digital lensless Fourier holography by time and angular multiplexing of the object in-formation,”Appl. Opt.49, 845–857 (2010).
9. J. Kornis and B. Gombköto, “Application of super image methods in digital holography,” Proc. SPIE 5856, 245–253 (2005).
10. Obtained by rotation of two quarter-wave plates in the refer-ence arm.
11. G. D. Boreman,Modulation Transfer Function in Optical and Electro-Optical Systems(SPIE Press, 2001), Vol. TT52. 12. L. Z. Cai, Q. Liu, and X. L. Yang,“Generalized phase-shifting
interferometry with arbitrary unknown phase steps for dif-fraction objects,”Opt. Lett.29, 183–185 (2004).
13. A. W. Lohmann and S. Sinzinger, Optical Information Processing(Universitätsverlag Ilmenau, 2006).
14. J. Di, J. Zhao, H. Jiang, P. Zhang, Q. Fan, and W. Sun,