Filtering social media data streams
By Tjalling Tolle
ABSTRACT
ACKNOWLEDGEMENT
Robin Aly
Richard Bults
TABLE OF CONTENTS
Abstract ... 2
Acknowledgement ... 3
1. Introduction ... 6
1.1. Scenario ... 6
1.2. Problem statement ... 6
1.3. Research questions... 7
1.4. Approach ... 7
1.5. Structure ... 8
2. Background ... 9
2.1. Twitter data streams ... 9
2.2. Apache Storm ... 9
2.3. Information overload ... 10
2.4. Data stream management ... 10
3. Literature research ... 12
3.1. Data stream administration research ... 12
3.2. Twitter data stream research ... 13
3.3. Engaging data stream presentations ... 14
4. Ideation and specification ... 15
4.1. User needs analysis ... 15
4.1.1. Administrator needs analysis ... 15
4.1.2. Public needs analysis ... 17
4.2. User scenarios ... 18
4.3. Market analysis... 18
4.4. Functional specification ... 19
4.4.1. General ... 19
4.4.2. Suggestions ... 19
4.4.3. Insight into removed data ... 19
4.4.4. Separation ... 20
5. Realization ... 21
5.1. Setup ... 21
5.2. Filtering and insight into removed data ... 22
5.3. Suggestions ... 23
5.4. Separation ... 23
6. Evaluation ... 24
6.2. Assessment method ... 24
6.3. Results ... 24
7. Conclusion and Discussion ... 26
7.1. Engaging ways to present social media data streams ... 26
7.2. Preventing information overload when assisting in defining filters ... 26
7.3. Necessary information to define filters for data streams ... 26
7.4. How to assist in defining effective filters for data streams ... 27
7.5. Future work ... 27
Appendix 1: Questionnaire ... 29
Appendix 2: Questionnaire Answers ... 37
Appendix 3: Interview 1 transcription ... 42
Appendix 4: Interview 2 transcription ... 45
Appendix 5: Interview 3 transcription ... 47
Appendix 6: Prototype code ... 50
1. INTRODUCTION
This paper investigates filters for big data streams. Data streams are continuous flows of information. In this chapter the rationale behind this paper will be established. First the current state of the art will be discussed and the terminology in this paper will be introduced. Next the problems with the current state of the art will be highlighted from which follow a set of research questions. Lastly an outline of how this paper will attempt to answer those research questions and an overview of the basic structure of this paper will be given.
1.1. Scenario
In current day society data streams play an important role. Individuals increasingly desire to interact with data streams on a day to day basis. This desire can be established from the massive growth and popularity of various social media networks which are in essence various data streams that people desire to interact with. To illustrate the scale of this phenomenon: Facebooks data stream attracts 1.65 billion monthly active users (Facebook, 2016). In other words, approximately 1 in 7 persons worldwide use Facebook at least once a month. Twitter manages to attract 310 million monthly active users (Twitter, 2016). These data streams already contain a considerable amount of data and only continue to grow as social media platforms continue to expand.
Organizations and events use social media data streams to increase engagement in public
environments using social media displays. These displays collect and show a curated dataset of the most popular or relevant posts on various social media platforms. Users can interact with the display by posting on social media using a predefined keyword that is usually shown on the display. This social media data is largely unstructured and can vary widely in tone and topic. Interpreting
unstructured data is difficult especially when containing abbreviations and/or slang. On Twitter users can add a so called hash-tag which is used to specify the topic of a tweet but this hash-tag is optional and not all hash-tags are actually used to specify the topic of the tweet.
Applications for managing social media displays such as described above usually hand most of this data collection and filtering over to the social media platforms by depending on their API’s which return a set of popular and recent posts matching certain criteria. Then administrators for such applications can usually only control the styling of the public display.
1.2. Problem statement
As explained existing applications that allow users to manage social media displays rely on the social media platform to collect and filter most of the data. This means that an administrator has much less insight in the data and in effect also much less control over that data. This issue can be solved by using data streams, which are continuous streams of data. Most social media platforms give developer access to a data stream of the posts on their platform. This allows the application to give the administrator much more control over the data that is being collected. However implementing data stream filtering and giving an administrator transparent, interactive control over said data stream is difficult several reasons such as:
The data changes over time and is unstructured. Since most social media data is users generated it is generally unstructured and can concern any topic that is of interest to the person posting it.
a single query might not be able to collect all relevant data over a period of time because over time keywords for topics of interest might change.
The amount of data makes it is difficult for users to get an accurate overview of all the data collected and filtered from the data stream. In many existing applications the only way a user can get an impression of the data that is being collected is by viewing the public screen. What data was collected, which was filtered out and why is hidden from the user. Because the user is lacking all of this information it becomes difficult for them to make accurate assumptions on how to modify query and filter values of the public display. The amount of data also makes manual moderation of a public display intensive and impractical.
1.3. Research questions
This project explores solutions to the above problems by designing an administrative interface which focuses on giving the administrative user an overview of the collected data, showing them the results of certain filter settings and assisting them in modifying current settings to improve the relevance of the collected data. Therefore the main research questions that this project attempts to answer is:
How can administrators be assisted in defining effective filters for social media data streams?
In order to make it easier to answer this research question it is split up in several sub questions that each concern on aspect of the main question. This way answering the sub questions will lead to an answer to the main research question. These sub questions are:
1. What information do administrators use to define filters for data streams? 2. How to prevent information overload when assisting in defining filters? 3. What are engaging ways to present social media data streams?
1.4. Approach
In order to limit the scope of this research and to be able to produce a functional prototype on time it is decided that the prototype will stream Twitter data only. Secondly the prototype will focus on data stream filtering, literature, market and user research will be done on the topic of publicly displaying social media data in order to be able to fully understand what features are important to the administrator and how the manner in which the data is presented affects the way it will be filtered. The public display will not be evaluated separately as will not be necessary in order to answer the research questions posed by this paper.
To answer the research questions first a literature research will be performed, the goal of this literature research is to uncover the state of the art and find elements and theories that can be used to answer the research questions.
Next there will be the ideation and specification phases. The ideation phase consists of a brainstorm, using divergence and convergence techniques, exploring creative ideas for the envisioned product. The result of the Ideation phase is one or more concepts for the envisioned project. During the specification phase the concepts from the ideation phase will rapidly be prototyped while also defining and refining the user requirements. The results of the specification phase are a narrative user scenario and functional specification of the early prototype of the envisioned product.
prototype from the realization phase, testing whether the prototype did indeed match the specification.
1.5. Structure
2. BACKGROUND
In this chapter the background that this paper builds on will be shortly presented and discussed. The background consists of prior knowledge and techniques that are fundamental to understanding the problems and solutions discussed in this paper.
2.1. Twitter data streams
As mentioned before this paper deals with data streams, however to limit the scope of this paper it will primarily deal with Twitter data streams. Twitter offers developers easy access to their data streams through their “Twitter Streaming API”.
As part of their streaming API Twitter offers two interfaces for data collection; the “filter” and “firehose” API’s. The filter API is offered to developers for free but has the limitation that it will only give access to 1% of the amount of data that is produced at any given time. The filter option allows the developer to pass along some filters like keywords, users and locations that the developer wants to receive tweets from. If the amount of data that is collected by a certain set of filters becomes larger than 1% of all the data at that moment Twitter will sample the data to return 1% of the total amount of data (Morstatter, Pfeffer, et al., 2013).
The firehose API allows a developer to overcome the 1% limitation that constrains the filter API. It is a feed provided by Twitter that gives a developer access to 100% of all public tweets. However unlike the filter API, the firehose API is not offered for free. Another downside of this API is that it requires a large amount of resources to be able to collect and process all data in an appropriate amount of time (Morstatter, Pfeffer, et al., 2013).
For this project using the firehose API would allow for more data to be collected and more specific querying and filtering to be used on the collected data. However the filter API will perform accurate enough sampling and filtering for the purpose of this project (Morstatter, Pfeffer, et al., 2013).
2.2. Apache Storm
Big data stream processing usually requires a large amount of resources. This means that it is
important to allow data stream processing applications to scale resources efficiently with the amount of data that it is processing. In order to achieve this many modern stream processing applications are built on top of frameworks that simplify resource management. One of such frameworks is Storm. Storm was originally developed by Twitter to perform their in-house data processing but was later open-sourced and handed over to The Apache Software Foundation.
The basic concepts that form the foundation to Storm are explained in “Storm@ twitter” as follows:
“Storm is a real-time distributed stream data processing engine at Twitter that powers the real-time stream data management tasks that are crucial to provide Twitter services. Storm is designed to be: [scalable, resilient, extensible, efficient and easy to administer].” (Toshniwal, et al., 2014).
“The basic Storm data processing architecture consists of streams of tuples flowing through
For this project Storm will be used as a framework to simplify processing of data streams.
2.3. Information overload
One of the problems with data streams that was already touched on earlier is the sheer amount of data, it is simply too much information to be digested by a user. When a user is exposed to this amount of data they would quickly experience information overload. In order to design an application that prevents users from suffering from information overload first it is necessary to properly define it.
In the paper “information overload: a temporal approach” (Schick, et al., 1990) the problem of information overload is discussed. The paper provides a more precise definition of information overload than previously established. This definition can be used to design more usable information systems. The paper explains the problem of information overload as follows: “Organizations and their members are affected by the ever increasing quantities and varieties of information (data) they are required to process. Organizations and their members, however, have limited information processing capacities. The combination of more information and limited information processing capacities has led to the phenomenon called information overload.” (Schick, et al., 1990).
In order to arrive at their conclusion Schick et al. conduct an extensive literature review. In the conclusion of the paper explain their definition of information overload: “Drawing upon the information processing approach to organization design, the concept of time was applied to an analysis of information overload. Time was conceptualized as a measure of information processing capacity (IPC) and as a measure of the interaction and internal calculation demands on that capacity (IL). This made it possible to define information overload in terms of the relation between the demands on, and supply of, time and measure it conceptually for any entity (i.e. individual, group, organization), regardless of the causes or circumstances of its occurrence. Information overload occurs when the demands on an entity for information processing time exceed its supply of time (i.e. IL > IPC).” (Schick, et al., 1990).
2.4. Data stream management
In the paper “Aurora: a data stream management system” (Abadi, et al., 2003) the difference in requirements for a database management system (DBMS) and a data stream management system for monitoring applications are described as follows:
Traditional DBMS
Data stream management system
Assumes a passive model where most data processing results from humans issuing transactions and queries.
More active approach, monitoring data feeds from unpredictable external sources (such as sensors) and alerting humans when abnormal activity is detected.
Manages data that is currently in its tables. Often requires processing data that is bounded by some finite window of values, and not over an unbounded past.
Provides exact answers to exact queries, and is blind to real-time deadlines.
Optimizes all queries in the same way (typically focusing on response time).
Manager benefits from application specific optimization criteria.
Assumes pull-based queries to be the norm. Push-based data processing is the norm.
3. LITERATURE RESEARCH
In this chapter the related work from which this paper and project borrow concepts will be shortly presented and discussed. The related work consists of academic papers that expand on the concepts related to the research questions of this paper.
3.1. Data stream administration research
As discussed in the background section, applications that deal with data streams have different requirements than applications that deal with data stored in a database. In order to optimize the usability of a data streaming application it is necessary to design the application in such a way that it assist the user as much as possible with the data streams. This assistance exhibits itself in several ways; the application must help the user understand the data while preventing the user from getting overloaded by the frequency of information and the application must be transparent to the user in how their actions manipulate the data stream.
Research on designing interfaces with the goal of preventing information overload is surprisingly limited. In the previous chapter the definition of information was established as “when the demands on an entity for information processing time exceed its supply of time” (Schick, et al., 1990). From this definition it is clear that in order to prevent information overload it is necessary to limit the amount of information the user is exposed to (Schick, et al., 1990). One way to limit the amount of information that is exposed to the user is by sampling the data stream. However in order for the application to remain usable and transparent to the user it is important to ensure that this sampled set of information is representative of all the data.
In the previous chapter the paper “Aurora: a data stream management system” (Abadi, et al., 2003) was mentioned. This paper proposes a new data stream management system called Aurora that aims to solve these problems. In order to achieve this Abadi, et al. designed a system that consists of a development GUI application, a server that streams the data and a performance monitor GUI application. Together this system allows users to manage their data streams by developing a so called flow network that defines what Aurora should do with their data. Users can then monitor their application and modify it at any time. One of Aurora’s novel features is their stream-oriented query operators that can be chained together using their development GUI application. Although this way of defining the flow of an application is intuitive it also requires a certain amount of data base management expertise to be able to combine them into a functional flow. Additional processing steps that a data stream operator would like to perform need to be scripted as separate applications that process Aurora’s output. Another novel feature is Aurora’s load shedding which improves the Quality of Service under heavy load by discarding a fraction of the data from the data stream. A user can set the Quality of Service specification to control how and when load shedding occurs. Although Aurora itself is too technical this project can benefit from its concepts. This project will use Aurora’s idea of dividing stream operators into boxes with settings and giving the user the ability to combine these boxes to manage the stream.
3.2. Twitter data stream research
In order to further assist users with managing a data streaming application it is possible to aid them with making decisions. This aid comes in the form of information and suggestions presented by the application. The information and suggestions are based on data collection and analysis that the application can performs continuously. By presenting the user with suggestions and information the user still has full control over the actions of the application without having to spend a lot of time deciding what actions to take.
One way in which the application can make a helpful suggestion to the user is by analyzing the appearance of hashtags in the collected data stream and showing the user what hashtags are increasing and declining in popularity. This way users could adapt the data stream by adding or removing hashtags from the data stream filter. TwitterMonitor (Mathioudakis & Koudas, 2010) is an application that performs trend detection. It does this in two steps; it starts by identifying so-called ‘burst-y’ keywords. These are words that appear in tweets at a higher than normal rate for a short period of time. After recognizing these burst-y keywords, it groups them based on their
co-occurrences to form trends that then can be analyzed further. The algorithm that is developed by TwitterMonitor can be used by this project to discover trends in the collected data stream. These trends and related keywords can then be shown to the administrative user so they can decide to add those keywords to the filter settings.
Another problem users might face is finding relevant hashtags that match their interests. In “Hashtag retrieval in a microblogging environment” (Efron, 2010) that problem is addressed. This paper proposes a method of finding hashtags that are related to a certain topic that is provided by the user. In order to achieve this goal a model is trained on a large set of Twitter data through a language modeling based approach. For this project finding the hashtags that belong to a certain topic could be useful; finding hashtags that relate to a certain topic could help administrative users formulate a query that captures data they are interested in. However the approach suggested by Efron (2010) requires a model to be trained on large dataset that can be processed at once. Since this project deals with social media data streams, which are time sensitive, there is no large dataset that can be processed at once and thus the techniques proposed by Efron (2010) will need to be adapted to be used in near real-time. Efron’s (2010) model is also limited to being unable to detect or predict new hashtags after being trained, a stream based approach should constantly update the model in order to stay relevant.
TweetTracker designed by Kumar, et al., (2011) is an application designed to assist humanitarian aid and disaster relief organizations by tracking, analyzing and monitoring tweets. The application displays tweet locations on a map in real-time. It also lists sets of entities (hashtags, @-mentions and links) that can function as filters or allow users to analyze a changes in tweets through hashtags and entities. The concept this project borrows from TweetTracker is the listing of separate categories and allowing users to further analyze trends for these categories in order to assist them with making decisions.
build a context for tweets. This research can be used by this paper to gather named entities to be able to filter tweets more accurately.
3.3. Engaging data stream presentations
This project collects and filters the Twitter data to present it in a public location to a large set of users. This means that the data presentation needs to engage the people around the display in order to not be ignored by the users. This idea is explained by Brignull and Rogers (2003) as follows: “People’s initial understanding of a public display system is based on peripheral awareness, for example fleeting glances from a distance. This means that they will judge the system rapidly on the ‘broad-grained’ details available to them at a distance. These should be designed to show the display and the activities around it in an attractive and easy to ‘pick-up’ way.” This means that a public display should be designed around the fact that it will be embedded in the environment. The display should attract the user’s attention using elements that are large and noticeable, through the use of color or movement. After capturing the user’s attention the display should immediately make its purpose and usage clear. Conveying the purpose and usage of the display to the user can be done simply by displaying a short explanation on the screen.
Another way of engaging users with the public display is by introducing a component of interactivity. In the paper “Should Public Displays be Interactive? Evaluating the Impact of Interactivity on
Audience Engagement” (Veenstra, et al., 2015) public display interactivity is researched using a field study. The aim of this field study was to discover the impact of interactive and non-interactive public displays on passers-by in urban centers. The results of this study revealed that interactivity increased the amount of public engagement with the display. The study shows that an interactive display in a public environment can contribute to the attractiveness and positive experience of said environment by attracting people to the space around the display, which in turn stimulates social interaction. These results also proof the usefulness of interactive displays to those who might want to place one at an event or public space(Veenstra, et al., 2015). The main takeaway of this study in the context of this project is that interactivity is a desirable trait for a public display as it increases engagement with and among the public. However, interactivity can also be detrimental to the user engagement according to Brignull and Rogers (2003) who write that: “The form of interaction needs to be very lightweight and visible from the offset; it should be easy to do and importantly, not embarrassing to recover from mistakes that are made.” Since the primary interactivity of the public display is that users can post a tweet containing a certain keyword the display already fulfils the above
requirements of a relatively lightweight interaction. Special care will need to be given when
designing the display to communicate to users how to interact with the display. Further interactions that the display may contain will also need to keep these guidelines in mind.
The data collected by the application also has to be presented in useful ways, various data
4. IDEATION AND SPECIFICATION
In this section the ideation and specification phases of the project are discussed. The goal of the ideation phase is to define a number of concepts. These concepts are based on the needs of users which are determined through a user needs analysis. The specification further develops these concepts by iteratively creating small prototyping to test them. By creating and improving these rapid prototypes it is possible to refine and prioritize user needs. The result of this is a functional specification of the envisioned product prototype.
4.1. User needs analysis
In order to determine user needs potential users of the product were questioned. The product has two distinct groups of users; users who perform the role of administrator and users who interact with the public screen. Two separate user needs analysis were performed to get an accurate picture of the separate user needs of these two groups.
4.1.1. Administrator needs analysis
For the administrative users a semi structured interview was chosen as the means of collecting user needs. The advantage of using an interview is that it is possible to collect more information on certain topics and ask users for a more detailed explanation of their answers. As the administrative tasks of the system will only be handled by a small amount of users it is a smaller problem that performed interviews only reached a limited number of users.
The semi structured interviews where prepared by collecting a set of open questions that would prompt an in-depth discussion on the topic of that question. Each of the questions that were
prepared related to one aspect of how the administrative user operates the data stream application. Before asking in-depth questions respondents were also asked about their background and
experiences with social media and public displays to be able to contextualize their answers. At the start of the interview the interviewees were also shown an example of a public twitter display and a list of tweets that serve to illustrate that a data stream of tweets requires good filtering before being presented in a public location. The interview was recorded with the consent of the interviewees. Three interviewees were chosen based on the criteria that they were likely to manage a social media displays in the future and had experience managing events. The interview were analyzed by listing the key insights that were gained during the interview, in the form of important or insightful comments made by the interviewees.
The interviewees were asked about what types of filters they would expect from an application that publicly displays social media data. All administrators indicate that they think that there should not be too many filters specific because it would risk alienating users who are used to Twitters
requirements. However the interviewees also said that they desire to filter tweets that are in other languages as it would be difficult for them to figure out if the content of such a tweet is appropriate for their display. Twitter allows users to “like” and “retweet” tweets, these values can be interpreted as a form of popularity of a tweet. Interviewees where therefore asked whether they think tweets should be filtered or sorted on popularity. Two of the interviewees state that they do not think that is a good idea. In their opinion such a filter could be easily manipulated and that it has the potential to bias the display by giving the tweets that are already popular more exposure thereby increasing their popularity. One of the interviewees suggests that a possible solution to manipulation of a popularity filter is to blacklisting users who regularly post tweets that do not belong on the display. One
tweets on the display, when asked whether a filter should also make sure that a single user does not get posted on the display too often the interviewee indicated that this depends entirely on the content of those tweets, and that if they are consistently good and relevant tweets than this would not be a direct problem.
When asked about other potential filters such as a sentiment filter interviewees say that this again depends on the context of the display, at certain events you might want to only show positive tweets on the display. One interviewee sketches an event with a twitter display where attendants can participate in a contest, at the end of the contest a winner is chosen. During such an event maintaining the positive atmosphere is more importantly than to give an accurate overview of all opinions that are posted on twitter so in such a scenario sentiment filtering could benefit the display. However if a twitter display is placed at a debate event where sometimes people can argue
vehemently such a feature might inhibit the discussion.
One promising feature of a data stream filtering application that deals with social media data is the ability to analysis and formulate suggestions, this concept was presented to the interviewees as the application suggesting new hashtags that they could choose to track. When asked if such a feature would make it easier to manage such a system over a longer period of time the interviewees answer that they think this is the case. However one of the interviewees does say that they does not know whether it would help the display to stay relevant over a longer period of time. They explain that in order for the display to be engaging and relevant to the user, the display should not require them to interrupt their current activities. In order to achieve this and not fade into the background the interviewee suggests that the display should be placed somewhere where people are waiting such as an elevator or printer.
A feature that is lacking from existing social media data display application is the ability for the administrator to see the unfiltered data. Especially when dealing with filtering data streams knowing what is being filtered out could help the administrators understanding of what the effect of the current filter settings are and to diagnose problems with the filter settings. When asked whether they need to be able to find out what data got filtered out the interviewees unanimously respond that they need this information in order to be able to make educated decisions when managing their filters.
One of the interviewees very clear expressed that the update rate of data is crucial to the
engagement of the user. This interviewee explained that when reading from a list of items it feels very frustrating to them if this list is never ending, updating while they are reading. On the other hand if the update rate is too low the data might appear static and the user might get bored which also negatively affects engagement. This affects both the public display and the administrative interface when displaying data stream data. So special care needs to be taken into consideration when fine-tuning the update rate of the data in order to keep as many users as possible engaged.
4.1.2. Public needs analysis
For the public users a questionnaire was chosen as the means of collecting user needs. A
questionnaire requires careful preparation in order to be able to capture all of the data required to analyze user needs but can be send out to a lot more potential users. As the public screen is meant to be exposed to a large and varied group of users a questionnaire will give an accurate representation of the user needs. To structure the questionnaire I first listed the information that I needed to get:
- Questions about the respondent to be able to estimate how their background influence their opinion on public Twitter displays.
- Questions about the content of a Tweet to figure out what information to display on the public screen.
- Questions about how the public screen should display and order individual tweets.
- Questions about if and how the display should summarize the data.
I used these topics to formulate several questions and added context and examples to clarify the questions where necessary. The questionnaire was distributed in several ways, first it was distributed face to face at the University of Twente by handing out notes with a short text about the research and a URL for the questionnaire, this way the questionnaire would reach a group of respondents that would be somewhat representative of general users of public social media displays. This resulted in very little answers and a lot of work to reach respondents therefore the questionnaire was posted on Facebook and Twitter where it was possible to reach a more varied, but potentially biased, group of respondents more easily. This still did not result in enough responses so the questionnaire was also posted on a social media site called Reddit where users answer questionnaires to help researchers out. This lead to a large enough group of respondents totaling 19 people.
From the results of the questionnaire it appears that over 50% of the respondents was in the age category of 18-24. This means that the results of this questionnaire do mostly represent that age category but as there is a fairly equal representation for the other age groups this should not be too big of an issue. Approximately 25% of the respondents encountered public Twitter displays more than once every half year which means that their experiences with such displays are limited.
Additionally only slightly over 50% of the respondents indicated they used Twitter themselves. About 40% of the respondents indicated that they’d imagine a Twitter display be placed at a conference which could influence the way they image the display would be used.
The respondents answered that the author of a tweet and the text of a tweet should definitely be shown on the display. Tweets can also include an optional image, the majority of respondents indicated that they think this image should also be displayed if present. When asked about the importance of displaying an image versus displaying the text the majority respondents answered that both are equally important and should both be shown. When asked whether the display should load a preview of a URL mentioned in a tweet none of the respondents indicated that they think this is a very important feature. According to most respondents tweets should be presented on the display for up to two minutes but there is not a clear preference for what the ordering of tweets on the display should be. Respondents indicated that they feel the most popular tweets should be
4.2. User scenarios
User scenarios are used to personify the problems that prototypical users are faced with when using a concept application. In this project the user scenarios function as a mental guide to help when making design decisions. The user scenarios are based on the data collected during the user analysis. As there are two target groups, two user scenarios are needed in order to determine how users use the application. The first user scenario will sketch the persona of the hypothetical administrative user Bob who helps organize a conference about web technologies, the second user scenario will sketch the persona of the hypothetical user Ross who visits the conference that Bob helped organize.
Bob is 35 years old and works for a company that makes web applications using the latest
technologies. As a marketing and hiring strategy his company organizes a yearly conference about web technologies where a number of speakers discuss the state of the art. At the conference there are also live coding presentations and other educational talks for less experienced visitors. The conference lasts several days. In order to engage the crowd and to provide filler in between presentations it is decided that at the conference there will be a number of displays that will show Tweets about the conference. Bob is put in charge of managing these displays but also has other tasks to tend to during the event. In preparation to the event Bob sets up a Twitter data streaming application to collect data for a certain hashtag specifically created for the event and he personalizes the displays using images, colors and texts for the event. During the event Bob occasionally checks the administrative display to see if everything is working correctly. He notices that one of the latest web technologies relevant to the conference just got trending on Twitter and decides to add it to the display. At some point during the event a tweet on the display, critical of the event, has to be
removed manually.
Ross is interested in web technologies and decides to visit a conference where there are a lot of interesting talks about the latest web technologies. At the conference there are a lot of displays that display interesting and useful information about the events. One of the things being displayed is a list of Tweets by attendees, Ross does not use Twitter often but because he does have an account he decides to post a Tweet about the event in the hopes of his tweet being displayed. He posts a tweet with a picture of himself at the event and uses the hashtag from the conference which is shown on the display. Ross’ tweet about the event gets displayed for a short amount of time and he talks to some visitors that noticed his tweet. Later Ross sees on the Twitter feed that one of the guest speakers, someone who Ross admires, is doing a sporadic open question session after his presentation that Ross decides to go to.
4.3. Market analysis
To get a clear picture of the features that are expected of a public twitter display it is also possible to examine existing applications. The two applications where studied for this paper are TweetBeam and TweetWall. Both of these are web-based applications which provide users with an appealing
visualization of recent tweets generated by a search term. This makes these applications ideal for public events as the visualization can be put up on a screen and the public can interact with the visualization by posting their own tweets which match the search term that the display uses to collect tweets. Close examination revealed that both TweetBeam and Tweetwall use the Twitter REST API to collect their data. Additionally they give their users the option to filter the data based on certain settings, for example using a word blacklist which prevents posts containing certain words from getting displayed on the public display. These applications also allow the users to curate the display manually; meaning that only the tweets approved by a user get displayed publicly.
regularly highlights one random tweet by showing its text and author. This means that although TweetBeam looks quite interesting at a glance when looking more closely there is only a single tweet that you can read at a time and users don’t have any control over which tweet they get to read. TweetWall allows the administrator to customize the display by adding a logo, text and color to the display. Administrators don’t have much control over the way Tweets are displayed they can however choose to enable a leaderboard that is displayed next to the tweets on which users can compete over a number of different variables such as most post. Twitter also maintains a list of requirements for applications that display tweets1. Although these requirements are not mandated
by Twitter they can be used to get an impression of how applications are expected to display this kind of data.
4.4. Functional specification
Based on the user analysis a set of functional requirements is formulated. This section will mainly focus on describing the functionalities that are relevant to evaluating the research questions. These three main functionalities that will be described are “suggestions”, “insight into removed data” and “separation”.
4.4.1. General
In order to evaluate the main features properly the basic functionality of the application should work as the user expects it to. This means users should be able to easily control the stream data collection parameters such as the keywords and users to track tweets from. The prototype should at least include a blacklist filter that allows the users to filter tweets based on words it contains or the user who posted or retweeted the tweet. Additionally because this prototype is dealing with big data it should guarantee high performance and fault tolerance.
4.4.2. Suggestions
Suggestions are a way to help the user make decisions while not taking any control away from them. Since the application has access to all the data that is being streamed and can perform complex analysis on that data it is possible to deduce that perhaps certain settings can be improved. The application could then show the user a suggestion to change the setting in question. An example in which suggestions can really help the user is by suggesting keywords that can be used for data collection, the application can constantly monitor all collected data and analyze the text for keywords that repeatedly show up together. These keywords can then be suggested to the user as they are most likely related to the topic the user is already collecting data for. The user can then press one button to automatically update the search query.
4.4.3. Insight into removed data
Secondly the application should give the user insight into the data that was removed by the filters. From the user analysis it appeared that being able to see what data was removed by the filters can assist the user in updating those filters to better reflect the content they want to allow. A sample of the data that was filtered out should be presented to the user and alongside that data there should be an explanation for what filter caused this data to be removed. Using this information a user can
quickly see what data was erroneously filtered out and correct the filters to prevent this from happening again. Because this feature is showing continuous real-time data it needs to sample that data in order to not overload the user with information.
4.4.4. Separation
One thing that was noticed during the user analysis is that the requirements of the application heavily depend on the context and the user. In order to easily support many different types of filtering and allow the user to manage these filters a modular approach is necessary. This means that each filter will be a self-contained part of the application and users are able to easily toggle filters on and off. Breaking up the interface in blocks that bundle relevant controls together, should allow users to find relevant filter settings without having to look through irrelevant filters. Additionally this should make it easy for the user to understand what settings belong to what filter and understand the effects of certain filters.
5. REALIZATION
In order to evaluate whether the functions described in the functional specification answer the research questions a prototype needs to be realized. In this section a technical overview of the realization of the prototype will be given describing decisions made in the process.
5.1. Setup
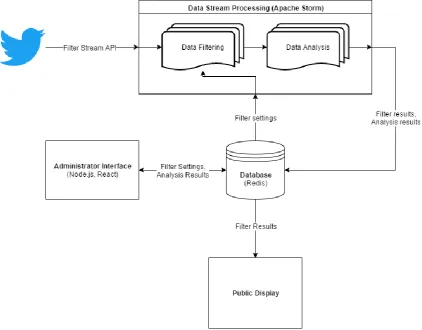
In order to start developing a prototype a decision had to be made regarding the tools that would be used. For the part of the application that performs the data streaming, filtering and analyzing high performance is was necessary. Several frameworks were considered to make high performance streaming of data easier. Apache Storm was chosen because it was developed at Twitter (Toshniwal, et al., 2014) so clearly it was capable of dealing with that kind of data. For the interface JavaScript was chosen because it is easy to develop cross platform interfaces using web technologies. This means that the interface consists of a webserver that allows the user to change filter settings in Storm from a webpage. Some type of data transfer tool was needed between the interface and Storm in order to update the settings and provide the interface with all the required data. For this Redis was chosen, Redis is an in-memory data structure store which means that it can act as a small database to hold settings and other data and a message broker that is used to send messages
between different components. Redis was chosen because of how fast it is and because it has a lot of different libraries that make it easy to use in many different languages. Using these tools high
[image:21.595.73.496.415.745.2]performance and fault tolerance are achieved since all components only rely on being able to access the data stored on Redis and both Storm and Redis are built for performance. In figure 1 an overview of how these technologies and tools are linked together in the prototype.
5.2. Filtering and insight into removed data
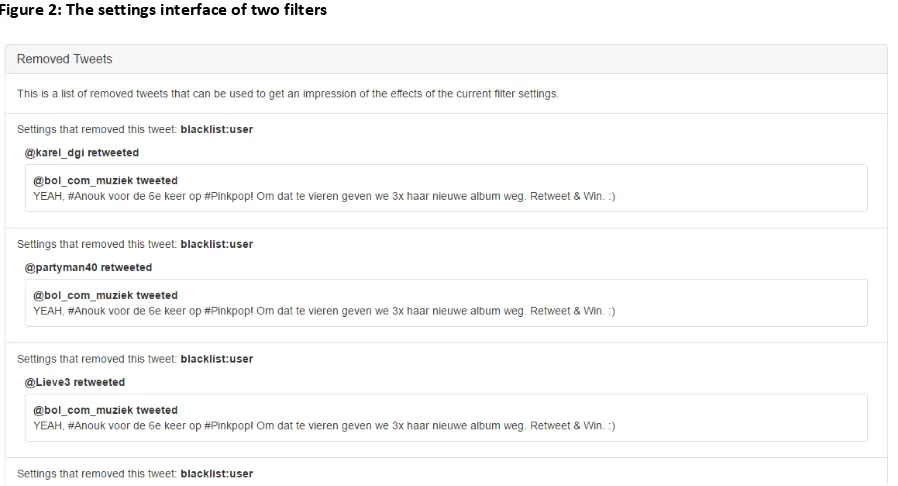
Figure 2: The settings interface of two filters
Figure 3: removed tweets list
Filtering was implemented as one of the steps (called “bolts” in Storm) in the data stream processing section of the application. A filter is a bolt in Storm that marks tweets as filtered based on certain settings. These settings are read from the Redis database. Settings are cached inside the bolt which means that whenever the settings are updated the bolt has to be send a message to tell it to update its cache. The main filter implemented in the prototype is a blacklist filter that matches the full text of a tweet to a list of blacklisted words, in case a tweet contains such a word it will mark it as filtered. This blacklist filter can also check if the user that posted or retweeted the tweet is blacklisted and will also mark the tweet filtered if that is the case. Along with marking a tweet filtered the filter will also attach its own name to the tweet. The reason the bolt does not remove the filtered tweet
[image:22.595.72.521.263.506.2]5.3. Suggestions
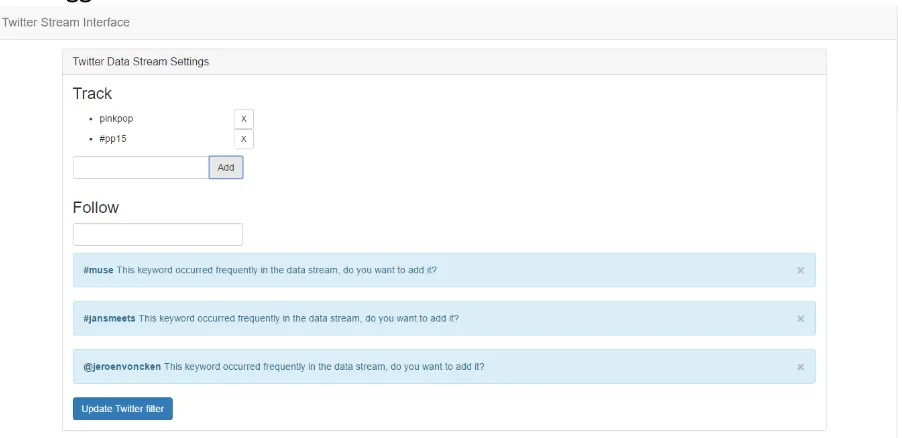
Figure 4: Data collection settings with suggestions
Like filtering the main suggestion functionality is implemented as a bolt in Storm. This is part of the analysis stage of the stream data processing because it does not affect any tweets and produces its own data. The suggestion that was implemented in the prototype suggests keywords to the user that are frequently used in the collected tweets and therefore are likely to be related search terms. The bolt keeps track of keywords that frequently occur in the last few tweets and stores the keywords that are not similar to the current search terms in the database where they can be accessed by the interface. In figure 4 suggestions are shown as implemented in the prototype.
5.4. Separation
6. EVALUATION
In order to answer the research question it is necessary to evaluate the prototype. In this section the experimental setup of the evaluation is described then the method of assessing the results is
explained. Lastly the results and a preliminary conclusion are given.
6.1. Experimental setup
The setup for the evaluation is important to get accurate results. Therefore the experimental setup is performed with twitter data that was collected prior to the evaluation. Data for three events in the Netherlands was chosen for the evaluation as these event are more relatable to the test subjects. This ensures that there is a more constant flow of data during the evaluation something that is unreliable when streaming real-time Twitter data. Prior to the evaluation the test subject can choose which topic they would like to use during the evaluation. Then the application is setup to
continuously loop through the prepared data while the evaluation is happening. The test subject is then presented with the administrative interface on a computer screen and a simple public display on another screen. The test subject is then asked to use the administrative interface to manage the public display, ensuring that it filters content they deem inappropriate for displaying publicly at the event.
Three test subjects were the same people that were asked to be interviewed for the administrator needs analysis. These subjects were chosen based on the criteria that they were likely to manage a social media displays in the future and had experience managing events.
6.2. Assessment method
The method used for getting feedback from the evaluation is a think aloud usability test. In a think aloud usability test participants are asked to constantly talk about what they are thinking about while performing the evaluation. Think aloud testing is standard usability testing method since the
appearance of the original paper by Ericsson and Simon (1980). Using this method it is possible to get an accurate impression of how the user experiences the application and how they use certain
features. In order to get a more complete impression of the how what the test subject thinks about the application in relation to the research question a post-task interview is conducted where the test subject is questioned about the observations they made during the think-out-loud test. The data collected using these methods will be processed by collecting and summarizing the key-insights provided by the participants. As the participants to the evaluation are the same as those from the user needs analysis their reactions can be compared to establish how effective the prototype is in assisting them with defining filter settings.
6.3. Results
Here the results from the evaluation will shortly be discussed, these results will mostly be related to the functionality and usability of the prototype. In the conclusion section of this paper these results will be related to the research questions in order to reach a final conclusion.
information was missing from the prototype whereas the participants indicated that such
information would potentially be useful in order to help them define more efficient filter settings.
The realism of evaluation was impacted by the fact that it was performed with prepared data. Although the reasoning for using prepared data, described above, is logical this had some unexpected consequences on the evaluation: Because participants were not able to alter data collection settings the feedback loop allowing them to see the changed data being collected was missing. This prevented the participants from seeing how their filters deal with the change in incoming data. For the suggestions feature this meant that was more difficult to evaluate it accurately as in the current prototype this was designed to suggest keywords for data collection. When asked how useful the participants felt the suggestions were in order to help them define filters all participants answered that they considered this a very helpful feature of the prototype, despite not actually affecting the data collection during the evaluation. One participant indicated that there was the possibility to have more different types of suggestions, they introduced the idea that
suggestions could be used to suggest removal of a blacklisted word if it would filter too many tweets.
The insight into removed/filtered data was considered very helpful in defining filters. This feature was something participants heavily depended on during the evaluation in order to test their filter settings allowing them to check whether the tweets that were removed actually should have been removed. When asked about the feature in the post interview participants explained that while they did rely on the list of removed tweets they felt that it could be improved with a clearer design. One suggestion was to allow them to click on the reason and immediately jumping to and highlighting that specific setting. However participants also noted that the current implementation does not deal well with changes to the filter settings. When the filter settings are changed the information in the removed data list is out of date and this should be displayed. One participant also explained how the list does not deal well with information overload, although speed of updates was low, updates while reading the information bothered the participant.
7. CONCLUSION AND DISCUSSION
The prototype was designed to solve the usability problems identified in the current situation. Therefore it is possible to use the feedback on the usability from the evaluation to describe to what extend the prototype improves the situation. Although the performed evaluation presents enough information in order to conclude whether or not the prototype successfully assist users, the limited number of participants means that future research is necessary to clearly define their effectiveness. In this chapter the feedback from the evaluation will be discussed in relation to the research
questions in order to answer them.
7.1. Engaging ways to present social media data streams
The research question “What are engaging ways to present social media data streams?” aimed to understand what requirements users have towards filters. If for example research indicated that aggregate information such as summaries is an engaging way of presenting data streams then perhaps the filters should focus on creating a representative set of data. In order to answer this question a literature study into public displays, a user needs analysis into displaying twitter data and a market analysis were performed. The conclusion from this research is that the way users desire social media data streams to be displayed as individual posts. In order to prevent the users from getting overloaded by the amount of data, and thereby disengaging users, this data should update infrequently. The literature on the topic of engaging displays indicates that the best way to boost engagement is to allow users to interact with this data in a meaningful way. As this answer was satisfactory in the context of this paper, the influence of interactivity on engagement was not further explored.
7.2. Preventing information overload when assisting in defining filters
Literature research presented a clear definition of information overload as “when more information is presented than the information processing capabilities can handle”, this offers a clear option in order to prevent this from happening which is reducing the amount of information presented. After interviewing potential future users of the administrator interface, two strategies for reducing or preventing information overload where chosen for testing: “suggestions” and “separation”. Suggestions show the results of analyses that happen without input from the user in order to help them improve their filters and separation means that all filter settings are grouped and independent of each other allowing users to easily focus on the information relevant to them at that time. During the evaluation participants were able to add keywords related to their current collection settings using suggestions without having to analyze the collected data themselves. Participants did not actively notice the separation as a feature of the prototype but afterwards did indicate that this “felt natural”. This indicates that these features are effective in preventing information overload when assisting the user in defining filters for social media data streams. Participants did indicate that they did not like information updating while they were using it, while did not happen with the suggestions the list of removed data was set to update every 5 seconds which caused participants some trouble.
7.3. Necessary information to define filters for data streams
potential feature that would allow users insight into the data removed by their filters, this would allow users to see what data was erroneously removed and adapt their filters to prevent this from happening again. Evaluation of this feature revealed that this information was very useful for the users in defining their filters. Participants of the evaluation would, after discovering the list of removed data in the interface, change their filters then wait a bit and check the list of removed data for tweets that should not have been removed.
7.4. How to assist in defining effective filters for data streams
The answer to the main research question is in the form of several suggestions that aid administrators in defining filters for social media data streams. Based on the evaluation of the prototype “suggestions”, “insight into removed data” and “separation” are effective ways to assist administrators with this tasks. Therefore this paper suggests that applications which allow users to filter social media data should:
Present the data resulting from complex analyses of the data stream as a suggestion to the user in order to decrease the risk of information overload without taking away control over the filter settings. This suggestion should preferably allow the user to “agree” and implement changes to the filter settings with a single click.
Present the user with the data that was removed from the data stream in order to give the user clear insight into what their filters are doing. Without this information it is much more difficult for the user to find out if their filter settings are removing data that they should not remove.
Separate settings and data into logical groups and allow filters to operate completely independently from each other. This allows the user to easily customize and change filters both preventing unexpected results and preventing information overload by limiting the amount of unrelated things on the screen when the user is changing a setting.
7.5. Future work
Although this paper found several features that assist users with defining social media data stream filters, more can be done in order to improve and further solidify the information obtained by this research.
One option for solidifying this research is to perform more interviews with potential future administrators in order to discover more features that will assist them in defining filters. Although the three suggested features achieve the desired goal there are possibly more abilities for data stream management applications to assist administrators in defining effective filters. These potential features can be discovered and ideated on by further user centered and participatory design trials involving existing or potential future users of data stream management applications.
The prototype created in order to evaluate the suggested features could also be improved based on the user feedback from the evaluation. Several potential improvements have already been
mentioned in the results of the evaluation section of this paper and further evaluation of the current prototype would probably result in more potential improvements. Furthermore the current
As mentioned the evaluation was performed with prepared Twitter data in order to guarantee that the evaluation would lead to useful results, however it is possible that there are aspects of the prototype users react differently to when they deal with real-time Twitter data. As the prototype was originally build to support this real-time data and only later adapted to work with prepared data this is simple to change back. For these reasons future research could aim to confirm the results from this paper with real-time data. Furthermore future research could determine whether the results that were achieved in the evaluation of the prototype are also true for other social media platforms or possibly unstructured user generated data streams in general.
APPENDIX 1: QUESTIONNAIRE
Twitter display questionnaire
This questionnaire will ask some questions about Twitter displays. These displays take tweets on a certain topic and display them in real-time on large screens. They are usually placed at events such as music festivals and conferences but can also be placed in public areas, in the lobby of a company’s headquarters or other publicly accessible.
The purpose of Twitter displays is usually to give visitors an impression of the public opinion on a certain topic and to create engagement by having people post tweets concerning that topic to make it onto the display.
The goal of this questionnaire is to better understand what you, as a potential user of such a display, desire from a Twitter display. This data can then be used to design a display that will match the needs and desires of the users.
This questionnaire should take approximately 10 minutes to complete.
Background and experience
In this section we will ask some questions about your background and experiences with data streams and public displays
1. Please select your age *
Mark only one oval.
o less than 18
o 18 - 24
o 25 - 34
o 45 - 54
o 55 and over
o I prefer not to say
2. What is your educational background? *
Tick all that apply.
o Behavioural, Management and Social sciences
o Engineering Technology
o Electrical Engineering, Mathematics and Computer Science
o Science and Technology
o Geo-Information Science and Earth Observation
o Other:
3. Approximately how often do you use Twitter? *
Mark only one oval.
o Daily
o Weekly
o Monthly
o Less than monthly
o Never
4. Approximately how often do you encounter Twitter displays? *
Mark only one oval.
o More than monthly
o Monthly
o Half-yearly
o Yearly
o Less than yearly
o Never
5. Where did you encounter Twitter displays?
If you have never encountered a public Twitter display please leave this blank
6. In what situation would a Twitter display be placed? *
Please keep this situation in mind when answering the rest of the questions
Twitter display content
Please keep in mind the situation you imagined the Twitter display in while answering the previous question.
Example: Tweet with labelled contents
7. How important is it to you that a Twitter display shows the author of a Tweet? *
not important 1 2 3 4 5 very important
8. How important is it to you that a Twitter display shows the text content of a Tweet? *
not important 1 2 3 4 5 very important
9. How important is it to you that a Twitter display shows the image referenced in a Tweet? *
Keep in mind that not all tweets reference an image
not important 1 2 3 4 5 very important
10. Rate the importance of showing the Tweet text versus referenced image?
11. How important is it to you that the Twitter display shows a preview of a referenced URL? *
Keep in mind that not all tweets reference an URL
not important 1 2 3 4 5 very important
12. How do you think Tweets should be ordered? *
Mark only one oval.
o time posted (newest to oldest)
o popularity (likes/retweets)
o length (number of words)
o unordered
o Other:
13. How long should a Tweet stay on the display? *
Minimum time a tweet should be displayed
Mark only one oval.
o less than 1 minute
o 1 - 2 minutes
o 2 - 5 minutes
o 5 - 10 minutes
o longer than 10 minutes
Example: Highlighted tweet example
14. Should tweets on the public display be highlighted? *
Highlighted tweets are displayed in a way that makes them appear more important than other tweets. If yes then what should determine which tweet gets highlighted?
Mark only one oval.
o yes; highlight based on popularity (likes/retweets)
o yes; highlight based on time posted
o yes; highlight based on the author
o no; all tweets should be displayed the same at all times
o Other:
15. How long should a Tweet stay highlighted?
Only required if you answered yes on the previous question
Mark only one oval.
o less than 30 second
o 30 - 60 seconds
o 1 - 2 minutes
o longer than 2 minutes
Collected Tweet summaries
It is also possible for the display to create a summary of the Tweets collected. Data such as
locations, frequent words, sentiments and authors can be collected and displayed on the screen. The following questions are about such data summaries.
Example: Word cloud example
16. A word cloud would add interesting/valuable information to the display *
A word cloud is a collection of words that are shown based on their frequency as shown above.
Example: Map with frequency per country
17. A map with frequency of tweets per country would add interesting/valuable information to the display *
disagree 1 2 3 4 5 agree
Example: Timeline with frequency of tweets
18. A timeline with frequency of tweets would add interesting/valuable information to the display *
disagree 1 2 3 4 5 agree
19. A leader board would add interesting/valuable information to the display *
A leader board is a list of names of users ranked by a score. This score could be calculated by e.g. the number of tweets of a user that contained a chosen hashtag.
disagree 1 2 3 4 5 agree
20. A network graph would add interesting/valuable information to the display *
In a network graph users are displayed as dots and tweets at another user are displayed as lines in between two dots. Through calculations one can layout the users that have more/stronger connections together and create an appealing visualisation of a network.
disagree 1 2 3 4 5 agree
21. Do you agree with this statement: Summaries should be shown instead of individual tweets *
Mark only one oval.
o Yes
APPENDIX 2: QUESTIONNAIRE ANSWERS
Timestamp
Please select your
age What is your educational background?
Approximately how often do you use Twitter?
22/11/2016
14:43:12 35 - 44
Electrical Engineering, Mathematics and
Computer Science Weekly
12/12/2016
12:53:52 18 - 24
Electrical Engineering, Mathematics and
Computer Science Daily
12/12/2016
13:00:06 18 - 24
Engineering Technology, Science and
Technology Never
12/12/2016
13:52:52 18 - 24
Behavioural, Management and Social sciences, Engineering Technology, Science and
Technology Never
12/12/2016
15:09:56 18 - 24 Behavioural, Management and Social sciences Never 12/12/2016
18:17:43 18 - 24
Electrical Engineering, Mathematics and
Computer Science Monthly
12/12/2016
21:26:43 18 - 24 Arts Never
13/12/2016
10:07:38 18 - 24
Electrical Engineering, Mathematics and
Computer Science Never
14/12/2016
18:44:21 18 - 24 Media Daily
15/12/2016
11:09:51 25 - 34
Behavioural, Management and Social sciences, Electrical Engineering, Mathematics and
Computer Science Daily
16/12/2016 07:03:55
55 and
over Behavioural, Management and Social sciences Daily 30/12/2016
16:07:42 45 - 54 Business/Economics Daily 30/12/2016
16:09:05 18 - 24 Behavioural, Management and Social sciences Weekly 30/12/2016
16:54:56 35 - 44 High school graduate/no degree Less than monthly 30/12/2016
18:41:45 25 - 34
Electrical Engineering, Mathematics and
Computer Science Never
30/12/2016 19:43:23
less than
18 general education Never
31/12/2016
01:50:00 18 - 24 Behavioural, Management and Social sciences Daily 31/12/2016
04:42:30 35 - 44
Electrical Engineering, Mathematics and
Computer Science, law Never
31/12/2016 20:30:40
less than
18 Science and Technology Never
Approximately how often do you encounter Twitter displays?
Where did you encounter Twitter displays?
In what situation would a Twitter display be placed?
How important is it to you that a Twitter display shows the
How important is it to you that a Twitter display shows the
author of a Tweet?
text content of a Tweet?
Less than yearly During research None 3 4 4
Half-yearly
Vestingbar,
create tomorrow Events? 4 4 5
Less than yearly Footballmatch Lots of people 5 4 5
Monthly Central station
Participatory installation for thoughtful urban
planning 2 4 4
Half-yearly
In a banner during the 3FM Serious Request and the Top2000
tv broadcast. Tv broadcast 4 4 3
Less than yearly
pretty sure I've seen one, but I can't recall specifically where
when other(s), want/need to be notified of specific topics or #hashtags that can be followed on twitter, e.g.: trains are late #NS, traffic jam on #A1 highway, any other event that is likely to be live
tweeted. 5 5 4
Never Dunno 5 5 5
Yearly
Congresses, think tanks
Bigger public
gatherings 3 5 1
More than
monthly School
A social setting. Somewhere where a lot of people hang
out. 4 5 5
Half-yearly
Companies, conferences and more general big, open events.
Entrance halls of conferences, on the screen of the keynote presentors and on sales floors of
companies. 4 5 5
Monthly
Websites, conferences
To represent the opinion of the people
on a certain topic 5 5 5
Never
Political event or
conference 4 5 1
Monthly
At political events and the
likes Behind a panel 4 5 3
Less than yearly
Concert venues,
TV Concerts I guess? 4 4 5
More than monthly
television, blogs,
news articles never 1 3 1
Never conferences 5 5 5