Mechanical Properties of High Strength Al-Mg-Si Alloy during Solidification
Hiromi Nagaumi
1, Pongsugitwat Suvanchai
2, Toshimitsu Okane
3and Takateru Umeda
2;41Nikkei Research & Development Center (NRDC), Nippon Light Metal Company Ltd., Shizuoka 421-32, Japan
2Department of Metallurgical Engineering, Faculty of Engineering, Chulalongkorn University, Bangkok, 10330 THAILAND 3
Digital Manufacturing Research Center, National Institute of Advanced Industrial Science and Technology (AIST), Tsukuba 305-8564, Japan
4Professor Emeritus, The University of Tokyo, Tokyo 113-8656, Japan
Mechanical properties of high strength Al-Mg-Si alloy during solidification have been investigated. Tensile strength and ductility have been measured by using an electromagnetic induction heating tensile machine. The relation between solid fraction and temperature was calculated by the Gulliver-Scheil model applied with the thermodynamic data-base Thermo-Calc for multi-component system, and its validity was confirmed, comparing with the experiment. Zero Strength Temperature (ZST) and Zero Ductility Temperature (ZDT) were evaluated and correlated with the corresponding solid fraction. Furthermore, the capability of the high temperature tensile test to apply to the break-out of direct chill (DC) casting was examined, comparing the breaking section of the tensile test sample with that of DC billet. Main conclusions are as follows: (1) ZST and ZDT were 893 and 883 K at which the corresponding solid fraction were 0.69 and 0.77, respectively. (2) Breaking sections of the tensile testing sample and DC billet had a similar rupture structure where intergranular fracture was observed. Consequently, it was considered that breaking elongation and breaking strength that were obtained by the present tensile test can be used as one of the criteria of
Direct-Chill casting crack formation. [doi:10.2320/matertrans.47.2918]
(Received June 29, 2006; Accepted September 12, 2006; Published December 15, 2006)
Keywords: tensile strength, ductility, aluminum-magnesium-silicon alloy, intergranular fracture, hot tearing, fracture strain, solidification
1. Introduction
Direct-Chill (DC) semi-continuous casting of round billet is one of the most important processes in the production of aluminum. A major problem is the internal cracking, or so-called hot tearing, during casting, because the crack is a serious factor which inhibits the productivity.
Investigations on hot tears have been reported in many previous studies1–19) and it is concluded that when tensile
stress or strain exceeds the fracture strength or fracture strain of the solidifying material, a crack can be generated. Values of fracture strain and fracture strength, however, are consid-erably different by measurement technique used and exper-imental condition applied. Therefore, the criteria of the crack and measurement method of hot tears have not yet been established well.
Recently a high-strength Al-Mg-Si alloy stronger than AA6061 alloy has been developed, and has been rapidly commercialized. However a DC billet of the high-strength Al-Mg-Si alloy has been found to be prone to cracking.20)To prevent this it is necessary to reduce the casting speed and the billet size. In order to understand the phenomenon of the cracking in detail and to prevent the occurrence of the hot tears, the mechanical properties of the alloy at high temper-atures are indispensable. In this study, the tensile strength and ductility, during mushy zone, of the high-strength Al-Mg-Si alloy were measured by means of a dedicated tensile machine with an electromagnetic induction heating. The relation between solid fraction and temperature was calculated by the commercial software package of multicomponent thermody-namic database of Thermo-Calc, and also by specific heat curve that was continuously measured during solidification. The results obtained by the above two methods were discussed, and the relationship between tensile strength, ductility in the mushy zone and solid fraction was clarified.
Furthermore, by comparing the breaking section of the tensile testing sample with breaking section of DC billet, the capability of this high temperature tensile test was examined.
2. Experiment
2.1 Materials
The sample used for this study was a high-strength Al-Mg-Si alloy called as HS60. Chemical composition of the sample is given in Table 1. Test samples were taken from the DC billet. Billet of the high-strength Al-Mg-Si alloy with a diameter of 325 mm was cast under the typical DC conditions as shown in Table 2.
2.2 Tensile testing during solidification
[image:1.595.306.550.680.710.2]Two different ways of evaluating mechanical properties such as strength, etc., in mushy zone of alloys, have been used. One is heating the specimen from the ambient temperature up to the test temperature, which is above the solidus, and then performing the test procedure (non-melting type). The other one method is in-situ testing in which the sample is melted first and then cooled down, and then the
Table 1 Chemical composition of the high strength Al-Mg-Si alloy (in
mass%).
Si Fe Cu Mn Mg Cr Ti Zn
1.23 0.16 0.79 0.39 1.12 0.38 0.02 <0:01
Table 2 Casting conditions.
Casting temperature (K)
Casting speed (mm/min)
Metal level (mm)
Water supply (l/min)
Cast length (mm)
993 55 15 150 650
mechanical testing is performed during solidification of the alloy (remelt type). We adopted the remelt type of high temperature tensile test for the present. The remelt type of testing has a feature of simulating not only crack formation during solidification but also the surface crack formation of materials transformed after solidification.11)
The test sample with a diameter of 10 mm and length of 100 mm was set up with accessories shown in Fig. 1. The accessories (High sensitivity load cell, Cooling water-jackets and Sleeve, etc.) which are hatched in the figure were used for three purposes: 1) to prevent any stress in the lateral direction; 2) to introduce a highly sensitive load cell of capacity 4950N for measurement of a minute load in mushy zone of aluminum alloys; 3) to introduce water-jackets at both ends of the specimen for cooling the sample symmetri-cally.
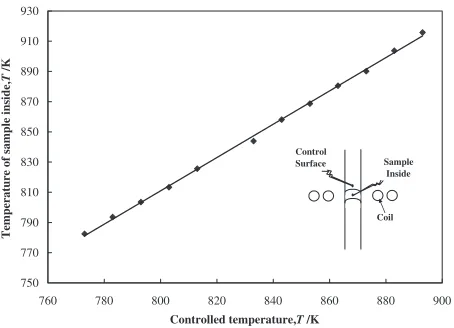
During the experiment, temperature control was performed with a thermocouple (called as control thermocouple) welded on the surface of the specimen as shown in Fig. 1(b). The position of the thermocouple was at the same vertical position as the upper edge of the induction coil which was almost coincident with the upper edge of molten zone. As shown in Fig. 2, the relationship between temperatures at the center of the molten zone and at the control thermocouple position had to be examined beforehand so that we could control the temperature of the molten part inside by adjusting
the control thermocouple. The length of molten zone, about 7 mm, was measured from the each experiment and this was used as the initial length in calculating the strain rate, which was set at 102s1 throughout this work. The accuracy of
temperature control was within about2K with the method described above. All the experiments were done under an argon atmosphere with the pressure of 0.1 MPa.
[image:2.595.313.540.73.223.2]Thermal history applied to a specimen was shown in Fig. 3. First, the specimen was heated up to temperature above its liquidus temperature, and then kept for 60 s. Next, it was cooled down to the test temperature as cooling rate 1 K/ s. In order to keep the uniformity of the temperature in the molten zone, the sample was held for 60 s after reaching test temperature. By this experimental procedure, solidification structure was obtained. It was confirmed that the remelt zone was kept almost uniform at the beginning of tensile deformation. Finally, tensile deformation was applied at the strain rate of1102s1 and the load-displacement curve
of the specimen was recorded.
2.3 Quenching test during solidification
In order to confirm the calculation results of solidification path, an interrupted solidification was carried out. Several temperatures in the freezing range of the alloy were selected to establish the crystallization of phases, which were determined by means of the electron probe micro analysis (EPMA). A sample with 7 mm in diameter and 5 mm in length was set up in the furnace, and then first heated up to 973 K, and then kept for 600 s. Next, it was cooled at a rate of 1 K/s to the test temperature before quenching. When temperature was reached to the prescribed one, the sample was kept for 30 s, and then dropped into a water bath for the quenching. The temperature control was carried out by the thermocouple installed at the molten zone of the sample, and the cooling rate was more than 150 K/s during quenching. Quenched samples were mechanically polished, etched for microstructure observation and then supplied to EPMA.
3. Experimental Results and Discussion
3.1 Specific heat
Using an insulating type measuring device of specific heat, the specific heat of this alloy was continuously measured in the range from room temperature to 973 K. Through the Load Cell
(High Sensitivity) Specimen
φ10 mm×100 mm Induction Coil Sleeve Cooling Water Thermocouple (Type R) Cooling Water Upper Ram (Fixed)
Lower Ram (to Hydraulic Cylinder) (a) 7mm Thermocouple Molten Zone Induction Coil Specimen Sleeve (b)
Fig. 1 Schematic diagram of high temperature tensile testing machine.
750 770 790 810 830 850 870 890 910 930
760 780 800 820 840 860 880 900
Control
Surface Sample
Inside
Coil
Temperature of sample inside,
T
/K
Controlled temperature,T /K
Fig. 2 Temperature difference between the inner molten zone and outer
surface located with the controlled thermocouple.
270 370 470 570 670 770 870 970
0 100 200 300 400 500 600 700
Time, t /s
60s
60s 783K
863
60s
10-2/s 913K
863K
1K/s
Temperatue of sample,
T
/K
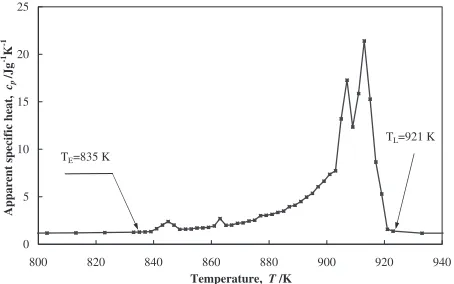
[image:2.595.57.282.74.214.2] [image:2.595.56.283.259.423.2]specific heat measurement a constant energy of 1.6 W/s was supplied to the sample and the temperature change of the specific heat was examined. The heating rate was about 0.025–0.042 K/s up to the solidus temperature, and 0.0013– 0.0042 K/s in the solid-liquid coexistence range. Figure 4 shows the specific heat-temperature curve from solid to liquid. Liquidus and solidus temperatures measured at this heating velocity were assumed as the equilibrium ones for this alloy. The liquids and solidus temperatures of this alloy are 921 and 835 K, respectively. The relation between solid fraction and temperature of equilibrium solidification was calculated, by using the specific heat curve, as the ratio of the heat release from liquidus to the testing temperature to the total heat release during solidification between liquidus and solidus.21)
3.2 Relation between solid fraction and temperature
For comparing the deformation behavior in the solid-liquid coexistence range between different alloys, it was desirable that not only relationship between strength and temperature but also relationship between solid fraction and temperature were determined. In this study, the commercial software package of Thermo-Calc was used to calculate the relation between solid fraction and temperature, which was evaluated with local equilibrium assumption at the solid-liquid inter-face under the non-equilibrium condition in the whole solidification progress. The fraction of each phase formed during solidification using the Gulliver-Scheil model is shown in Fig. 5. As shown in Fig. 5, the phase formation sequence during solidification is (Al) !(AlFeMn)!
Mg2Si! (AlFeSi) !Al8FeMg3Si6 ! Al5Cu2Mg8Si!
Al7Cu2Fe!Al2Cu. The finally formed phase is Al2Cu at
about 788 K and then the solidification finished at 783 K. Figure 6 shows a comparison of solid fraction calculated by the Gulliver-Scheil model using Thermo-Calc with an equilibrium one calculated from the specific heat curve. The solidification temperatures from liquidus temperature down to solid fraction of 0.7 are almost same for the two methods, but the final stage of solidification is quite different. Solid-ification completion temperatures are different; 835 and 783 K obtained by specific heat curve and by the Gulliver-Scheil model, respectively. The difference is between two extreme models to calculate the solidification path, namely, complete diffusion and no diffusion in solid. Let again
compare one example, at 823 K, as shown in Fig. 6: for equilibrium condition based on the specific heat measure-ment, solidification is finished above this temperature, but for no diffusion in solid solidification is not complete and liquid still remains around 10%.
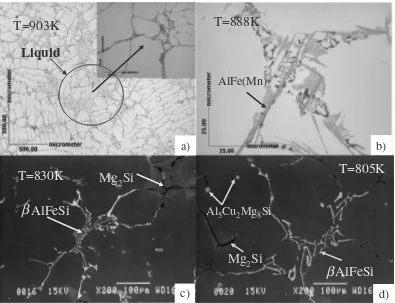
In order to confirm the calculation results of solidification path, a quenching test mentioned above was performed. Several temperatures were selected for the quenching test and the quenched samples were observed and analyzed by EPMA and the results are shown in Fig. 7. At a temperature of 903 K (solid fraction 0.56), the liquid remained in a large area and no any phase except the primary fcc solid-solution aluminum phase (fcc Al) was observed. When the temperature decreas-ed to 888 K (solid fraction 0.74), only the phase(AlFeMn) other than fcc Al was observed. When the temperature was down to 830 K (solid fraction 0.92), Mg2Si and (AlFeSi)
were observed. Furthermore, when the temperature decreas-ed to 805 K (solid fraction 0.97), almost phases were observed. The experimental results (Fig. 7) are in good agreement with the calculation results as shown in Figs. 5 and 6. According to the recent paper, the validity of Thermo-Calc prediction to solidification sequence of this alloy system with a little different composition was also confirmed.22)
3.3 Mechanical properties; ZDT and ZST
Figure 8 shows the relationship of tensile strength, elongation, solid fraction and temperature. The tensile strength decreases with the increase in temperature. When the temperature reached 893 K, tensile strength became zero. The minimum temperature above which strength was not perceptible was defined as the ZST11,23) (Zero Strength
Temperature), so the temperature 893 K is ZST of this alloy, at which the corresponding solid fraction is 0.69. In the same manner, ZDT11,23)(Zero Ductility Temperature) was defined
as the minimum temperature above which alloys showed no ductility. The ZDT also was determined from the relationship between elongation and temperature, which was obtained by tensile test. The ZDT of this alloy is 883 K and the corresponding solid fraction is 0.77.
As the temperature goes down from temperature 893 K to 833 K (during mushy zone), the tensile strength gradually increases. The tensile strength, however, substantially
in-0 5 10 15 20 25
800 820 840 860 880 900 920 940
p
/Jg
-1K
-1
TL=921 K
TE=835 K
Temperature, T /K
Apparent specific heat,
c
Fig. 4 Specific heat-temperature curve from room temperature to liquid.
760 780 800 820 840 860 880 900 920 940
0.00 0.20 0.40 0.60 0.80 1.00
Phase mass fraction
Temperature, T /K Liquid FCC Al 760 780 800 820 840 860 880 900 920 940
0.000 0.001 0.002 0.003 0.004 0.005 0.006 0.007
α(AlFeMn)
Mg2Si
Al8FeMg3Si6
Al5Cu2Mg8Si β(AlFeSi)
Al7Cu2Fe
Fig. 5 A calculated phase fraction for the alloy showing the fraction of the
[image:3.595.56.283.73.215.2] [image:3.595.314.539.75.210.2]creases with the decrease in temperature from 833 K. On the other hand, the elongation gradually increases with the decreasing temperature from 833 K. The difference in behavior between tensile strength and elongation at later stage of solidification is closely related to the existence of liquid along neighboring dendrites such as liquid film, which contributes greatly the response of strength and ductility.9)
ZDT and ZST played a very important role in solidification cracking sensitivity.20,24) There is a temperature range between ZST and ZDT of this alloy as shown in Fig. 8. The temperature range between ZST and ZDT is supposed to be sensitive for hot tearing because there is very low strength and no ductility.11)
3.4 Observation of fracture surfaces
Figure 9 indicates fracture surfaces examined at the center, mid-center and surface of the billet by scanning electron microscopy (SEM). Fracture surfaces of center and mid-center parts have a rupture structure where intergranular fractures with remaining liquid around interdendritic regions are observed. Namely the internal crack occurs in the solid/ liquid coexisting (mushy) state. It was deduced that the crack propagated from its starting point to the top of the billet as casting had proceeded. Moreover, many intermetallic com-pounds and precipitates among grains were observed and therefore the crack was supposed easily to occur because the intermetallic compounds and precipitates were fragile among
Liquid
AlFe(Mn)
T=888K
T=903K
T=830K
Mg
2
Si
AlFeSi
Al
5Cu
2Mg
8Si
AlFeSi
β
β
Mg
2Si
T=805K
a)
b)
c)
d)
Fig. 7 Micrographs quenched from several temperatures: a); 903 K, b); 888 K, c); 830 K and d); 805 K.
760 780 800 820 840 860 880 900 920 940
0 0.1 0.2 0.3 0.4 0.5 0.6 0.7 0.8 0.9 1 Solid mass fraction
Temperature, T/K Calculated from specific heat curve
Calculated by Gulliver-Scheil's condition
Aluminum FCC
Mg2Si
Al5Cu2Mg8Si
α-AlFeMn
Al8FeMg3Si6
β-AlFeSi
Al7Cu2Fe
Fig. 6 Comparison between solid fractions obtained by the
Gulliver-Scheil’s condition and by the specific heat curve.
0 2 4 6 8 10 12
760 780 800 820 840 860 880 900 920 940
Temperature, T /K
Solid mass fraction
0 0.1 0.2 0.3 0.4 0.5 0.6 0.7 0.8 0.9 1
Tensile strength,
σ
/MPa
Elongation, (%)
Tensile strength Elongation, % Solid Fraction
0.69 0.77
ZST ZDT
Fig. 8 Relation of tensile strength, breaking elongation, solid fraction and
[image:4.595.56.284.72.226.2] [image:4.595.314.539.76.207.2] [image:4.595.102.497.281.584.2]grains. On the other hand, ordinary dimple pattern is observed at the pole surface (1 mm from surface of the billet), so it is considered that the surface crack is caused by
forced fracture in the pole surface.
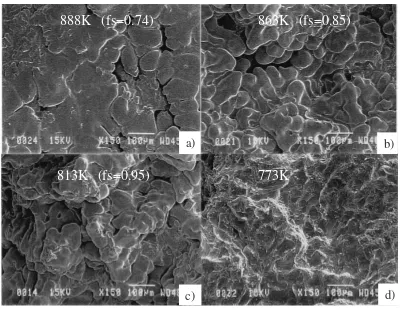
The observation result of fracture surfaces after tensile test at 888, 863, 813 and 773 K are shown in Fig. 10. Fracture
Fig. 9 Photographs of crack section of billet.
888K
773K
863K (fs=0.85)
813K (fs=0.95)
a)
b)
c)
d)
[image:5.595.88.512.72.362.2](fs=0.74)
[image:5.595.98.499.394.704.2]surfaces except at 773 K have a rupture structure where intergranular fractures are observed with remaining liquid around interdendritic regions in mushy zone. The fracture surface tends to flatten with the increase in solid fraction, and it is observed that the one after solidification (at 773 K) shows a typical ductile fracture surface. It is can be seen that the fracture surface in DC billet, of both hot tear and ductile fracture, are well reproduced with using the tensile test. Consequently, it is considered that the tensile test during solidification is capable of simulating hot tear behavior in DC billets.
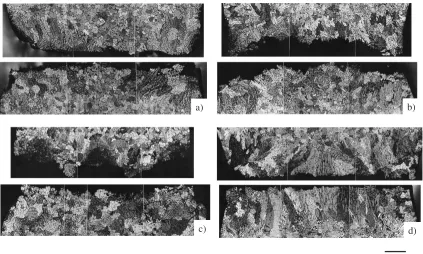
Macrostructure of the crack fracture surfaces is shown in Fig. 11, in which upper and lower photos in each set of photograph such as a), b), c) and d) correspond to upper and lower fractured surfaces. In case of solid fraction of 0.74 (888 K), the deformation of crystal grains by tensile stress is not observed in the central area of the sample, since the temperature is between ZST and ZDT. However, the deformation is observed in the surface layer. This is considered mainly due to two reasons; 1) the temperature difference between central and surface parts of the sample, which happened inevitably. 2) localization of deformation. In case of solid fraction of 0.91 (833 K), the deformation of crystal grains was observed both in the center and surface. When the solid fraction is reached 1.0 (783 K), crystal grains near the fracture surface are greatly deformed and it becomes several times of usual grain size compared with ones tested on other higher temperatures. The grain size near the fracture surface tends to increase with the increase in solid fraction, as it is shown in Fig. 11, since the residual liquid between grain boundaries which prevents grain growth25)decreases with the decrease in temperature.
4. Conclusions
In this study, tensile tests in the mushy zone of the high-strength Al-Mg-Si alloy were carried out. By comparing the breaking section of the tensile testing sample with breaking section of DC billet, the capability of this high temperature tensile test was examined. To interpret the relation between mechanical properties and solidification sequence, solid-ification path was evaluated, using the commercial software package of Thermo-Calc. The main results obtained are as follows:
(1) ZST and ZDT are 893 and 883 K at which the cor-responding solid fractions were 0.69 and 0.77, respec-tively.
(2) It is confirmed that the breaking sections of the tensile testing sample and DC billet had same rupture structure where intergranular fracture was observed. Conse-quently, it was considered that breaking elongation and breaking strength were obtained by this tensile test can be used as one of the criteria of casting crack. (3) The grain size near the fracture surface tended to
increase by the deformation strain, since the residual liquid decreased between grain boundaries with the decreasing tensile test temperature.
(4) Agreement between the experimental and calculated results for crystallized phases and their sequence was well good.
REFERENCES
1) D. G. C. Lee: J. of the Inst. Met.72(1946) 343–364.
2) S. A. Metz and M. C. Flemings: AFS Trans.77(1969) 329–334.
3) D. P. Williams: Int. J. Fracture.9(1973) 63–68.
1mm
a) b)
[image:6.595.87.510.70.324.2]c) d)
Fig. 11 Observation of macro structure at breaking section of tensile testing sample: a); T¼888K (fs¼0:74), b); T¼863K
4) M. Kubota and S. Kitaoka: AFS Trans.81(1973) 424–429.
5) T. W. Clyne and G. J. Davies: British Foundryman.74(1981) 65–73.
6) J. A. Spittle and A. A. Cushway: Metals Technology10(1983) 6–13.
7) W. Schneider and E. K. Jensen:Light Metals 1990, ed. by Christian and
M. Bicket, (TMS, Warrendale, Pennsylvania, 1990) pp. 931–936.
8) S. Upaddhya and S. Chandra:Light Metals 1995, ed. by Tames W.
Evans, (TMS, Warrendale, Pennsylvania, 1995) pp. 1101–1106.
9) M. Rappaz, J. M. Drezet and M. Gremaud: Metall. Trans. A30A(1999)
449–455.
10) H. Nagaumi, K. Aoki, K. Komatsu and N. Hagisawa: Mater. Sci. Forum
331–337(2000) 173–178.
11) G. Shin, T. Suzuki and T. Umeda: Tetsu to Hagane78(1992) 275–281.
12) A. Giron, M. G. Chu and H. Yu:Light Metals 2000, Ed. R. D. Peterson,
(TMS, Warrendale, Pennsylvania, 2000) pp. 579–584.
13) B. Magnin, L. Maenner, L. Katgerman and S. Engler: Mater. Sci.
Forum217–222(1996) 1209–1214.
14) A. K. Dahle and L. Arnberg: JOM48(1996) March, pp. 34–37.
15) M. G. Chu and D. A. Granger: Proceedings of the 4th Decennial International Conference on Solidification Processing, Sheffield, July 1997, ed. by J. Beech and H. Jones, Department of Engineering Materials, University of Sheffield (1997) pp. 198–202.
16) T. Sumitomo, D. H. StJohn and T. Steinberg: Mater. Sci. and Eng. A
A289(2000) 18–29.
17) L. Zhao, Baoyin, Na Wang, V. Sahajwalla and R. D. Pehlke: Inter. J. of
Cast Met. Res.13(2000) 167–174.
18) S. Instone, D. StJohn and J. Grandfield: Inter. J. of Cast Met. Res.13
(2000) 441–456.
19) D. J. Lahaie and M. Bouchard: Metall. Mater. Trans. B32B(2001)
697–705.
20) H. Nagaumi and T. Umeda: Journal of Light Metals2(2002) 161–167.
21) H. Nagaumi: J. Jpn. Inst. Light Met.50(2000) 49–53.
22) H. Nagaumi, S. Suzuki, T. Okane and T. Umeda: Mater. Trans.47
(2006) 2821–2827.
23) P. Suvanchai, T. Okane and T. Umeda: Proceedings of the 4th Decennial International Conference on Solidification Processing, Sheffield, July 1997, ed. by J. Beech and H. Jones, Department of Engineering Materials, University of Sheffield (1997) pp. 190–194.
24) H. Nagaumi and T. Umeda: Mater. Sci. Forum426–432(2003) 465–
470.
25) T. Maruyama, K. Matsuura, M. Kudoh and Y. Itoh: Tetsu-to-Hagane85