Munich Personal RePEc Archive
Deception and Reception: The Behavior
of Information Providers and Users
Sheremeta, Roman and Shields, Timothy
20 March 2017
Deception and Reception:
The Behavior of Information Providers and Users
Roman M. Sheremeta a,b Timothy W. Shields b,c,*
a Weatherhead School of Management, Case Western Reserve University, 11119 Bellflower Road, Cleveland, OH 44106
b Economic Science Institute, Chapman University One University Drive, Orange, CA 92866, USA
c Argyros School of Business and Economics, Chapman University, One University Drive, Orange, CA 92866
20 March 2017
Abstract
We investigate the behavior of information providers (underwriters) and users (investors) in a controlled laboratory experiment where underwriters have incentives to deceive and investors have incentives to avoid deception. Participants play simultaneously as underwriters and investors in one-shot information transmission games. The results of our experiment show a significant proportion of both deceptive and non-deceptive underwriters. Despite the presence of deceptive underwriters, investors are receptive to underwriters’ reports, gleaning information content, albeit overly optimistic. Within our sample, deception by underwriters and reception by investors are the most profitable strategies. Moreover, participants who send deceptive reports to investors, but at the same time are receptive to reports of underwriters, earn the highest payoffs. These results call into question the characterization of duped investors being irrational.
Keywords: experiment, strategic communication, risk, deception, investment advice
* Corresponding author: [email protected]
1. Introduction
Placing trust in experts who have superior and private information is nearly unavoidable.
Automotive mechanics advise repairs, attorneys advise whether to pursue legal action, doctors
recommend medical procedures, and economists weigh-in on proposed financial reforms. These
experts’ private information is not necessarily contractible or verifiable. Additionally, they have
incentives to act deceptively by charging for superfluous repairs (Olivarez-Giles, 2010; Grover et
al., 2013), billing plaintiffs for lawsuits which have little probability of legal remedy, performing
unnecessary medical procedures (Johnson & Rehavi, 2016), or enacting policies that benefit their
employers (Carrick-Hagenbarth & Epstein, 2012).
Conflicts of interest exist in the financial sector where analysts have incentives to earn
trading commissions, accountants have incentives to bill for allowable non-audit services, and
underwriters have incentives to raise desired capital during public offerings. For example, media
reports of the 2012 initial public offering of Facebook suggested that investors were led astray by
underwriters who set the share price too high given the underwriters’ private unfavorable
information (which was purportedly disclosed to some institutional investors). The case is not
uncommon in that other research has documented that investors are misled when there are
conflicts of interest. Michaely and Womack (1999) attributed the documented bias to conflicts of
interest between the analysts and investors, citing both brokerage commissions and the
investment banking business as possible sources. Other research also suggests the bias in
analysts’ reporting is related to conflicts of interests (Cowen et al., 2006; Bradshaw et al., 2013).
Malmendier and Shanthikumar (2007) and De Franco and Lu (2007) found evidence of
differences in the reaction of investors, suggesting that some investors were misled by deceptive
The observed behaviors, deception and reception, are inescapably intertwined. Deception
is not possible without a dupable listener, as the very act of deceiving dictates that another was
misled. But at the same time, reception is not warranted if deception is certain. If there is no
information content in the provider’s message, there is no need to listen.
This apparent paradox, simultaneous deceptive and receptive behavior, is the motivation
for this research. Using the typology of underwriting, where an underwriter is informed and an
investor is information seeking, we investigate if the aforementioned examples are of duped
investors, or simply the negative outcomes of gambles taken by rational investors.
To answer these questions, we design an experiment where participants act
simultaneously as an informed underwriter and an information seeking investor in one-shot
information transmission games. The underwriter is privately informed of the state of nature.
Both the underwriter’s and investor’s payoffs depend upon the state and the investor’s action.
The underwriter’s payoff is greatest when investment is made regardless whether the state is
good or bad. The investor’s payoff is greatest when investment is made and the state is good.
The inherent conflicts of interest provide economic incentives for the underwriter to deceive the
investor, and incentives for the investor to avoid deception.
To distinguish behavior based on gleaned information versus distributional preferences,
we conducted two treatments. In the first treatment (labeled REAL), participants’ payoffs depend
upon their own choices and those of other participants in the same experimental session. In the
second treatment (labeled ROBOT), participants’ payoffs depend upon their own choices and a
‘robot’, so that participants’ decisions could not affect others’ payoffs.
Our findings suggest that only a minority of investors is gullible and optimistic. Because
the state of the nature), investing conditional upon gleaning information from underwriters’
reports results in greater profits than not investing. Furthermore, participants who invest, despite
not truthfully revealing their private information as underwriters, earn the greatest economic
profit. Ironically, participants who practice deception and reception both yield larger profit.
Our findings provide new evidence for the existence of moral individuals that reject
economic incentives to deceive (Hurkens & Kartik, 2009; Gneezy et al., 2013). Furthermore, we
provide evidence that only a minority of investors is overly optimistic about the proportion of
moral individuals in the economy. Our design allows us to distinguish this optimism from biases
in value estimation and risk preferences. We provide evidence that behavior that might be
characterized as investor’s gullibility can be a rational response, earning the investor economic
profits. Our research also provides a methodological contribution by introducing a design that
can provide insights into the determinants of reported biases related to individual’s ability to
entertain the psychological perspectives of others.
2. Methods
2.1. Background
If we assume underwriters (senders) and investors (receivers) have no intrinsic cost of
lying, and the preferences of underwriters and investors diverge, the equilibrium theory of
Crawford and Sobel (1982) predicts underwriters will not transmit all information, but investors
cannot be described as misled, as investors should unravel the underwriters’ intensions to
misrepresent information. Nonetheless, previous experimental studies show that while
underwriters tend to adopt deceptive reporting practices, they transmit more information
Dickhaut et al., 2003; Cai & Wang, 2006). Sanchez-Pages and Vorsatz (2007) found evidence
that one reason for underwriters’ behavior is the existence of moral individuals who reject
economic incentives to mislead in favor of telling the truth. Other researchers have suggested
that some individuals are simply lying-averse (Gneezy, 2005; Hurkens & Kartik, 2009),
guilt-averse (Charness & Dufwenberg, 2006), sensitive to financial gains (Gibson et al., 2013;
Ismayilov & Potters, 2013), justifiability (Erat, 2013; Erat & Gneezy, 2011), or motivated by a
combination of factors such as financial gains, justifiability and a personal utility of honesty
(Sakamoto et al., 2013). Another common finding from experimental literature is that investors
rely more on the underwriters’ reports than would be expected based on theoretical predictions
(Kawagoe & Takizawa, 2008; Sanchez-Pages & Vorsatz, 2009). Deception is successful because
investors appear receptive.
In summary, both empirical and experimental evidence suggest that even while
underwriters tend to adopt deceptive reporting practices, investors act as if they glean
information from the underwriters’ reports. Furthermore, prior research suggests that even when
users of information are aware of conflicts of interests, they fail to discount reports enough
(Dickhaut et al., 2003; Cai & Wang, 2006; Forsythe et al., 1999; Cain et al., 2005, 2011).
Excessive credibility is observed not only in underwriter and investor settings, but also in
prisoner’s dilemmas (Serra-Garcia et al., 2013), trust games (Charness & Dufwenberg, 2006) and
under repeated play (Blume, 2001).
If participants believe others’ behavior is the same as their own, then participants in the
role of underwriter who reveals the state of nature truthfully would invest in the role of investor.
Similarly, those who deceive in the role of underwriter would not invest. Other research suggests
onto the behavior of others (Ross et al., 1977; Krueger & Clement, 1994; Epley et al., 2004;
Irlenbusch & Ter Meer, 2013). However, if participants are aware that some fraction of
underwriters reveals private information as in the aforementioned studies, an investment strategy
conditional upon underwriters’ reports might lead to higher profits. That is, a rational participant,
who is deceptive in the role of underwriter, might appear trusting (receptive) in the role of
investor. Next, we describe the experimental tasks that allow us to tease apart rational from
dupable investors.
2.2. Participants
The experiment was conducted at the Economic Science Institute. 112 participants were
recruited electronically from a standard pool consisting primarily of undergraduate students and
randomly assigned into one of two treatments. The student population was 11.5% Hispanic,
8.5% Asian, 2% Black, 65% Caucasian, 4% Multiracial, and 9% others. The average age of the
59 female, 49 male, and 4 transgender participants was approximately 21 years old (M = 20.15,
SD = 3.50).
2.3. Information Transmission Game
The experimental design is based on an information transmission game. The game
proceeds as follows. In the first stage, the underwriter receives a private perfect signal about the
true state of nature. It is public knowledge that the state of the nature is equally likely to be good
(𝐺) or bad (𝐵). In the second stage, the underwriter releases a report 𝐺̂ or 𝐵̂ regarding the state of
the nature after receiving her signal. After receiving the report, the investor can invest his cash
the state is good. If the investor decides not to invest he retains his endowment. The underwriter
earns compensation 𝜆 > 0 if the investor decides to invest and nothing otherwise. After the
investor makes his decision, the true state of nature is revealed and both players receive their
payoffs based on the state and depending on the investment decision of the investor.
Assuming homogenous and selfish preferences, there is either always, or never,
investment depending upon the parameter values. Since it is always in the underwriter’s interest
to persuade the investor to invest, she has an incentive to deceive the investor by sending report
𝐺̂ when the true state of nature is bad. Examining only pure strategies, it is trivial to prove
truthful reporting cannot be sustained as an equilibrium. Alternatively, imagine the conditions
needed for a mixed reporting strategy: the underwriter must be indifferent to reporting 𝐺̂ or𝐵̂,
which dictates the investor use the same investing strategy for both reports. The equilibrium
investment strategy is to always or never invest and the equilibrium reporting strategy is to
destroy information content such that the investor is indifferent between reports received (A
formal proof is available from the authors upon request). Anticipating deception, a risk-neutral
investor ignores the underwriter’s report and invests only if 𝜋𝐺/2 + 𝜋𝐵/2 ≥ 𝜂.
While similar to some existing studies (Forsythe et al., 1999; Dickhaut et al., 2003;
Gneezy, 2005; Hurkens & Kartik, 2009; Sheremeta & Shields, 2013) our design differs in
several important respects. In our experiment, incentives between the investor and underwriter
are sometimes aligned (i.e., each party would prefer investment when the state is good).
Participants are always informed of the incentives for all roles. An underwriter who saw an
unfavorable state but reports a favorable state is always revealed to the investor ex-post, unlike
2.4. Measures of Risk
To infer whether investors extract information content from underwriters’ reports we
measured investor’s risk preferences. In addition to varying the ex-ante expected payoff of
investors across four conditions (Table 1), we also asked participants to make decisions in four
gambles that are payoff-equivalent to the information transmission game.
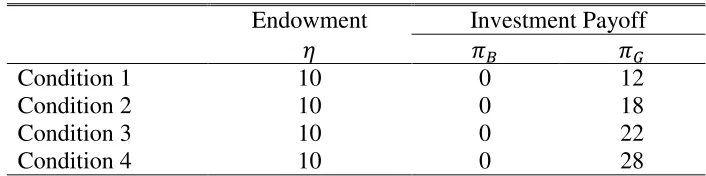
Table 1 shows the four conditions of the information transmission game in the
experiment. In all conditions, we set the investor’s endowment 𝜂 = $10, the bad state-based
payoff 𝜋𝐵 = $0 and the underwriter’s compensation 𝜆 = $13. Holding 𝜋𝐵and 𝜂 fixed, we
manipulate 𝜋𝐺 over four conditions (i.e., $12, $18, $22, $28) such that 𝜋𝐺 /2 + 𝜋𝐵/2 < 𝜂 in
conditions 1 and 2 and 𝜋𝐺/2 + 𝜋𝐵/2 > 𝜂 in conditions 3 and 4. Thus a risk-neutral investor
will invest for conditions 3 and 4 even if he believes the underwriter’s report contains no
information.
Based on Gneezy (2005), Hurkens and Kartik (2009) and Sheremeta and Shields (2013),
we conjecture most participants will use deceptive underwriter strategies. Our values 𝜋𝐺 are
constructed such that if a participant conjectures all underwriters use deceptive reporting
strategies, that participant might invest in conditions 3 and 4. But if the participant conjectures a
majority, but not all, of the underwriters use deceptive reporting strategies, that participant might
invest in conditions 2 through 4. However, if the participant conjectures only a minority, or none,
of the underwriters use deceptive reporting strategies, that participant might invest in all
conditions.
We use four gambles to elicit participants’ risk preferences. Assuming there is no
information content in the underwriter’s report (i.e. the probability of the state is good is 0.5), the
game reported in Table 1. In each gamble, participants are asked to state whether they prefer a
safe option (equivalent to 𝜂) with probability one, or a risky option where the probability of the
high value (equivalent to 𝜋𝐺) and the low value (equivalent to 𝜋𝐵) are equal.
2.5. Controlling for Distributional Preferences
To further infer whether choices are based upon participants’ anticipation of others’
choices, versus based upon distributional preferences (i.e., other-regarding behavior) we used
two treatments. In the first treatment, which we label the REAL treatment, participants were
paired with other participants in the same session. Thus, participants’ choices in the REAL
treatment affected the payoffs of other participants. In the second treatment, which we label the
ROBOT treatment, participants’ payoffs depended upon randomly selected historical choices of
participants who were in the REAL treatment. Thus, participants’ choices in the ROBOT
treatment did not affect payoffs of other participants.
2.6. Benefits of the Design
To ascertain whether investors glean information content from underwriter reports, we
compare investment and gambling behavior, which prior research suggests is linked (Jadlow &
Mowen, 2010). By controlling for risk preferences, we can ascertain whether investors are
gleaning information content from underwriters’ report. By manipulating the presence of a
partner between treatments, we can ascertain if choices are driven by distributional preferences.1
1 Comparison across treatments allows us to separate preferences for others’ payoffs from subjective beliefs of
By simultaneously acting as underwriters and investors, we capture participant’s strategy on
multiple parameters before giving feedback. As such, we can ascertain whether the elicited
investment strategy is consistent with the same participant’s underwriting strategy without the
complications of controlling for past outcomes, order effects, or learning about others’ strategies.
In the one-shot games of Gneezy (2005) and Sheremeta and Shields (2013) it is difficult
to assess if the users of information are optimistic of the truthfulness of reports, as the behavior
of an overly optimistic investor is identical to an investor who knows the distribution of
underwriters’ behavior. Our design measures a participant’s responses over multiple parameters,
to tease out whether investors are optimistic or not, but at the same time does not give feedback
between responses. The design allows us to ascertain whether investment is based upon risk
preferences or the result of overly optimistic and gullible behavior.2
Eliciting participants’ strategies in two roles simultaneously is a trade-off between the
objectives of negating repeated-game effects versus the possibility that participants may have
erroneous impression they are playing against themselves. We tried to minimize the later effects
by explicitly telling participants that they would be paired with other participants and that the
computer would randomly select the role and the state of nature for payment. The use of the
strategy method also may induce qualitative different behavior than the direct response method
(Brandts & Charness, 2011). Although the above are legitimate concerns, we found that
participants’ behavior in our experiment is comparable to that in Gneezy (2005) and Hurkens and
Kartik (2009).
2 Other researchers examining projection-bias (Krueger & Clement, 1994; Epley et al., 2004), perspective-bias
2.7. Procedures
Participants interacted with each other anonymously over a local computer network. The
experiment was programmed and conducted using z-Tree (Fischbacher, 2007). The computers
were placed within individual cubicles in such a way that all participants could only view their
own computer screen.
Each session lasted approximately fifty-five minutes and consisted of 20 to 24
participants. At the beginning of each section, an experimenter read the instructions aloud while
each participant followed along with their own copy of the instructions. The instructions
explained the experimental procedures, payoffs, and information structures used in the
experiment (instructions available in the Appendix). While going over the instructions,
participants were asked to write down their answers to several quiz questions to ensure that they
understand the instructions. Participants’ answers remained confidential to other participants.
The experimenter reviewed the correct answers with each participant privately. During and after
the instructions were read, participants were prompted to ask the experimenter in private any
questions regarding the experimental procedures. While in this manuscript we use the terms
`Good’, `Bad’, `Underwriter’, `Investor’, etc., we used neutral terms in the experiment to
minimize experimenter demands and unintended normative behavior.
In the first part of the experiment, each participant simultaneously played both roles of
underwriter and investor in all four conditions (Table 1) by choosing what report to send for each
possible private perfect signal and whether to invest for each possible underwriter’s report. That
is, for both values of the private signal, the underwriter made a binary choice to reveal the signal
truthfully or not. For each possible report, the investor made a binary choice whether to invest
anonymously paired with another participant in the REAL treatment, or assigned a past
participant’s historical choices in the ROBOT treatment. The computer randomly selected the
setting, the role for payment and the state of nature, and determined an outcome for each
participant. However, the outcome was not presented until the very end of the experiment, after
the second part was completed.
In the second part of the experiment, participants were asked to state whether they prefer
a safe or risky option in four gambles equivalent to the four conditions in the information
transmission game before knowing the outcome from the first part. Participants were not aware
of this task until after they made choices in the first part of the experiment. The outcomes of any
choices were not given until the final payment stage in order to minimize any wealth or hedging
effects. At the end of the experiment, each participant was paid a $7 show-up fee, the payoffs
from one randomly selected condition in the first part and one randomly selected gamble in the
second part of the experiment. On average participants earned $18 in addition to the show-up
fee.
3. Results
We find no significant differences between the sessions of a treatment. Additionally, we
find no significant differences between genders. Therefore, we report the combined results. For
all hypothesis tests, we use the choices for each participant, yielding 64 independent
observations in the REAL treatment and 48 independent observations in the ROBOT treatment.
3.1. Decisions in Information Transmission Games
In the role of underwriter 20.3% of participants in the REAL treatment and 14.6% of
participants in the ROBOT treatment always reveal their private information regarding the true
state. The difference between treatments is not significant (Mann-Whitney, Z=0.70, p=.44). As
shown in Figure 1, most participants report 𝐺̂ when the state is good, but also report 𝐺̂ when the
state is bad. The practice of deception is consistent across conditions; we find no significant
differences in underwriters’ behavior within participants across conditions (Combined: Z =0.00,
p=1.00; REAL: Z=0.81, p=.42; ROBOT: Z=0.57, p=.56).
Result 1: There is a significant proportion of both deceptive and non-deceptive
underwriters.
In the role of investor, 92.2% of participants in the REAL treatment and 91.7% of
participants in the ROBOT treatment invest conditional upon a report 𝐺̂ in at least one of the four
conditions.3 The difference between treatments is not significant (Mann-Whitney, Z=0.10,
p=.92). As shown in Figure 2, a minority of participants also invests when report is 𝐵̂ in at least
one condition. Mann-Whitney test suggests that those participants who never reveal the state is B
tend to invest more often when report is 𝐵̂ than those who reveal the state is B one or more times
(Z=1.62, p=.10). These participants may not believe a report 𝐵̂ will be sent, as 77% of those who
do invest given a report 𝐵̂ never reveal the state is 𝐵 in the role of underwriter. Investment
conditioned upon each report is increasing over conditions, from 62.5% of investors when 𝜋𝐺 =
$12 (65.6% in REAL; 58.3% in ROBOT), to 89.3% of investors when 𝜋𝐺 = $28 (90.6% in
REAL; 87.5% in ROBOT). The increase from condition 1 to condition 4 is significant
3 There are several potential explanations for why not all participants send a truthful report when the state is good.
(Combined: Z=5.14, p<.01; REAL: Z=3.77, p<.01; ROBOT: Z=3.55, p<.01). Since we find no
differences between treatments, in the following sections we explore whether this increase is
solely due to higher expected return on investment by examining decisions made in gambles.
3.2. Decisions in Gambles
In order to ascertain whether participants glean information content from the
underwriters’ reports or simply invest based on the investment’s fundamental risk, we compare
decisions made in gambles to the investment choices. If there is no perceived information
content in the underwriters’ reports, the exercises are identical. The choices are shown in Figure
3. In all conditions the number of participants investing when the report is 𝐺̂ exceeds the number
of participants choosing the risky over safe gamble.
Comparing investment conditioned on risk choices, 60.1% of participants invested
despite choosing the safe option in the equivalent gamble, in at least one condition (59.4% in
REAL; 62.5% in ROBOT). The difference between treatments is not significant (Mann-Whitney,
Z=0.33, p=.74). Participants’ number of risky choices is less than the number of investment
choices (Combined: Z=7.67, p<.01; REAL: Z= 5.95, p<.01; ROBOT: Z= 4.85, p<.01). This
suggests that investors infer information content from underwriters’ reports.4
Result 2: Investors glean information content from underwriters’ reports.
4 Given Bohnet and Zeckhauser (2004) find that individuals state minimum acceptable probabilities of a higher
3.3. Investors’ Optimism
To provide evidence that perceived information content is optimistic, we examine
log-likelihood models of the data, focusing on the investor’s choices. This allows us to examine risk
preferences in the presence and absence of strategic investment choices, and to capture a
measure of perceived information content. As there are no differences in behavior between
treatments, we combined treatments for this analysis.5
We model investor’s utility of payoff as the constant absolute risk aversion (CARA)
utility function 𝑈(𝜋) = 1 − 𝑒−𝜌𝜋, where 𝜌 captures risk preferences and 𝜋 represents the
payoff.6 The probability that an investor elects the risky option (0.5 chance of receiving 𝜋𝑘 =
{$12, $18, $22, $28}) versus the safe option (𝜂 = $10) is 𝑃𝑔(𝜋𝑘, 𝜆, 𝜌), where 𝜆 is a precision
parameter. Following Wilcox (2011), we use a logit-type probability function scaled by the
difference between the maximum and the minimum utility value of the specific choice:
𝑃𝑔(𝜋𝑘, 𝜆, 𝜌) = 1+exp[− 𝜆 1
𝑈(𝜋𝑘)−𝑈(0)(12𝑈(𝜋𝑘)−𝑈(10))]
(1)
The log-likelihood of the participants’ choice probabilities over the gambles, 𝑋, is given
by:
𝐿𝐿(𝜆, 𝜌|𝑋) = ∑𝑖=1112ln ∏4𝑘=1(𝑥𝑘𝑖𝑃𝑔(𝜋𝑘, 𝜆, 𝜌) + (1 − 𝑥𝑘𝑖) (1 − 𝑃𝑔(𝜋𝑘, 𝜆, 𝜌))) (2)
where 𝑥𝑘𝑖 is 1 if participant i chose the risky gamble k over the safe option and 0 otherwise.
Let 𝑧𝑘 be empirically observed probability that the state is good given the underwriters’
report is 𝐺 for condition 𝑘. We model investor’s subjective probability that the state is good
5 Running the analysis with only observations from the REAL treatment yields similar results. Estimation results are
available upon request. Modeling investor utility using other functional forms, such as (𝜋1−𝜌− 1)/(1 − 𝜌) or
(𝜋 + 0.1)1−𝜌− 0.11−𝜌, yields comparable conclusions.
6 Results are robust to using other utility functions allowing risk aversion. Estimation results are available upon
(given that the underwriter’s report is 𝐺) as 𝑃𝑠(𝜋𝑘, 𝛽) = 𝐹(𝑧𝑘; 𝛼, 𝛽), where 𝐹(.) is the
cumulative density function of the Beta distribution symmetric about one-half where 𝛼 = 𝛽 > 0.
The probability that a player invests given a report 𝐺 is:
𝑃𝑡(𝜋𝑘, 𝜆, 𝜌) =1+exp[− 𝜆 1
𝑈(𝜋𝑘)−𝑈(0)(𝑃𝑠(𝜋𝑘,𝛽)𝑈(𝜋𝑘)−𝑈(10))]
(3)
The log-likelihood of the participants’ choice probabilities over the gambles, 𝑋, and
choice probabilities over investment choices, 𝑌, is given by:
𝐿𝐿(𝜆, 𝜌, 𝛽|𝑋, 𝑌) = ∑112𝑖=1ln [∏4𝑘=1(𝑥𝑘𝑖𝑃𝑔(𝜋𝑘, 𝜆, 𝜌) + (1 − 𝑥𝑘𝑖) (1– 𝑃𝑔(𝜋𝑘, 𝜆, 𝜌)))×
∏4𝑘=1(𝑦𝑘𝑖𝑃𝑡(𝜋𝑘, 𝜆, 𝜌, 𝛽) + (1 − 𝑦𝑘𝑖) (1– 𝑃𝑡(𝜋𝑘, 𝜆, 𝜌, 𝛽)))]
(4)
where 𝑦𝑘𝑖 is 1 if participant i choose to invest in condition k and 0 otherwise.
The estimation results of log-likelihood functions (2) and (4) shown in Table 2 support
the intuition of the prior section: investment choices are the result of subjective beliefs of others’
reporting strategies and not only of task specific risk preferences. The measure for risk
preferences 𝜌 is similar when examining only risk choices or all choices. Moreover, the values of
𝜌 given by the two models are not significantly different from each other. Therefore, we argue
that the average decision to invest cannot be only due to risk preferences (i.e., gambling), as risk
preferences are stable over both models. Rather participants appear to have optimistic beliefs of
underwriters’ honesty, inferring excessive information content from underwriters’ reports.
To illustrate the degree of optimism, we plot the subjective probability function 𝑃𝑠(𝜋, 𝛽)
at different values of 𝛽 in Figure 4. When 𝛽 → 0 the probability function collapses to 0.5: the
prior probability that the state is good and the report has no information content. When, 𝛽 = 1
the probability function reflects investors having perfect beliefs of underwriters’ reporting
∞ the probability function is either one or zero. Given that the observed probability in our
experiment, 𝑧𝑘, is always greater than 0.5 (Table 3), a 𝛽 value less than one can be interpreted as
pessimism and a value greater than one as optimism. The fitted value is 1.789, indicating that
investors have optimistic beliefs; the subjective beliefs on average are 8 percent higher than
observed behavior. The fit of the model given by equation (4) using perfect beliefs (i.e, 𝛽 = 1)
yields a log-likelihood fit significantly worse than the fit allowing subjective beliefs to be
pessimistic (χ2(1) = 6.49, p=.01).
Participants tend to invest even in the low expected value conditions. For example, the
majority invest in condition 1 (62.5% conditional upon report 𝐺̂) but the majority of
underwriters’ do not reveal the unfavorable state in condition 1 (28.6%). Combined with the
estimation results of the log-likelihood model, we find investors, on a whole, are optimistic.
Result 3: Investors are overly optimistic of underwriters’ truthful reporting.
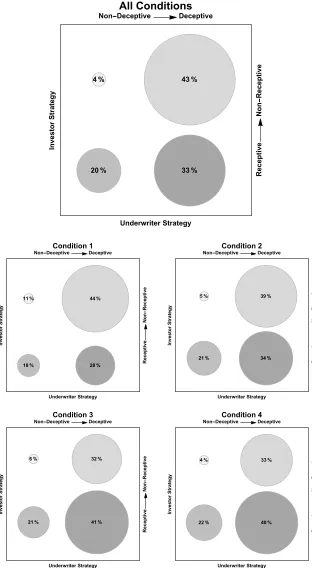
3.4. Joint Behavior
One advantage of our design is that all participants make their decisions both as
underwriters and as investors. In Figure 5 participants are classified as `non-deceptive’ if in the
role of underwriter they report 𝐺̂ if the state is good in at least three of four conditions and
reported 𝐵̂ when the state is bad in at least three of four conditions. Otherwise the classification
is `deceptive’. Correspondingly, participants are classified as `receptive’ if in the role of investor
they invest conditional on a report 𝐺̂ in at least three of four conditions and do not invest
conditional on a report 𝐵̂ in at least three of four conditions, else the classification is ‘
Akin to Irlenbusch and Ter Meer (2013) we find behavior is consistent with theories of
projection bias. The number of conditions where a participant reveals the state is B is positively
correlated with the number of investments conditional on the report 𝐺̂ (Spearman 𝜌 = 0.2453, p <
.01). A Mann-Whitney test shows that the participants classified as `non-deceptive’ invest
significantly more often (M=3.74, Mdn=4, N=27) than those classified as `deceptive’ (M=2.91,
Mdn=3, N=85), Z = 2.86, p < .01. Nonetheless, we find a large proportion of participants are
classified as deceptive yet receptive of others’ reports. That is, the participant’s choice as an
investor is not the best response to his or her own behavior as an underwriter (those participants
classified in the upper left and lower right quadrants of Figure 5). This observation is confirmed
by statistical analysis where the null hypothesis that behavior is consistent over roles is rejected
(Z=4.93, p<.01).
Result 4: Participants’ investment strategy is not always a best response to their own
reporting strategy.
3.5. Comparison of Payoffs
As previously discussed, prior research shows that participants reveal more information
concerning the true state of nature than predicted. Assume that participants are aware of this fact.
There is some fraction, 𝛼, of underwriters who are `non-deceptive’, i.e., they reveal a bad state
despite economic incentives not to. The remainder, 1- 𝛼, is `deceptive’ and always report that the
state is good. First we conjecture this to be the reporting strategy. If 𝛼 > 0, then it turns out that
this reporting strategy weakly dominates randomizing between reports and as such the conjecture
is confirmed. As a consequence, there is some information content in both reports 𝐺̂ and 𝐵̂.
𝑃𝑟(𝐺|𝐺̂)𝜋𝐺+ 𝑃𝑟(𝐵|𝐺̂)𝜋𝐵. Given 𝜋𝐵 = 0 and the states are equally likely, the expected utility
reduces to 1
2−𝛼𝜋𝐺. The expected utility of not investing is always $10. The only way an
underwriter would report 𝐵̂ is if he/she was non-deceptive and the state was actually B. As such
a report 𝐵̂ is reliable, and there should be no investment.7
If investors believe there are enough participants who are non-deceptive (i.e., 𝛼 is high
enough), then investment increases investors’ expected utility. For example, when 𝛼 is 1/5 and
𝜋𝐺is $18, the expected utility to a risk neutral agent from investing is equal to that of not
investing. In our experiment 17.6% of participants always revealed the state. For this parameter
value (𝜋𝐺 is $18), it is the best response for a risk neutral deceptive participant not to use an
investment strategy that is a best respond to his/her own reporting strategy.
Using the classification in the prior section, we find 19.6% of participants are
deceptive and receptive, 33.0% are deceptive yet receptive, and 42.9% are deceptive and
receptive (see Figure 5). The remaining 4.45% of participants are deceptive yet
non-receptive.
How did these types perform economically in our experiment? We compute expected
payoff assuming risk neutrality, which appears reasonable given the risk parameter (𝜌) estimates
7 A framework of hierarchical thinking is also consistent with the observed behavior, albeit this requires more
from the log-likelihood models. The calculation of the expected payoff of an underwriter uses
the participant’s reporting strategy and all other participants’ investing strategies. Similarly, the
calculation of the expected payoff of an investor uses the participant’s investing strategy and all
other participants’ reporting strategies. A Mann-Whitney test verifies that the expected payoff of
deceptive underwriters who always report 𝐺̂, summed over all conditions (M=20.82, N=57), is
significantly higher than the payoff of other underwriters (M=17.33, N=55), Z=5.69, p<.01.
The payoff of receptive investors who invest conditional on report 𝐺̂ a majority of the
time, summed over all conditions (M=43.99, N=59), is significantly greater than the payoff of
other investors (M=41.57, N=53), Z=4.99, p<.01. This result is also robust when excluding those
investors who invest condition on report 𝐵̂; Z= 3.18, p<.01. As a consequence, deceptive and
receptive strategies yield the highest economic return. The return is even greater for the subset of
participants who display some level of skepticism and invest only in conditions 2-4 (Mdn=45.66,
N=16) than those who invest in all conditions (Mdn=43.36, N=43), Z=6.18, p<.01.
Result 5: Deceptive underwrites and receptive investors earn the highest payoffs.
4. Discussion and Conclusion
We investigate the behavior of underwriters and investors in a controlled laboratory
experiment where underwriters have incentives to deceive and investors have incentives to avoid
deception. The results of our experiment show a significant proportion of both deceptive and
deceptive underwriters. Those underwriters who are deceptive earn higher profits than
non-deceptive underwriters. Despite the presence of non-deceptive underwriters, investors are receptive to
underwriters’ reports, gleaning information content, albeit investors appear overly optimistic.
akin to an attitude of professional skepticism, investors exhibiting conditional skepticism earn
the greatest profits.
The investors who invest in the projects with lower expected returns (i.e., conditions 1
and 2), on average, earn higher payoffs than those who do not. This is despite the fact that
economic theory predicts the opposite. Investors who invest in at least three of four conditions
clearly earn more than others even though the same participants are not playing a best response
to their own behavior. Their behavior is inconsistent with a projection bias. It is as if some
participants realize that some fraction of the underwriters is honest, and consequently choose to
invest as a best response to such beliefs. In a crude sense, reception pays off, but, ironically so
does deception. Comparing behavior between treatments, it appears that investment behavior is
not a function of distributional concerns (i.e., other-regarding preferences), but a subjective
belief that underwriters are honest ‘enough’ to warrant investment.
The results have an interesting implication for disclosing conflicts of interests in one-shot
events such as underwriting. If disclosure of conflicts of interests is mandated in order to
discipline deceptive behavior, the existence of naturally honest underwriters and consequently,
naturally receptive investors, impedes the disciplinarian intent of disclosure. If informed
investors cannot help but to listen because there are honest underwriters, then the lack of
References
Blume, A. (2001). Evolution of communication with partial common interest. Games and Economic Behavior, 37(1), 79-120.
Blume, A., DeJong, D.V., Kim, Y.G., and Sprinkle, G.B. (1998). Experimental evidence on the evolution of meaning of messages in sender-receiver games. American Economic Review, 88(5), 1323-1340.
Bohnet, I., and Zeckhauser, R. (2004). Trust, risk and betrayal. Journal of Economic Behavior & Organization, 55(4), 467-484.
Bowlin, K.O., Hales, J.W., and Kachelmeier, S.J. (2009). Experimental evidence of how prior experience as an auditor influences managers’ strategic reporting decisions. Review of Accounting Studies, 14(1), 63-87.
Bradshaw, M., Brown, L., and Huang, K. (2013). Do sell-side analysts exhibit differential target price forecasting ability? Review of Accounting Studies, 18, 930-955.
Brandts, J. and Charness, G. (2011). The strategy versus the direct-response method: A first survey of experimental comparisons. Experimental Economics, 14(3), 375-398.
Cai, H. and Wang, J.T.Y. (2006). Overcommunication in strategic information transmission games. Games and Economic Behavior, 56(1), 7-36.
Cain, D.M., Loewenstein, G., and Moore, D.A. (2005). The dirt on coming clean: Perverse effects of disclosing conflicts of interest. Journal of Legal Studies, 34(1), 1-25.
Cain, D.M., Loewenstein, G., and Moore, D.A. (2011). When sunlight fails to disinfect: Understanding the perverse effects of disclosing conflicts of interest. Journal of Consumer Research, 37(5), 836-857.
Carrick-Hagenbarth, J. and Epstein, G.A. (2012). Dangerous interconnectedness: economists’ conflicts of interest, ideology and financial crisis. Cambridge Journal of Economics, 36(1), 43- 63.
Charness, G. and Dufwenberg, M. (2006). Promises and partnership. Econometrica, 74(6), 1579-1601.
Cowen, A., Groysberg, B., and Healy, P. (2006). Which types of analyst firms are more optimistic? Journal of Accounting and Economics, 41(1-2), 119-146.
Crawford, V. and Sobel, J. (1982). Strategic information transmission. Econometrica, 50(6), 1431-1451.
Davis, M.H., Conklin, L., Smith, A., and Luce, C. (1996). Effect of perspective taking on the cognitive representation of persons: A merging of self and other. Journal of Personality and Social Psychology, 70(4), 713-726.
De Franco, G. and Lu, H. (2007). Wealth transfer effects of analysts’ misleading behavior. Journal of Accounting Research, 45(1), 71-110.
Dickhaut, J., Ledyard, M., Mukherji, A., and Sapra, H. (2003). Information management and valuation: an experimental investigation. Games and Economic Behavior, 44, 26-53.
Epley, N. and Gilovich, T. (2006). The anchoring-and-adjustment heuristic: Why the adjustments are insufficient. Psychological Science, 17(4), 311-318.
Epley, N., Keysar, B., Van Boven, L., and Gilovich, T. (2004). Perspective taking as egocentric anchoring and adjustment. Journal of Personality and Social Psychology, 87(3), 327-339. Erat, S. (2013). Avoiding lying: The case of delegated deception. Journal of Economic Behavior
& Organization, 93, 273-278.
Fischbacher, U. (2007). z-Tree: Zurich toolbox for ready-made economic experiments. Experimental Economics, 10(2), 171-178.
Forsythe, R., Lundholm, R., and Rietz, T. (1999). Cheap talk, fraud, and adverse selection in financial markets: Some experimental evidence. Review of Financial Studies, 12(3), 481-518.
Gibson, R., Tanner, C., & Wagner, A. F. (2013). Preferences for truthfulness: Heterogeneity among and within individuals. American Economic Review, 103(1), 532-548.
Gneezy, U. (2005). Deception: The role of consequences. American Economic Review, 95(1), 384-394.
Gneezy, U., Rockenbach, B., and Serra-Garcia, M. (2013). Measuring lying aversion. Journal of Economic Behavior & Organization, 93, 293-300.
Grover, J., Henao, C., and Drechsler, P. (2013). “You were robbed”: NBC4 I-team exposes new “tricks and tactics” at Jiffy Lube stores. NBC4 Los Angeles.
Hoffman, V. B. and Patton, J. M. (2008). Accountability, the dilution effect, and conservatism in auditors’ fraud judgments. Journal of Accounting Research, 35(2), 227-237.
Hurkens, S. and Kartik, N. (2009). Would I lie to you? On social preferences and lying aversion. Experimental Economics, 12(2), 180-192.
Irlenbusch, B. and Ter Meer, J. (2013). Fooling the nice guys: Explaining receiver credulity in a public good game with lying and punishment. Journal of Economic Behavior & Organization, 93, 321-327.
Ismayilov, H. and Potters, J. (2013). Disclosing advisor’s interests neither hurts nor helps. Journal of Economic Behavior & Organization, 93, 314-320.
Jadlow, J.W. and Mowen, J.C. (2010). Comparing the traits of stock market investors and gamblers. Journal of Behavioral Finance, 11(2), 67-81.
Johnson, E.M., & Rehavi, M.M. (2016). Physicians treating physicians: Information and incentives in childbirth. American Economic Journal: Economic Policy, 8(1), 115-141. Kawagoe, T. and Takizawa, H. (2008). Equilibrium refinement vs. level-k analysis: An
experimental study of cheap-talk games with private information. Games and Economic Behavior, 66(1), 238-255.
Krueger, J. and Clement, R.W. (1994). The truly false consensus effect: An ineradicable and egocentric bias in social perception. Journal of Personality and Social Psychology, 67(4), 596-610.
Malmendier, U. and Shanthikumar, D.M. (2007). Are small investors naive about incentives? Journal of Financial Economics, 85(2), 457-489.
Michaely, R. and Womack, K. L. (1999). Conflict of interest and the credibility of underwriter analyst recommendations. Review of Financial Studies, 12(4), 653-686.
Nisbett, R.E., Zukier, H., and Lemley, R.E. (2003). The dilution effect: Nondiagnostic information weakens the implications of diagnostic information. Cognitive Psychology, 13(2), 248-277.
Olivarez-Giles, N. (2010). Owner of 22 Midas auto repair shops settles fraud allegations. Los Angeles Times.
Sakamoto, K., Laine, T., and Farber, I. (2013). Deciding whether to deceive: Determinants of the choice between deceptive and honest communication. Journal of Economic Behavior & Organization, 93, 392-399.
Sanchez-Pages, S. and Vorsatz, M. (2007). An experimental study of truth-telling in a sender-receiver game. Games and Economic Behavior, 61(1), 86-112.
Sanchez-Pages, S. and Vorsatz, M. (2009). Enjoy the silence: an experiment on truth-telling. Experimental Economics, 12(2), 220-241.
Serra-Garcia, M., van Damme, E., and Potters, J.J. (2013). Lying about what you know or about what you do? Journal of the European Economic Association, 11(5), 1204-1229.
Sheremeta, R.M. and Shields, T. (2013). Do liars believe? Beliefs and other-regarding preferences in sender-receiver games. Journal of Economic Behavior & Organization, 94, 268-277.
Tetlock, P.E., Lerner, J.S., and Boettger, R. (1996). The dilution effect: Judgmental bias, conversational convention, or a bit of both? European Journal of Social Psychology, 26, 915-934.
Figure 1: Choices of Underwriters in Four Conditions by Treatment
The figure shows the proportion of underwriters who honestly reveal that the state is good, and the proportion who honestly reveal that the state is bad. There are 64 underwriters in the REAL treatment and 48 in the ROBOT treatment.
#1 #2 #3 #4 #1 #2 #3 #4
0 .2 .4 .6 .8 1
P
ro
p
o
rt
io
n
Real Robot
Figure 2: Choices of Investors in Four Conditions by Treatment
The figure shows the proportion of investors who invest when report is good, and when it is bad. There are 64 investors in the REAL treatment and 48 in the ROBOT treatment.
#1 #2 #3 #4 #1 #2 #3 #4
0 .2 .4 .6 .8 1
P
ro
p
o
rt
io
n
Real Robot
Figure 3: Investment and Gambles in Four Conditions by Treatment
The figure shows the proportion of investors who invest when report is good, and the proportion of investors who choose the corresponding risky gamble. There are 64 investors in the REAL treatment and 48 in the ROBOT treatment.
#1 #2 #3 #4 #1 #2 #3 #4
0 .2 .4 .6 .8 1
P
ro
p
o
rt
io
n
Real Robot
Figure 4: Subjective Probability Distribution
The figure illustrates investors’ subjective probabilities in scenarios when investors (1) glean no information content (𝛽 → 0), (2) have perfect beliefs of others’ reporting strategies (𝛽 = 1), (3) hold extreme beliefs leading to probability of one or zero (𝛽 → ∞). The fitted value of 𝛽 reflects the optimistic beliefs of underwriters' honesty as derived from maximization of the
Figure 5: Joint Behavior as Underwriter and Investor
Table 1: Parameter Values for Conditions
Endowment Investment Payoff
𝜂 𝜋𝐵 𝜋𝐺
Condition 1 10 0 12
Condition 2 10 0 18
Condition 3 10 0 22
Condition 4 10 0 28
Note: All payoffs reported in US$. In all conditions p(𝐺) = p(𝐵) = 0.5.
Table 2: Maximum Likelihood Model Best Fit Parameters
Log-likelihood Function Value 𝜆 𝜌 𝛽
𝐿𝐿(𝜆, 𝜌|𝑋) -220.49 9.97 (0.11)
0.0003 (0.0005)
𝐿𝐿(𝜆 𝜌, 𝛽|𝑋, 𝑌) -464.50 5.72 (0.06)
0.0002 (0.0005)
[image:31.612.107.508.466.534.2]1.789 (0.045) SEM is reported in parenthesis. Simulated SEM were generated by simulating 1,000 sets of investment and/or gamble decisions given by equations (1) and (3) over 4 conditions using the reported fitted parameters. Best fit parameters for 112 iterations were used to report SEM.
Table 3: Subjective and Actual Probability of Good State Given Report 𝑮̂
Value of 𝜋𝐺 12 18 22 28
Subjective probability 𝑃𝑠(𝜋𝐾, 𝛽) 0.816 0.818 0.814 0.802
Actual probability 𝑧𝑘 0.739 0.740 0.736 0.727
Appendix A (For Online Publication)
Experimental Instructions: REAL treatment
This is a computerized experiment in the economics of decision-making. By following the instructions carefully and making good decisions, you may earn an additional amount of money besides the show up bonus of $7. The currency used in this experiment is the unit lira. Lira will be converted to dollars at the end of the experiment; the conversion rate is on the board. The actual amount of additional money that you may earn will depend on your decisions and the decisions of other participants. Your money will be paid to you in cash after the experiment ends.
There are some rules you must follow: (1) Do not talk to others at any time during the experiment. (2) You will use your computer to select decisions during the experiment. Do not use your mouse or keyboard to play around with the software running on your computer. If you unintentionally or intentionally close the software program running on your computer, you will be asked to leave. If this happens, you will receive only your show up bonus. (3) If you have any questions during the experiment or instructions, please raise your hand. An experimenter will come to your location and answer your questions.
Details of the Experiment Grouping of Participants
The experiment consists of a single round. Within this round you will be randomly paired with up to eight other participants, but into separate groupings. There are four settings. Within each setting there will be a single Sender and a single Receiver. You will make decisions both as a Sender and Receiver in all settings. These settings are separate, as your decisions in one setting or role will not affect what happens in the other settings.
You will never be told whom you are paired with. You are not allowed to communicate with others during the experiment.
Overview of the Setting
Each Receiver has one unit of the financial asset. At the end of each round, the computer determines the State of the economy, which in turn dictates the value of each Receiver’s asset. The chances of a particular State are:
Chances of States
State A B
Chance of State 1/2 1/2
The State will be either A or B. There is an equal chance that the computer will select A or B. So, on average the computer will select A 50 percent of the time and B 50 percent of the time.
At the beginning of each round the Sender privately learns the State. No one else learns the State before the end of the round.
After the Sender learns the State, the Sender sends a Report to the Receiver. After the Receiver sees the Sender’s Report, the Receiver decides to Go or Stay resulting in the following payoffs.
Payoffs Given State and Receiver’s Decisions
State is A B
Receiver decides to Go
Receiver X 0
Sender 13 13
Receiver decides to Stay
Receiver 10 10
Sender 0 0
The value of X depends upon the setting. It will either be 12, 18, 22, or 28.
Notice that only when the State is A are the payoffs higher for all parties when the Receiver decides to Go rather than to Stay. Also, notice that the payoff is higher for the Sender if the Receiver decides to Go rather than to Stay in both States A and B. Last, notice that the payoffs do not depend on the Sender’s Report, only on the State and whether the Receiver decides to Go or Stay.
Questionnaire 1
Below, please write down your answers to the following questions. If you have a question, please raise your hand and an experimenter will privately answer your question. In a few minutes, an experimenter will review the correct answers.
1) What is the chance the State will be B? (0, 1/2, 1)
2) If the Sender knows the State is B, what can she report? (A, B, A or B)
3) If the Receiver knew the State was A, is his payment higher if he chooses to Go? (Yes, No) 4) If the Receiver knew the State was B, is his payment higher if he chooses to Go? (Yes, No) 5) If the Receiver decides to Go, what will the Sender receive? ($10, $13)
Sender’s Decision
We will ask you to make a decision in the role of Sender in four settings. In each setting the payoff to the receiver if he goes in State A is 12, 18, 22, or 28. Specifically, we will ask you to make a decision about what you would report to the paired Receiver in advance of seeing the State drawn. When the experiment starts you will see the following on your screen:
On the left side of the screen you are asked as a Sender to fill in the two entries for each of four settings. If the State were equal to A, would you report A or B, and if the State were equal to B, would you report A or B? Specifically, for each possible State, you need to tell the computer what Report you will send.
We want you, as the Sender, to say in advance what you would do in both of the scenarios. The computer implements the decisions you make once the State is drawn. Your decision will not affect which State is drawn. Your decision in the role of Sender will not affect the outcome of the settings in which you are a Receiver. Your decision will note effect the other settings.
Receiver’s Decision
We will ask you to make a decision in the role of Receiver in four settings. In each setting the payoff to the receiver in State A is 12, 18, 22, or 28 if he goes. Specifically, we will ask you to make a decision about what you
would do for each possible Report the paired Sender might send before you see the Report. When the experiment starts you will see the following on your screen:
On the right side of the screen you are asked as a Receiver to fill in the two entries for each of four settings. If the Sender’s Report were A, do you want to Go or Stay, and if the Sender’s Report were B, do you want to Go or Stay? Although, in the end as a Receiver you would see only one Report (A or B), we still want you to tell us what you would do for each possible Report.
Your decision will not affect which Report is sent or which State drawn. Your decision in the role of Receiver will not effect the outcome of the settings in which you are a Sender.
Questionnaire 2
Below, please write down your answers to the following questions. In a few minutes, an experimenter will review the correct answers.
6) If the Sender always elects to report A, what report will the Receiver see when the State is A? (A, B) 7) If the Sender always elects to report A, what report will the Receiver see when the State is B? (A, B) 8) Does the Receiver always have to Go? (Yes, No)
9) If the Sender’s Report is B, can the State be A? (Yes, No) 10) If the Sender’s Report is A, can the State be B? (Yes, No)
Results of the Round
After you make both your decisions, the decision in the role of Sender and the decision in the role of Receiver, click on the red ‘Submit’ button. After all participants input their decisions, the computer will display the outcome screen with the outcome from one of the six settings. One, and only one, of your settings will be randomly selected and you will be paid on the outcome of that setting. For example, if the setting in which you played the role of Receiver was selected for payment, then your screen would show:
Results of Setting State
Sender’s Report Receiver’s decision
Sender’s payoff Receiver’s payoff
How is this table generated? After all the participants have input their decisions, the computer will draw realizations of the State independently for each pair. The computer determines the State randomly as based on Chances of State table. Given the decision input by the Sender, the Report is determined and appears under the caption ‘Sender’s Report’. Note this is the Sender’s Report– not the State.
Next, using the decision input by the Receiver, the computer reports if the Receiver decided to Stay or Go for the given Sender’s Report. This decision is reported in the row titled ‘Receiver’s decision’. Finally, the computer determines the payoffs (taken from Payoffs Given State and Receiver’s Decisions table) given the State and the decisions for the Sender and the Receiver. These payoffs are reported in the last two rows titled ‘Sender’s payoff’ and ‘Receiver’s payoff’.
To summarize, the experiment consists of a single round where: a. Grouping of Participants: pairs are randomly assigned
b. Participant’s Decisions: each participant enters both a decision in the role of Sender and a decision in the role of Receiver.
c. Payoffs: the computer randomly selects one setting calculates payoffs using the decisions input d. Results for the round: each participant sees payoff from the setting where he/she was the Sender or
from the setting where he/she was the Receiver.
At the end of the experiment, you will be paid in private and in cash.
Questionnaire 3
Below, please write down your answers to the following questions. In a few minutes, an experimenter will review the correct answers.
11) You will be paid for one of your settings, not all. (True, False)
12) Suppose the setting where if the Receiver goes in State A he gets 18. If the State is A, the Sender reports ‘A’ when the State is A, and the Receiver decides to Go when the Report is ‘A’, what is:
a. The Sender’s Report? (A,B) b. The Receiver’s payoff? (0,10,18) c. The Sender’s payoff? (0,13)
State A
Sender’s Report Receiver’s decision Sender’s payoff Receiver’s payoff
13) If the State is B, the Sender reports ‘A’ when the State is B, and Receiver decides to Stay when the Report is ‘A’, what is:
a. The Sender’s Report? (A,B) b. Receiver’s payoff? (0,10,18) c. The Sender’s payoff? (0,13)
State B
Experimental Instructions: ROBOT treatment
This is a computerized experiment in the economics of decision-making. By following the instructions carefully and making good decisions, you may earn an additional amount of money besides the show up bonus of $7. The currency used in this experiment is the unit lira. Lira will be converted to dollars at the end of the experiment; the conversion rate is on the board. The actual amount of additional money that you may earn will depend on your decisions and the decisions of other participants. Your money will be paid to you in cash after the experiment ends.
There are some rules you must follow: (1) Do not talk to others at any time during the experiment. (2) You will use your computer to select decisions during the experiment. Do not use your mouse or keyboard to play around with the software running on your computer. If you unintentionally or intentionally close the software program running on your computer, you will be asked to leave. If this happens, you will receive only your show up bonus. (3) If you have any questions during the experiment or instructions, please raise your hand. An experimenter will come to your location and answer your questions.
Details of a Past Experiment
A past experiment was run in this laboratory using participants recruited the same way you were. The experiment consisted of a single round. Within the round people were randomly paired with other participants in each of four settings. Within each setting there was a single Sender and a single Receiver. Everyone made decisions as both as a Sender and a Receiver in all settings. These settings were separate, as decisions in one setting or role could not affect what happened in the other settings. No one was ever told whom he or she was paired with. They were not allowed to communicate with others during the experiment.
Each Receiver had one unit of the financial asset. At the end of each round, the computer determines the State of the economy, which in turn dictates the value of each Receiver’s asset. The chances of a particular State were:
Chances of States
State A B
Chance of State 1/2 1/2
The State was either A or B. There was an equal chance that the computer will select A or B. So, on average the computer selects A 50 percent of the time and B 50 percent of the time. At the beginning of each round the Sender privately learned the State. No one else learned the State before the end of the round. After the Sender learned the State, the Sender sent a Report to the Receiver. After the Receiver saw the Sender’s Report, the Receiver decided to Go or Stay resulting in the following payoffs.
Payoffs Given State and Receiver’s Decisions
State is A B
Receiver decides to Go
Receiver X 0
Sender 13 13
Receiver decides to Stay
Receiver 10 10
Sender 0 0
The value of X depends upon the setting. It was 12, 18, 22, or 28.
Notice that only when the State is A are the payoffs higher for all parties when the Receiver decided to Go rather than to Stay. Also, notice that the payoff is higher for the Sender if the Receiver decided to Go rather than to Stay in both States A and B. Last, notice that the payoffs do not depend on the Sender’s Report, only on the State and whether the Receiver decided to Go or Stay.
What was the Sender’s Report? If the Sender learned the State was A, the Sender could report either A or B. If the Sender learned the State is B, the Sender could Report A or B.
Questionnaire 1
1) What was the chance the State was B? (0,1/2,1)
2) If the Sender knew the State is B, what could she report? (A, B, A or B)
3) If the Receiver knew the State was A, was his payment higher if he chose to Go? (Yes/No) 4) If the Receiver knew the State was B, was his payment higher if he chose to Go? (Yes/No) 5) If the Receiver decided to Go, what did the Sender receive? ($10, $13)
Today’s Experiment
No one who was in the previous experiment is here today. In today’s experiment, you are asked to make similar decisions as Sender and as a Receiver. However, unlike the previous experiment, you will NOT be paired with another person who is in the room today. Your payoff will be determined by your decisions and by a computerized decision process, which we will refer to as a “robot”. So, unlike the prior experiment, your decisions cannot affect another other person’s payoff. Furthermore, no other participant here today will make a decision affecting your payoff.
What exactly is the “robot”? The computer will randomly select from the archive of past observations in the past experiment and use one of the actual decisions to determine your payoffs. Your payoff as a Sender will depend upon your reporting decision, and the “robot” receiver. Your payoff as a Receiver will depend upon your decision to Stay or Go and the “robot” sender. Your decision cannot affect anyone else’s payoff. Likewise, no one else’s decision can affect your decision.
Let’s examine more closely your decisions as Sender, and then as Receiver.
Sender’s Decision
We will ask you to make a decision in the role of Sender in four settings. In each setting the payoff to the receiver if they go and the State is A is 12, 18, 22, or 28. Specifically, we will ask you to make a decision about what you would report to the paired Receiver in advance of seeing the State drawn. When the experiment starts you will see the following on your screen:
On the left side of the screen you are asked as a Sender to fill in the two entries for each of four settings. If the State were equal to A, would you report A or B, and if the State were equal to B, would you report A or B? Specifically, for each possible State, you need to tell the computer what Report you will send.
We want you, as the Sender, to say in advance what you would do in both of the scenarios. The computer implements the decisions you make once the State is drawn. Your decision will not affect which State is drawn.