Predicting the Relative Difficulty of Single Sentences
With and Without Surrounding Context
Elliot Schumacher
Carnegie Mellon University [email protected]
Maxine Eskenazi
Carnegie Mellon University [email protected]
Gwen Frishkoff
University of Oregon [email protected]
Kevyn Collins-Thompson
University of Michigan [email protected]
Abstract
The problem of accurately predicting rela-tive reading difficulty across a set of sen-tences arises in a number of important natu-ral language applications, such as finding and curating effective usage examples for intelli-gent language tutoring systems. Yet while significant research has explored document-and passage-level reading difficulty, the spe-cial challenges involved in assessing aspects of readability for single sentences have re-ceived much less attention, particularly when considering the role of surrounding passages. We introduce and evaluate a novel approach for estimating the relative reading difficulty of a set of sentences, with and without surround-ing context. Ussurround-ing different sets of lexical and grammatical features, we explore models for predicting pairwise relative difficulty using lo-gistic regression, and examine rankings gener-ated by aggregating pairwise difficulty labels using a Bayesian rating system to form a final ranking. We also compare rankings derived for sentences assessed with and without con-text, and find that contextual features can help predict differences in relative difficulty judg-ments across these two conditions.
1 Introduction
The reading difficulty, or readability, of a text is an estimate of linguistic complexity and is typically based on lexical and syntactic features, such as text length, word frequency, and grammatical complex-ity (Collins-Thompson and Callan, 2004; Schwarm and Ostendorf, 2005; Kidwell et al., 2011; Kanungo and Orr, 2009). Such estimates are often expressed
as age- or grade-level measures and are useful for a range of educational and research applications. For example, instructors often wish to select stories or books that are appropriately matched to student grade level.
Many measures have been designed to calculate readability at the document level (e.g., for web pages, articles, or books) (Collins-Thompson and Callan, 2004; Schwarm and Ostendorf, 2005), as well as the paragraph or passage level (Kidwell et al., 2011; Kanungo and Orr, 2009). However, much less work has attempted to characterize the readabil-ity of single sentences (Pil´an et al., 2014). This problem is challenging because single sentences provide less data than is typically required for re-liable estimates, particularly for measures that rely on aggregate statistics.
The absence of reliable single-sentence estimates points to a gap in natural language processing (NLP) research. Single sentences are used in a variety of experimental and NLP applications: for example, in studies of reading comprehension. Because read-ability estimates have been shown to predict a sub-stantial portion of variance in comprehension of dif-ferent texts, it would be useful to have measures of single-sentence readability. Thus, one aim of the current study was to estimate therelative readabil-ity of single sentences with a high degree of accu-racy. To our knowledge, general-purpose methods for computing such estimates for native language (L1) readers have not been developed, and thus our goal was to develop a method that would character-ize sentence-level difficulty for that group.
The second aim is to compare the readability of single sentences in isolation with the readability of
these same sentences embedded in a larger context (e.g., paragraph, passage, or document). When a single sentence is extracted from a text, it is likely to contain linguistic elements, such as anaphora (e.g., “he” or “the man”), that are semantically or syn-tactically dependent on surrounding context. Not surprisingly, sentences that contain these contextual dependencies take more effort to comprehend: an anaphoric noun phrase, or NP (e.g., “he”), automati-cally triggers the need to resolve reference, typiautomati-cally by understanding the link between the anaphor and a full NP from a previous sentence (e.g., “John” or “The man that I introduced you to at the party last night” (Perfetti and Frishkoff, 2008). In general, studies have shown a link between reading com-prehension and the presence of such cross-sentence relationships in the text (McNamara, 2001; Lieder-holm et al., 2000; Voss and Silfies, 1996). This im-plies that the very notion of readability at the sen-tence level may depend on context as well as word-and sentence-level features. Therefore, it is impor-tant to compare readability estimates for single sen-tences that occur in isolation with those that occur within a larger passage, particularly if the target sen-tence contains coreferences, implied meanings, or other dependencies with its context.
To address these aims, the present study first con-ducted two crowdsourcing experiments. In the first, ‘sentence-only’ experiment, workers were asked to judge which of two “target” sentences they thought was more difficult. In the second, ‘sentence-in-passage’ experiment, another group of workers was presented with the same target sentences that were used in the first experiment. However, in the second experiment, target sentences were embedded in their original contexts.
Next, we analyzed these judgments of relative readability for each condition (sentence-only ver-sus sentence-in-passage) by developing models for predicting pairwise relative difficulty of sentences. These models used a rich representation of target sentences based on a combination of lexical, syntac-tic, and discourse features. Significant differences were found in readability judgments for sentences with and without their surrounding context. This demonstrates that discourse-level features (i.e., fea-tures related to coherence and cohesion) can affect the readability of single sentences.
2 Related Work
Recent approaches to estimating readability have used a variety of linguistic features and predic-tion models (Collins-Thompson, 2014). The Lex-ile Framework (Stenner, 1996) uses word frequency estimates in a large corpus as a proxy for lexi-cal difficulty, and sentence length as a grammati-cal feature. Methods based on statistigrammati-cal machine learning, such as the reading difficulty measures de-veloped by Collins-Thompson and Callan (Collins-Thompson and Callan, 2004) and (Schwarm and Os-tendorf, 2005) used a feature set based on language models. Later work (Heilman et al., 2008) incorpo-rated grammatical features by parsing the sentences in a text, and creating subtrees of one- to three-level depth as separate features. Such features allow more detailed, direct analysis of the sentence structure it-self instead of traditional proxies for syntactic com-plexity likes sentence length. The linguistic features proposed in these works capture specific aspects of language difficulty applied at the document level, whereas our work investigates the effectiveness of these feature types for characterizing aspects of dif-ficulty at the sentence level.
Acquisition estimates for individual words, repre-senting the lexical component of difficulty, was used to predict the grade levels of passages. Some ap-proaches have explored the classification of specific aspects of sentences, as opposed to reading difficulty classification. For example, (Pil´an et al., 2014) clas-sified individual sentences that would be understood by second-language learners. Another work (Kil-garriff et al., 2008) identified sentences that would be good dictionary examples by looking for specific desirable features. Davenport et al. 2014 used a traditional method of readability (Flesch-Kincaid), within the larger context of exploring relationships between the difficulty of tweets in a geographic area and demographics. Research in text simplification has applied sentence-level models of difficulty as part of simplification-based optimization objectives. For example, Woodsend and Lapata (2011) use word and syllable count as proxy features for sentence dif-ficulty when implicitly comparing different simpli-fied variants of a sentence.
Other approaches have considered the relation-ship of reading difficulty to structures within in the whole text. These relationships can include the num-ber of coreferences present in a text. Coh-Metrix (Graesser et al., 2011) measures text cohesiveness, accounting for both the reading difficulty of the text and other lexical and syntactic measures as well as a measure of prior knowledge needed for compre-hension, and the genre of the text. Coh-Metrix uses co-reference detection as a factor in the cohesive-ness of a text, typically at the document or passage level. Such cohesiveness factors account for the dif-ficulty of constructing the mental representation of texts with more complex internal structure. TextE-valuator (Sheehan et al., 2013; Sheehan et al., 2014) is designed to help educators select materials for in-struction. The tool includes several components in its evaluation of text, including narrativity, style, and cohesion, beyond traditional difficulty and is again at the whole document level. This approach illus-trates that the difficulty of a text relies on the rela-tionships within it. This motivates the need to con-sider context when measuring difficulty.
Generating reading difficulty rankings of longer texts from pairwise preferences has been performed in other contexts. Tanaka-Ishii et al. (2010) explored an approach for sorting texts by readability based on
pairwise preferences. Later, Chen et al. (2013) also proposed a model to obtain passage readability rank-ing by aggregatrank-ing pairwise comparisons made by crowdworkers. In De Clercq et al.(2014), pairwise judgments of whole passages were obtained from crowdworkers and were found to give comparable results in aggregate to those obtained from experts. A pairwise ranking of text readability was created in Pitler and Nenkova (2008) in which readability was defined by subjective questions asked to the reader after finishing the article, such as “How well-written is this article?”. All of the above previous work was focused on ordering longer text passages, not single sentences as we do here.
Finally, research in the Machine Translation field has explored pairwise prediction of the best transla-tion between two sentence optransla-tions. For example, in Song and Cohn (2011), a pairwise prediction model was built using n-gram precision and recall, as well as function, content, and word counts. However, un-like pairwise prediction of difficulty, the prediction is done with respect to a reference sentence, or set of reference sentences.
3 Data Collection and Processing
We now describe methods used to create our dataset of sentences, to collect pairwise assessments of dif-ficulty, and to aggregate these pairwise preferences into a complete ranking.
3.1 Data Set
us-ing a lexical readability model (Collins-Thompson and Callan, 2004).The data set gathered by (Collins-Thompson and Callan, 2004) was used in order to add to the amount of lower-level reading material in the collected corpora.
With these sentences, two crowdsourced tasks were prepared to gather pairwise assessments of sen-tence reading difficulty. In one task, the sensen-tences were presented alone, outside of their original pas-sage context. In the other task, the same sentences were presented within their original passage context. The objective was to generate two sets of pairwise comparisons of the readability of a sentence. In to-tal, 120 sentence pairs were used for the first task and 120 passage pairs were used for the second. Each sentence was compared to five others, which created 300 comparisons in each task. The five stences matched to each sentence were selected to en-sure that pairs with a range of document level differ-ences would be created. Within each type of pair, a random pair was selected.
There were several constraints when generating pairs for comparison. To allow for sentences to be taken from documents with a range of reading lev-els, sentences were selected evenly from documents at each reading level. From the twelve standard U.S. grade levels used in readability, each document was considered to be part of a bin consisting of two ad-jacent grade levels, such as grades 1 and 2, for ex-ample. Sentences were selected evenly from those bins.
Each sentence needed sufficient context to ensure there would be equivalent context for each item that would be compared, so only passages of sufficient size were included. To ensure passages were of similar length, only passages that had between 136 and 160 words were included. Contexts having at least two sentences before and after the sentence in question were strongly preferred. Each selected sentence was paired with one sentence from each of the other grade level bins. For example, a tence from grade 1 would be paired with one sen-tence each from grade 3-4, 5-6, 7-8, 9-10, and 11-12. Finally, each pair of sentences was presented in AB and BA order. For each pair, there were seven worker decisions. There were 296 unique workers for the only task, and 355 for the sentence-in-passage task.
3.2 Crowdsourcing
Both of these tasks were carried out on the Crowd-flower platform. The workers were first given in-structions for each task, which included a descrip-tion of the general purpose of the task. In the sentence-only task, workers were asked to select which of the two sentences was more difficult. In the sentence-within-passage task, workers were sim-ilarly asked to decide which underlined sentence was more difficult. The instructions for the latter re-quested that the workers make their judgment only on the sentence, not on the whole context. In both tasks, there was an option for “I don’t know or can’t decide”. The workers were asked to make their deci-sion based on the vocabulary and grammatical struc-ture of the sentences. Finally, examples for each task were provided with explanations for each answer.
For each task, at least 40 gold standard ques-tions were created from pairs of sentences that were judged to be sufficiently distinct from one another so that they could easily be answered correctly. For the sentence-in-passage task, several gold standard questions were written to verify that the instruc-tions were being followed, since it was possible that a worker might judge the sentences based on the quality of the passage alone. These gold examples consisted of an easier sentence in a difficult pas-sage compared with a difficult sentence within an easy passage. For each task, the worker saw three questions, including one gold standard question. A worker needed to maintain an 85% accuracy rating on gold standard questions to continue, and needed to spend at least 25 seconds per page, which con-tained 3 questions each.
pairwise judgments, respectively. For each ques-tion, there was an optional text form to allow work-ers to submit feedback. The sentence-only task paid 11 cents per page, and the sentence-in-passage task paid 22 cents per page.
3.3 Ranking Generation
Each task resulted in 4,200 pairwise preference judgments, excluding gold-standard answers. To aggregate these pairwise preferences into an over-all ranking of sentences, we use a simple, publicly available approach evaluated by Chen et al. as be-ing competitive with their own Crowd-BT aggre-gation method: the Microsoft Trueskill algorithm (Herbrich et al., 2007). Trueskill is a Bayesian skill rating system that generalized the well-known Elo rating system, in that it generates a ranking from pairwise decisions. As Trueskill’s ranking algorithm depends on the order in which the samples are pro-cessed, we report the ranking as an average of 50 runs.
The judgments were not aggregated for each com-parison. Instead, each of the judgments was treated individually. This allows Trueskill to consider the degree of agreement between workers, since a sen-tence judgment that has high agreement reflects a larger difference in ranking than one that has lower agreement. Each sentence was considered a player, and the winner between two, A or B, was the sen-tence considered most difficult. If a worker chose “I don’t know or can’t tell”, it was considered a draw. The prediction resulting in “I don’t know or can’t tell” is rare; 2.2% of decisions in the sentence only task resulted in a draw, and 2.0% for sentences within passages. After processing each of the judg-ments, a rating can be built of sentences, ranked from least difficult to most difficult. We can com-pare the resulting rankings for the sentence-only task and the sentence-in-passage task to see the effect of context on relative sentence difficulty.
4 Modeling Pairwise Relative Difficulty
Our first step in exploring relative difficulty order-ing for a set of sentences was to develop a model that could accurately predict relative difficulty for a single pair of sentences, corresponding to the pair-wise judgements of relative difficulty we gathered from the crowd. We did this for both the
sentence-only and the sentence-in-passage tasks. In predict-ing a pairwise judgment for the sentence-only task, the model uses only the sentence texts. In the model for the sentence-in-passage task, the Stanford De-terministic Coreference Resolution System (Raghu-nathan et al., 2010) is used to find coreference chains within the passage. From these coreference chains, sentences with references to and from the target sen-tence can be identified. If any additional sensen-tences are found, these are used in a separate feature set that is included in the model; for all possible fea-tures, they are calculated for the target sentence, and separately for the additional sentence set.
Prior to training the final model, feature selec-tion was done on random splits of the training data. Training data was used to fit a Random Forest Clas-sifier, and based on the resulting clasClas-sifier, the most important variables were selected using sklearn’s feature importance method. The top 2% of the fea-tures (or 1% for the sentence-in-passage with coref-erence, since the feature set size is doubled) were se-lected automatically. This resulted in a feature size of 40-50 features. We implemented our models us-ing scikit-learn (Pedregosa et al., 2011) in Python.
The resulting features were used to train a Logis-tic Regression model. While other prediction mod-els such as Support Vector Machines have been ap-plied to relative readability prediction (Inui and Ya-mamoto, 2001), we chose Logistic Regression due to its ability to provide estimates of class prob-abilities (which may be important for reliability when deploying a system that recommends high-quality items for learners), its connection to the Rasch psychometric model used with reading as-sessments (Ehara et al., 2012), and the interpretable nature of the resulting parameter weights. Since a given feature has a value for sentence A and B, if a feature was selected for only Sentence A or B, the feature for the other sentence was also added. We used the NLTK library (Bird et al., 2009) to tokenize the sentence for feature processing.
features: lexical and grammatical, described below.
4.1 Lexical Features
For lexical features, based partly on the work of (Song and Cohn 2011) we included the percentage of non-stop words (using NLTK list), the total num-ber of words and the total numnum-ber of characters as features. We included the percentage of words in the text found in the Revised Dale-Chall word list (Dale and Chall, 2000) to capture the presence of more difficult words in the sentence.
Because sentences that contain rarer sequences of words are likely to be more difficult, and the likeli-hood of the sentence based on a large corpus should reflect this, we included the n-gram likelihood of each sentence, over each of 1-5 n-grams, as a fea-ture. The Microsoft WebLM service (Wang et al., 2010) was used to calculate the n-gram likelihood.
In the field of psycholinguistics, Age of Acquisi-tion (AoA) refers to the age at which a word is first learned by a child. A database of 51,715 words col-lected by (Kuperman et al., 2012) provides a rich re-source for use in reading difficulty measures. With this dataset, we computed several additional fea-tures: the average, maximum, and standard devia-tion of the aggregated AoA for all words in a sen-tence that were present in the database. Since the data set also includes the number of syllables in each word, and as (Kincaid et al., 1975) proposes that words with more syllables are more difficult, we also included the average and maximum syllable count as potential features.
4.2 Syntactic Features
We parsed each sentence in the data set using the BLLIP Parser (Charniak and Johnson, 2005), which includes a pre-trained model built on the Wall Street Journal Corpus. This provided both a syntactic tree and part of speech tags for the sentence. As Part of Speech tagging is often used as a high-level linguis-tic feature, we computed percentages for each PoS tag present, since the percentages might vary be-tween difficult sentences and easier sentences. The percentage for each Part of Speech tag is defined as the number of times a certain tag occurred, divided by the total tags. The diversity of part of speech tags was used since this might vary between difficult and easier sentences.
Using the syntactic tree provided by the parser, we obtained the likelihood of the parse, and the like-lihood produced by the re-ranker, as syntactic fea-tures. If a sentence parse has a comparatively high likelihood, it is likely to be a more common struc-ture and thus more likely to be easier to read. The length and height of the parse were also included as features, since each of these could reflect the diffi-culty of the parse. Including the entire parse of the sentence would create too much sparsity since syn-tactic parses vary highly from sentence to sentence. Therefore, as was done in (Heilman et al., 2008), subtrees of depth one to three were created from the syntactic parse, and were added as features. This creates a smaller feature set, and one that can poten-tially model specific grammatical structures that are associated with a specific level of difficulty.
5 Pairwise Difficulty Prediction Results
The performance of the logistic regression models trained with different feature sets, for each task, is shown in Table 1. We reported the mean and stan-dard deviation of the accuracy of each model over 200 randomly selected training and testing splits. Each test set consisted of 20% of the data, and con-tained 60 aggregate pairs, all of which are sentences (24 in total) that were not present in the training data. The test sets for the sentence-in-passage and sentence-only task contain the same sentence pairs, but the individual judgements are different.
For comparison, an oracle is included that repre-sents the accuracy a model would achieve if it made the optimal prediction for each aggregate pair. Due to disagreement within the crowd, the oracle cannot reach 100% accuracy. For example, for some pair A and B, if 10 workers selected A as the more diffi-cult sentence, and 4 workers selected B, the oracle’s prediction for that pair would be that that A is more difficult. The judgments of the four workers that se-lected B would be counted as inaccurate, since the feature set is the same for the judgments with A and the judgments with B. Therefore, the oracle repre-sents the highest accuracy a model can achieve, con-sistent with the provided labels, using the features provided.
Sentence Only In Passage, With Coref In Passage, No Coref Model Acc. S.D. p-value Acc. S.D. p-value Acc. S.D. p-value Oracle (A) 90.13% 2.71% — 87.81% 1.84% — 87.81% 1.84% — All Features (B) 84.69% 3.46% 0.01↓ 81.66% 3.17% 0.005↓ 81.91% 3.27% ←0.04 AoA + Parse L. (C) 84.33% 3.13% 0.001↓ 81.27% 3.93% 0.001↓ 80.84% 3.61% ←0.001
[image:7.612.71.544.57.145.2]AoA (D) 79.62% 2.71% 0.001↓ 79.72% 2.86% 0.001↓ 78.99% 2.58% ←0.001 Strat. Random 50.28% 1.68% — 50.31% 2.01% — 50.31% 2.01% —
Table 1: Mean and standard deviation of accuracy on 200 randomized samples of 20% held out data. ‘With coref’ indicates coreference features were used. The arrow indicates which immediately adjacent accuracy result is used for p-value comparison, e.g. Model B sentence-only is compared to model C sentence-only, and model B passage, no coref is compared to model B passage, with coref.
varied depending on the task. However, the simplest model, the Age of Acquisition model (D) consisting of the average, standard deviation, and maximum AoA features (only: 6 features, sentence-in-passage: 12 features) performed well, achieving over 78% accuracy on all tasks, showing that most of the relative difficulty signal at the sentence level can be captured with a few lexical difficulty features. The Age of Acquisition + Parse Likelihood model (C) consists of all Age of Acquisition features, plus the likelihood of the parse (sentence-only: 10 fea-tures, sentence-in-passage: 20 features)1.
To assess the contribution of different features to the model prediction, feature group importances are reported in Table 2. As features for a given group are often highly correlated with each other, such as in Age of Acquisition, the importance is calculated for feature groups. Based on the method described for Model B, each feature group is removed from consideration in the model, and the resulting error rate from Model B is used to calculate an importance measure. The most important feature is normalized to have a value of 1.0, with the rest being relative to the difference in error rate from the original model, averaged across splits.
These prediction results show that relative reading difficulty can be predicted for sentence pairs with high accuracy, even with fairly simple feature sets. In particular, the results for AoA model D, which uses a small number of targeted features, are com-petitive with the best model B that relies on a much larger feature set. The addition of coreference fea-tures did result in small but significant changes in the
1The p-value for each accuracy measurement compares its significance, using a paired t-test, to the neighboring model in the direction of the arrow. For example, the sentence-only Model B is compared to sentence-only Model A.
Sentence Only Sentence in Passage (with Coref)
Feature Imp. Feature Imp.
Age of Acq. 1.00 Age of Acq. 1.00 Part of Speech 0.28 Syllables 0.27 Syn. Score 0.22 Part of Speech 0.23 Syn. Other 0.21 Syn. Tree 0.18 Syllables 0.19 Dale Chall 0.17 Ngram L. 0.19 Content Word % 0.17 Word Len. 0.17 Word Len. 0.16 Dale Chall 0.16 Syn. Other 0.16 Content Word % 0.15 Syn. Score 0.12
[image:7.612.319.534.212.328.2]Syn. Tree 0.12 Ngram L. 0.10
Table 2:Relative feature importance for Model B. Feature im-portance is the increase in absolute error with a specific feature group removed, averaged across cross-validation folds used for Table 1, and normalized relative to the most informative fea-ture. For Sentence in Passage, feature groups include corefer-ence features.
[image:7.612.370.482.416.468.2]Value Avg. Abs. Diff 9.3 Avg. Abs. Std Dev 7.7 Pearson’s correlation 0.94* Spearman’s correlation 0.94*
Table 3: Comparison of rankings generated with and without passage. Asterisk * indicatesp <0.0001.
% Diff Pearson p-val. Spearman p-val. Reranker -0.33 0.0002 -0.29 0.001 Parser -0.33 0.0002 -0.28 0.002
Table 4:Correlation between difference in rank and percentage difference in features.
accuracy of the sentence-in-passage task, although in one case the accuracy was reduced with corefer-ence features.
6 Ranking Results
or-Sentence Sentence-In-Passage
All Gold Only All Gold Only
Pearson Spearman Pearson Spearman Pearson Spearman Pearson Spearman AoA Avg 0.6971 0.7151 0.7366 0.7598 0.7155 0.7356 0.6220 0.6482
AoA Std Dev 0.6366 0.6596 0.7074 0.7385 0.6779 0.7023 0.5742 0.5825
AoA Max 0.7084 0.6814 0.8036 0.7877 0.7408 0.7155 0.6215 0.6127
Parser L. -0.4942 -0.5297 -0.4605* 0.4920 -0.4172 -0.4465 -0.5099 -0.5157
[image:8.612.77.535.56.154.2]Reranker L. -0.4923 -0.5280 -0.4574* -0.4751 -0.4139 -0.4450 -0.4969 -0.4879*
Table 5:Sentence-Only and Sentence-In-Passage Ranking Correlation with Individual Features. Gold indicates only gold-standard questions were used to build ranking. All correlations havep <0.0001except those with an asterisk *, which havep <0.001.
dering of sentences changes across these conditions, we can identify differences in how workers judged the relative difficulty of sentences with and without context.
6.1 Rank Differences
We report differences in ranking in terms of mean and standard deviation of the absolute difference in rank index of each sentence across the two rank-ings, along with Pearson’s coefficient and Spear-man’s rank order coefficients. Comparisons between the rankings for each task are shown in Table 3.
In comparing crowd-generated rankings for the sentence-only and sentence-in-passage task, the re-sults show a statistically significant aggregate dif-ference in how the crowd ranks sentence difficulty with and without the surrounding passage. While the correlation between the two rankings is high, and the average normalized change in rank posi-tion is 7.7%, multiple sentences exhibited a large change in ranking. For example, the sentence ‘As a result, the police had little incentive to make con-cessions.’ was ranked significantly easier when pre-sented out of context than when prepre-sented in context (rank change: -30 positions). For that example, the surrounding passage explained the complex political environment referred to indirectly in that sentence.
6.2 Feature Correlation with Rank Differences To examine why sentences may be ranked as more or less difficult, depending on the context, we exam-ined the correlation between a sentence’s change in rank (Only Ranking minus the Sentence-in-Passage ranking) and the normalized difference in feature values between the sentence representation and the remaining context representation. We found that percentage change in parser and reranker like-lihoods had the most significant correlation (-0.33)
with ranking change, as shown in Table 4.
To interpret this result, note that the parser and reranker likelihood represent the probability the parser and reranker models assign to the syntactic parse produced by the sentence. In other words, they are a measure of how likely it is that the sentence structure occurs, based on the model’s training data. If the difficulty of the sentence-in-passage is ranked higher than the sentence alone, this correlates with the target sentence having a syntactic structure with higher likelihood than the average of the surround-ing sentence structures. This means that if a sen-tence that has a frequently-seen syntactic structure is in a passage with sentences that have less common structures, the sentence within the passage is more likely to be judged as more difficult. The reverse is also true: if a sentence that has a more unusual syn-tactic structure is in a passage with sentences with more familiar structures, the sentence without the surrounding passage is more likely to be ranked as more difficult.
We also examined the rank correlation of crowd-generated rankings with rankings produced by sort-ing sentences based on the value of individual fea-tures. In addition to the full rankings, we con-structed a ranking produced only by the gold stan-dard examples, denotedGold Onlyand included this in the comparison. The gold standard questions con-sist of examples constructed by the authors to have a clear relative difficulty result. The rank correlations are shown in Table 5 for both tasks.
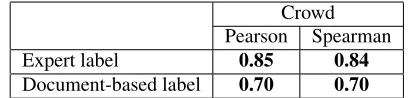
Crowd Pearson Spearman Expert label 0.85 0.84
[image:9.612.82.289.57.106.2]Document-based label 0.70 0.70
Table 6: Correlation between sentence readability labels and crowd-generated ranking, for expert (sentence-level) and document-based labels (from document readability prediction). All correlations havep <0.0001.
told to only consider the sentence, the properties of the surrounding passage may indeed influence the perceived relative difficulty of the sentence.
6.3 Review of Data
The pairwise prediction results indicate that a large proportion of the crowdsourced pair orderings can be decided using vocabulary features, due to the strong performance of the Age of Acquisition fea-tures. To identify the relative importance of vocab-ulary and syntax in our data, we reviewed each pair and judged whether the sentence’s syntax or vocab-ulary, or the combination of both, were needed to correctly predict the more difficult sentence. For many pairs, either syntax or vocabulary could be used to correctly predict the more difficult sentence since each factor indicated the same sentence was more difficult. We found that 19% of pairs had only a vocabulary distinction, and 65% of pairs could be judged correctly either by vocabulary or syntax. Therefore, 84% of pairs could be judged using vo-cabulary, which explains the high performance of the Age of Acquisition features.
The level of a sentence’s source document was used as a proxy for the sentence’s grade level when building the pairs. To build a sentence-level gold standard for this dataset, we asked a teacher with a Master of Education with a Reading Specialist fo-cus and 30 years of experience in elementary and high school reading instruction, to identify the grade level of each sentence. This expert was asked to as-sign either a single grade level or a range of levels to each of the 120 sentences. From this, an expert rank-ing was created, usrank-ing the midpoint of each expert-assigned range. The correlation between the expert sentence ranking and the crowd ranking can be seen in Table 6, reinforcing the finding that crowdsourced judgments can provide an accurate ranking of diffi-culty (De Clercq et al., 2014).
7 Conclusion
Using a rich sentence representation based on lex-ical and syntactic features leveraged from previous work on document-level readability, we introduced and evaluated several models for predicting the rel-ative reading difficulty of single sentences, with and without surrounding context. We found that while the best prediction performance was obtained by us-ing all feature classes, simpler representations based on lexical features such as Age of Acquisition norms were effective. The accuracy achieved by the best prediction model came within 6% of the oracle ac-curacy for both tasks.
Many of the features identified had a high correla-tion with the rankings produced by the crowd. This indicates that these features can be used to build a model of sentence difficulty. With the rankings built from crowdsourced judgments on sentence diffi-culty, small but significant differences were found in how sentences are ranked with and without the sur-rounding passages. This result suggests that prop-erties of the surrounding passage of a sentence can change the perceived difficulty of a sentence.
In future work, we plan to increase the number of sentences in our data set, so that additional more fine-grained features might be considered. For ex-ample, weights for lexical features could be more accurately estimated with more data. Our use of the crowd-based labels was intended to reduce noise in the ranking analysis, but we also intend to use the pairwise predictions produced by the logistic model as the input to the aggregation model, so that rank-ings can be obtained for previously unseen sentences in operational settings. Another goal is to obtain ab-solute difficulty labels for sentences by calibrating ordinal ranges based on the relative ranking. Finally, we are interested in the contribution of context in un-derstanding the meaning of an unknown word.
Acknowledgments
References
Steven Bird, Ewan Klein, and Edward Loper. 2009. Nat-ural language processing with Python. ” O’Reilly Me-dia, Inc.”.
Eugene Charniak and Mark Johnson. 2005. Coarse-to-fine n-best parsing and maxent discriminative rerank-ing. InProceedings of the 43rd Annual Meeting on
As-sociation for Computational Linguistics, pages 173–
180. Association for Computational Linguistics. Xi Chen, Paul N Bennett, Kevyn Collins-Thompson, and
Eric Horvitz. 2013. Pairwise ranking aggregation in a crowdsourced setting. In Proceedings of the sixth ACM international conference on Web search and data
mining, pages 193–202. ACM.
Kevyn Collins-Thompson and James P Callan. 2004. A language modeling approach to predicting reading dif-ficulty. InHLT-NAACL, pages 193–200.
Kevyn Collins-Thompson. 2014. Computational assess-ment of text readability: a survey of current and future research.International Journal of Applied Linguistics, 165(2):97–135.
Edgar Dale and Jeanne S Chall. 2000. Readability revisited: The new dale-chall readability formula.
http://opi.mt.gov/Pub/RTI/Forms/ School/Choteau/The\%20Dale-Chall\ %20Word\%20List.doc. Accessed: 2016-5-10. James R. A. Davenport and Robert DeLine. 2014. The
readability of tweets and their geographic correlation with education. CoRR, abs/1401.6058.
Orph´ee De Clercq, Veronique Hoste, Bart Desmet, Philip Van Oosten, Martine De Cock, and Lieve Macken. 2014. Using the crowd for readability prediction.
Nat-ural Language Engineering, 20(03):293–325.
Yo Ehara, Issei Sato, Hidekazu Oiwa, and Hiroshi Nak-agawa. 2012. Mining words in the minds of sec-ond language learners: Learner-specific word diffi-culty. In COLING 2012, 24th International Confer-ence on Computational Linguistics, Proceedings of the Conference: Technical Papers, 8-15 December 2012,
Mumbai, India, pages 799–814.
Arthur C Graesser, Danielle S McNamara, and Jonna M Kulikowich. 2011. Coh-metrix providing multi-level analyses of text characteristics. Educational Re-searcher, 40(5):223–234.
Michael Heilman, Kevyn Collins-Thompson, and Max-ine Eskenazi. 2008. An analysis of statistical mod-els and features for reading difficulty prediction. In
Proceedings of the Third Workshop on Innovative Use
of NLP for Building Educational Applications, EANL
’08, pages 71–79, Stroudsburg, PA, USA. Association for Computational Linguistics.
Ralf Herbrich, Tom Minka, and Thore Graepel. 2007. Trueskill(tm): A bayesian skill rating system. In
Ad-vances in Neural Information Processing Systems 20,
pages 569–576. MIT Press, January.
Kentaro Inui and Satomi Yamamoto. 2001. Corpus-based acquisition of sentence readability ranking mod-els for deaf people. InProceedings of the Sixth Nat-ural Language Processing Pacific Rim Symposium, November 27-30, 2001, Hitotsubashi Memorial Hall, National Center of Sciences, Tokyo, Japan, pages 159– 166.
Tapas Kanungo and David Orr. 2009. Predicting the readability of short web summaries. In Proceedings of the Second ACM International Conference on Web
Search and Data Mining, pages 202–211. ACM.
Paul Kidwell, Guy Lebanon, and Kevyn Collins-Thompson. 2011. Statistical estimation of word acquisition with application to readability predic-tion. Journal of the American Statistical Association, 106(493):21–30.
Adam Kilgarriff, Milos Hus´ak, Katy McAdam, Michael Rundell, and Pavel Rychl`y. 2008. Gdex: Automat-ically finding good dictionary examples in a corpus.
In Proceedings of the XIII EURALEX International
Congress (Barcelona, 15-19 July 2008), pages 425–
432.
J Peter Kincaid, Robert P Fishburne Jr, Richard L Rogers, and Brad S Chissom. 1975. Derivation of new readability formulas (automated readability index, fog count and flesch reading ease formula) for navy en-listed personnel. Technical report, DTIC Document. Victor Kuperman, Hans Stadthagen-Gonzalez, and Marc
Brysbaert. 2012. Age-of-acquisition ratings for 30,000 english words. Behavior Research Methods, 44(4):978–990.
Tracy Liederholm, Michelle Gaddy Everson, Paul van den Broek, Maureen Mischinski, Alex Crittenden, and Jay Samuels. 2000. Effects of causal text revi-sions on more-and less-skilled readers’ comprehension of easy and difficult texts. Cognition and Instruction, pages 525–556.
David McClosky, Eugene Charniak, and Mark Johnson. 2008. Bllip north american news text, complete. Lin-guistic Data Consortium.
Danielle S McNamara. 2001. Reading both high-coherence and low-high-coherence texts: Effects of text se-quence and prior knowledge. Canadian Journal of Experimental Psychology/Revue canadienne de psy-chologie exp´erimentale, 55(1):51.
Journal of Machine Learning Research, 12:2825– 2830.
Charles Perfetti and Gwen A. Frishkoff. 2008. The neural bases of text and discourse processing. In B. Stemmer and H. A. Whitaker (Eds.) Handbook of the Neuroscience of Language, pages 165–174. Cam-bridge:MA, Elsevier.
Ildik´o Pil´an, Elena Volodina, and Richard Johansson. 2014. Rule-based and machine learning approaches for second language sentence-level readability. In Pro-ceedings of the Ninth Workshop on Innovative Use of NLP for Building Educational Applications.
Emily Pitler and Ani Nenkova. 2008. Revisiting read-ability: A unified framework for predicting text qual-ity. In Proceedings of the Conference on Empirical
Methods in Natural Language Processing, EMNLP
’08, pages 186–195, Stroudsburg, PA, USA. Associ-ation for ComputAssoci-ational Linguistics.
Karthik Raghunathan, Heeyoung Lee, Sudarshan Ran-garajan, Nathanael Chambers, Mihai Surdeanu, Dan Jurafsky, and Christopher Manning. 2010. A multi-pass sieve for coreference resolution. InProceedings of the 2010 Conference on Empirical Methods in
Natu-ral Language Processing, pages 492–501. Association
for Computational Linguistics.
Randi Reppen, Nancy Ide, and Keith Suderman. 2005. American national corpus (anc) second release. Lin-guistic Data Consortium.
Evan Sandhaus. 2008. The new york times annotated corpus. Linguistic Data Consortium, Philadelphia, 6(12):e26752.
Sarah E Schwarm and Mari Ostendorf. 2005. Read-ing level assessment usRead-ing support vector machines and statistical language models. In Proceedings of the 43rd Annual Meeting on Association for Compu-tational Linguistics, pages 523–530. Association for Computational Linguistics.
Kathleen M Sheehan, Michael Flor, and Diane Napoli-tano. 2013. A two-stage approach for generating un-biased estimates of text complexity. In Proceedings of the Workshop on Natural Language Processing for Improving Textual Accessibility, pages 49–58. Kathleen M Sheehan, Irene Kostin, Diane Napolitano,
and Michael Flor. 2014. The textevaluator tool. The
Elementary School Journal, 115(2):184–209.
Xingyi Song and Trevor Cohn. 2011. Regression and ranking based optimisation for sentence level machine translation evaluation. In Proceedings of the Sixth
Workshop on Statistical Machine Translation, pages
123–129. Association for Computational Linguistics. A Jackson Stenner. 1996. Measuring reading
compre-hension with the lexile framework.
Kumiko Tanaka-Ishii, Satoshi Tezuka, and Hiroshi Ter-ada. 2010. Sorting texts by readability. Comput. Lin-guist., 36(2):203–227, June.
James Voss and Laurie Silfies. 1996. Learning from his-tory text: The interaction of knowledge and compre-hension skill with text structure. Cognition and In-struction, 14(1):45–68.
Kuansan Wang, Christopher Thrasher, Evelyne Viegas, Xiaolong Li, and Paul Hsu. 2010. An overview of microsoft web n-gram corpus and applications. June. Kristian Woodsend and Mirella Lapata. 2011. Learning
to simplify sentences with quasi-synchronous gram-mar and integer programming. In Proceedings of the Conference on Empirical Methods in Natural
Language Processing, EMNLP ’11, pages 409–420,