Proceedings of the 2nd Workshop on Deep Learning Approaches for Low-Resource NLP (DeepLo), pages 175–182 175
Inject Rubrics into Short Answer Grading System
Tianqi Wang1,3 Naoya Inoue1,3 Hiroki Ouchi3 Tomoya Mizumoto2,3 Kentaro Inui1,3 1 Tohoku University 2Future Corporation 3 RIKEN Center for Advanced Intelligence Project
{outenki,naoya-i,inui}@ecei.tohoku.ac.jp [email protected]
Abstract
Short Answer Grading (SAG) is a task of scor-ing students’ answers in examinations. Most existing SAG systems predict scores based only on the answers, including the model ( Ri-ordan et al., 2017) used as baseline in this paper, which gives the-state-of-the-art perfor-mance. But they ignore important evaluation criteria such as rubrics, which play a crucial role for evaluating answers in real-world situ-ations. In this paper, we present a method to inject information from rubrics into SAG sys-tems. We implement our approach on top of word-level attention mechanism to introduce the rubric information, in order to locate infor-mation in each answer that are highly related to the score. Our experimental results demon-strate that injecting rubric information effec-tively contributes to the performance improve-ment and that our proposed model outperforms the state-of-the-art SAG model on the widely used ASAP-SAS dataset under low-resource settings.
1 Introduction
Short Answer Grading (SAG) is the task of automatically evaluating the correctness of stu-dents’ answers to a given prompt in an examina-tion (Mohler et al., 2011). It would be beneficial particularly in an educational context where teach-ers’ availability is limited (Mohler and Mihalcea, 2009). Motivated by this background, SAG has been studied mainly with machine learning-based approaches, where the task is considered as in-ducing a regression model from a given set of manually scored sample answers (i.e., training in-stances). As observed in a variety of other NLP tasks, recently proposed neural models have been yielding strong results (Riordan et al.,2017).
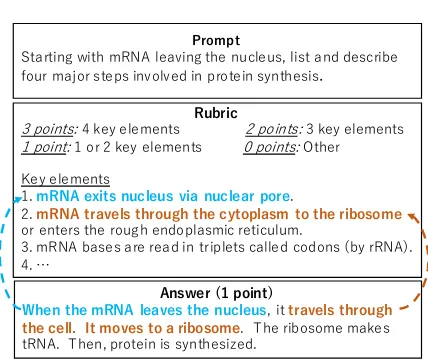
In general, a prompt is provided along with a scoring rubric. Figure1shows a typical example. Students are required to answer the steps involved
Prompt
Starting with mRNA leaving the nucleus, list and describe four major steps involved in protein synthesis.
Rubric
3 points: 4 key elements 2 points: 3 key elements 1 point: 1 or 2 key elements 0 points: Other
Key elements
1. mRNA exits nucleus via nuclear pore.
2. mRNA travels through the cytoplasm to the ribosome or enters the rough endoplasmic reticulum.
3. mRNA bases are read in triplets called codons (by rRNA). 4. …
Answer (1 point)
[image:1.595.309.523.211.392.2]When the mRNA leaves the nucleus, it travels through the cell. It moves to a ribosome. The ribosome makes tRNA. Then, protein is synthesized.
Figure 1: Example prompt and rubric from the ASAP-SAS dataset.
in protein synthesis. Each answer is scored based on a rubric, which contains several scoring criteria calledkey elements. Each of them stipulates dif-ferent aspects of the conditions for an answer to gain a score. Based on the number of the key el-ements mentioned in an answer, its final score is determined. In Figure1, the answer mentions two key elements, so it gains 1 point. Thus, rubrics and key elements play an essential role in SAG. Few previous studies, however, use information from rubrics for SAG.
In this paper, we present a method to incorpo-rate rubric information into neural SAG models. Our idea is to enable neural models to capture alignments between an answer and each key ele-ment. Specifically, we use a word-level attention mechanism to compute alignments and generate an attentional feature vector for each pair of an an-swer and a key element.
The contributions of this study is summarized as follows:
models.
• We propose a general framework to extend existing neural SAG models with a compo-nent for exploiting rubric information.
• Our empirical evaluation shows that our proposed model achieves a significant per-formance improvement particularly in low-resource settings.
2 Related Work
A lot of existing SAG studies have a main inter-est in exploring better representations of answers and similarity measures between student answers and reference answers. A wide variety of meth-ods have been explored so far, ranging from Latent Semantic Analysis (LSA) (Mohler et al., 2011), edit distance-based similarity, and knowledge-based similarity using WordNet (Pedersen et al., 2004) (Magooda et al.,2016) to word embedding-based similarity (Sultan et al., 2016). Recently, Riordan et al. (2017) report that neural network-based feature representation learning (Taghipour and Ng,2016) is effective for SAG.
In contrast to the popularity of learning answer representations, the use of rubric information for SAG has been gained little attention so far. In Sak-aguchi et al.(2015), the authors compute similar-ities, such as BLEU (Papineni et al., 2002), be-tween an answer and each key element in a rubric, and use them as features in a support vector regres-sion (SVR) model. Ramachandran et al. (2015). Ramachandran et al.(2015) generates text patterns from top answers and rubrics, and reports the au-tomatically generated pattern performances better than manually generated regex pattern. Neverthe-less, it still remains an open issue (i) whether a rubric is effective or not even in the context of a neural representation learning paradigm (Riordan et al., 2017), and (ii) what kinds of neural archi-tectures should be employed for the efficient use of rubrics.
Another issue in SAG is on low-resource set-tings. Heilman and Madnani (2015) investigate the importance of the training data size on non-neural SAG models with discrete features. Hor-bach and Palmer(2016) show that active learning is effective for increasing useful training instances. This is orthogonal to our approach: combining ac-tive learning with our rubric-aware SAG model is an interesting future direction.
Answer
Key element1
Key element2
…
Key element 𝐾
𝒌𝟏
𝒌𝟐
…
𝒌𝑲
Base Component
Rubric Component
Embedding
Score
Regression
𝒂
Merge 𝒇
𝒇𝒂 𝒇𝒓
Encoder 𝒇𝟏𝒓
𝒇𝟐𝒓
𝒇𝑲𝒓
Concat Encoder
Encoder Embedding
Embedding Embedding
… …
[image:2.595.312.524.60.226.2]…
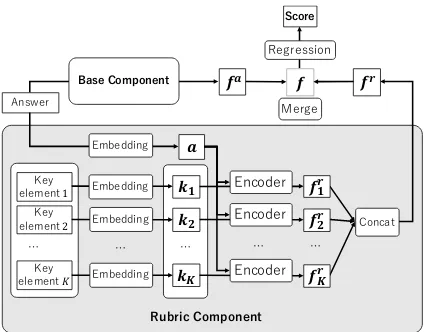
Figure 2: The proposed rubric-aware SAG architecture, consisting of base component and rubric component.
3 Proposed model
3.1 Overall architecture
Figure 2 illustrates our proposed model, which consists of (i)base componentand (ii)rubric com-ponent.
We assume the base component encodes an an-swer into a feature vectorfa. We also assume that a given rubric stipulates a set of key elements in natural language. We build a rubric component
to encode rubric information, based on the rele-vance between the answeraand each key element
k∈ {k1, k2,· · ·, kK}provided in the rubric.
The rubric component first encodes each key element that consists of m words, k = (w1, w2,· · · , wm), into its feature vectorkand the
answeraintoa. Then, it computes the relevance between the given answeraand each key element
k∈ {k1, k2,· · ·, kK}using a word-level attention
mechanism, and generates attentional feature vec-torsf1r,· · · ,fKr, which represent the aggregated information of each key element. A rubric fea-ture fr is generated based on the obtainedK at-tentional feature vectors. Finally, fa and fr are merged into one vectorf, which is used for scor-ing:
score(a) =βsigmoid(w·f +b), (1)
where w is a parameter vector, β is a prompt-specific scaling constant, andbis a bias term.
… …
[image:3.595.314.525.57.326.2]Embeddings Bi-LSTM Pooling
Figure 3: The base component.
important to note that our framework is encoder-agnostic; namely, any answer encoder that pro-duces a fixed-length feature vector can be used as the base component.
3.2 Base component
As the base component, we employ the neural SAG model proposed by Riordan et al. (2017), which is the state-of-the-art SAG system among published methods. As shown in Figure 3, this model consists of three layers, namely (i) the embedding layer, (ii) the BiLSTM (bidirectional Long Short-Term Memory (Schuster and Paliwal, 1997)) layer and (iii) the pooling layer.
Given an answera= (w1, w2, ..., wn), the
em-bedding layer outputs a vectoreai ∈ Rdfor each word wi. Taking a sequence of these vectors
(ea1,ea2,· · · ,ean)as input, the BiLSTM layer then produces a contextualized vector fa
i = [ − →
hi; ←−
hi]
for each word, where−→hi ∈ Rh,
←−
hi ∈ Rh are the hidden states of the forward and backward LSTM, respectively. Finally, the pooling layer averages these contextualized vectors to obtain a feature vector for the answer as follows:
fa= 1
n
n X
i=1
fia (2)
3.3 Rubric component
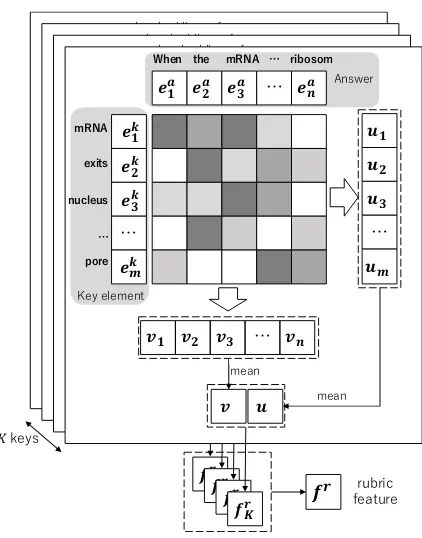
Inspired byChen et al.(2016), we compute word-level attention between each key element and an given answer as illustrated in Figure4. The rubric component captures how relevant a key element is to the given answer in this way.
Given word embedding sequences of an answer (ea1,e2a,· · · ,ean) and a key element (ek1,ek2,· · · ,ekm), the rubric component first cal-culates the word-level attention between eki and
eaj:
• Calculate the inner-products between word
𝒆𝟏𝒌𝒎
𝒆𝟐𝒌𝒎
𝒆𝟑𝒌𝒎
…
𝒆𝒍𝒌𝒎
𝒆𝟏𝒂 𝒆 𝟐
𝒂 𝒆
𝟑
𝒂 … 𝒆
𝒏 𝒂
𝒗𝟏 𝒗𝟐 𝒗𝟑 … 𝒗𝒏 word embeddings of answer𝒂
wo rd em b ed d in g s of K -th ke y el em en t
𝒇𝑲𝒓
𝒖𝟏 𝒖𝟐 𝒖𝟑 … 𝒖𝒍 𝒗 𝒖 mean mean 𝒆𝟏𝒌𝒎
𝒆𝟐𝒌𝒎
𝒆𝟑𝒌𝒎
…
𝒆𝒍𝒌𝒎
𝒆𝟏𝒂 𝒆 𝟐
𝒂 𝒆
𝟑
𝒂 … 𝒆
𝒏 𝒂
𝒗𝟏 𝒗𝟐 𝒗𝟑 … 𝒗𝒏 word embeddings of answer𝒂
wo rd em b ed d in g s of K -th ke y el em en t
𝒇𝑲𝒓
𝒖𝟏 𝒖𝟐 𝒖𝟑 … 𝒖𝒍 𝒗 𝒖 mean mean 𝒆𝟏𝒌𝒎
𝒆𝟐𝒌𝒎
𝒆𝟑𝒌𝒎
…
𝒆𝒍𝒌𝒎
𝒆𝟏𝒂 𝒆 𝟐
𝒂 𝒆
𝟑
𝒂 … 𝒆
𝒏 𝒂
𝒗𝟏 𝒗𝟐 𝒗𝟑 … 𝒗𝒏 word embeddings of answer𝒂
wo rd em b ed d in g s of K -th ke y el em en t
𝒇𝑲𝒓
𝒖𝟏 𝒖𝟐 𝒖𝟑 … 𝒖𝒍 𝒗 𝒖 mean mean 𝒗𝟏 𝒗𝟐 𝒗𝟑 … 𝒗𝒏
𝒇𝑲𝒓
𝒖𝟏 𝒖𝟐 𝒖𝟑 … 𝒖𝒎 𝒗 𝒖 mean mean Answer
𝒇𝒓 rubric feature
Key element
When the mRNA … ribosom
𝒆𝟏𝒌
𝒆𝟐𝒌
𝒆𝟑𝒌
…
𝒆𝒎𝒌
mRNA
exits
nucleus
…
pore
𝒆𝟏𝒂 𝒆 𝟐
𝒂 𝒆
𝟑
𝒂 … 𝒆
𝒏 𝒂
[image:3.595.99.258.59.167.2]𝐾keys
Figure 4: Calculation of rubric feature based on word-level attention. Words of answers lay on x-axes, and words of the key elements lay on y-axes.
embeddings from the answer and key ele-ment:zi,j =eki ·eaj
• Calculate softmax ofzi,j over the rows and
columns respectively:
αki =softmax(zi,1, zi,2,· · · , zi,n) (3)
αaj =softmax(z1,j, z2,j,· · · , zm,j)(4)
Note thatαki ∈ Rn stands for the attention from
thei-th word of a key element to each word in the answera. Similarly, αa
j ∈ Rm stands for the
at-tention from thej-th word of answer to each word in the key elementk.
Next, attentional vectors of key-to-answer (v) and answer-to-key (u) are calculated by the sum of word embeddings weighted by αa and αk as follows:
u= 1
m m X i=1 n X j=1
αi,jk eaj (5)
v= 1
n n X j=1 m X i=1
αaj,ieki (6)
Intuitively, vectors u and v are the aggregation of answer tokens that are highly relevant to a key element, and tokens in the key elements that are highly relevant to the answer. We then concatenate
Finally, we generate feature vectorsf1r,· · · ,fKr
for all key elements in this manner, and then gen-erate rubric featurefrbased on them.
3.4 Merge features
We introduce two methodologies to mergefaand
frinto one single featuref.
Concatenation We concatenatefaandfr:
fr = [f1r;f2r;...;fKr] (7)
f = [fa;fr],f ∈R2h+2dK (8)
In this case, we expect the regression layer learns weights for the two feature space at the same time.
Weighted Sum Besides, we introduce a
train-able parameter λ, which represents the influence of the rubric component. We then generate a rubric-aware answer feature as follows:
fr = 1
K
K X
i=1
fir (9)
f =λfa+ (1−λ)(frM),f ∈R2h,(10)
whereM ∈ R2d×2his a transformation matrix to
learn, projectingfrto the space offa. To reduce parameters to learn, we compute fr by average instead of concatenation. λis initialized with 0.5 in our experiments.
Finally, the answer a is scored as follows: score(a) = βsigmoid(w·f + b), where w ∈
R2h+2dK (orw ∈ R2h for ‘weighted sum’ strat-egy) is a model parameter, β is a prompt-specific scaling constant, andbis a bias term.
4 Experiments
4.1 Settings
We apply the proposed model on a widely-used, rubric-rich ASAP-SAS dataset2, which includes 10 prompts, with 2,226 answers for each prompt on average, including around 1,704 training data and 522 test data. In this paper, we choose the prompts 1, 2, 5, 6 and 10, where key elements are explicitly provided in their rubric, and we ran-domly take 20% of answers from the training data as the development data. On average, we have 1,308 answers as training data, 327 answers as de-velopment data and 545 answers as test data.
2https://www.kaggle.com/c/asap-sas/
data
0.550 0.600 0.650 0.700 0.750 0.800
12.50% 25% 50% 75% 100%
[image:4.595.310.524.65.194.2]Base +Rubric (concat) +Rubric (weighted sum)
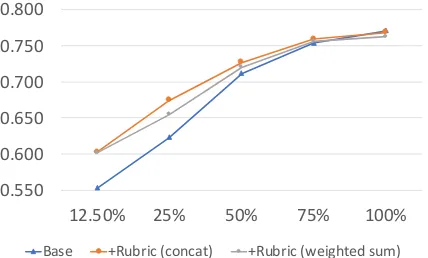
Figure 5: Mean performance across different size of training data. The performance is shown in average QWK over all prompts.
For both the base and rubric components, we use 300-dimensional GloVe embeddings pre-trained on Wikipedia and Gigaword5 (Pennington et al.,2014) to initialize the word embedding layer (d = 300), and update them during the training phase.
For the bi-LSTM layer of base component, we seth = 256, set the dropout probability for linear transformation as 0.5, and set the dropout proba-bility for recurrent state as 0.1, following the set-ting of (Riordan et al.,2017).
Mean Squared Error (MSE) is used as the loss function, and optimized by RMSprop optimizer with a learning rate of 0.001. The batch size is set to 32.
The model is trained on each prompt. We first train the base component, then fix the base com-ponent and train the whole model, and run the training phase for 50 epochs to choose the best model on the development data. For each prompt, we repeat the experiments 5 times with differ-ent random seeds from 0 to 4 for initialization, and evaluate the model with Quadratic Weighted Kappa (QWK) independently, then we take aver-age QWK over all the random seeds as the final performance of the model on the corresponding prompt.
To evaluate the robustness of our model in low-resource settings, we train our model on various sizes of the training data (12.5%, 25%, 50%, 75% and 100%).
4.2 Results
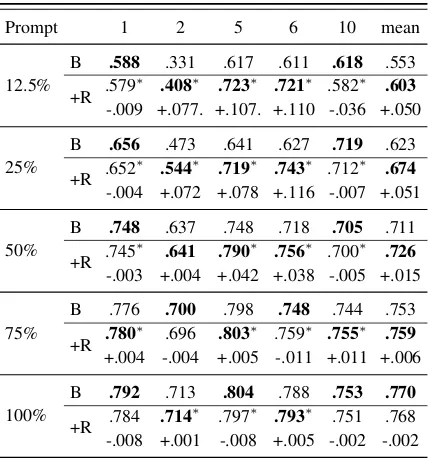
Table 1: Performance across different sizes of training data. ∗indicates a statistically significant improvement by Wilcoxon’s signed-rank test (p <0.05).1 ‘B’ indicates baseline, and ‘+R’ indicates our model (base component + rubric component)
(a) Merge base feature and rubric feature by concatenation.
Prompt 1 2 5 6 10 mean
12.5%
B .588 .331 .617 .611 .618 .553
+R .579 ∗
.408∗ .723∗ .721∗ .582∗ .603 -.009 +.077. +.107. +.110 -.036 +.050
25%
B .656 .473 .641 .627 .719 .623
+R .652 ∗
.544∗ .719∗ .743∗ .712∗ .674 -.004 +.072 +.078 +.116 -.007 +.051
50%
B .748 .637 .748 .718 .705 .711
+R .745 ∗
.641 .790∗ .756∗ .700∗ .726 -.003 +.004 +.042 +.038 -.005 +.015
75%
B .776 .700 .798 .748 .744 .753
+R .780 ∗
.696 .803∗ .759∗ .755∗ .759 +.004 -.004 +.005 -.011 +.011 +.006
100%
B .792 .713 .804 .788 .753 .770
+R .784 .714 ∗
.797∗ .793∗ .751 .768 -.008 +.001 -.008 +.005 -.002 -.002
(b) Merge base feature and rubric feature by weighted sum.
Prompt 1 2 5 6 10 mean
12.5%
B .588 .331 .617 .611 .618 .553
+R .599 ∗
.424∗ .689∗ .679∗ .617 .602 +.012 +.093 +.073 +.068 -.001 +.049
25%
B .656 .473 .641 .627 .719 .623
+R .661 ∗
.529∗ .687∗ .697∗ .698 .654 +.005 +.056 +.046 +.070 -.020 +.031
50%
B .748 .637 .748 .718 .705 .711
+R .747 ∗
.643 .784∗ .723∗ .702∗ .720 +.000 +.006 +.036 +.006 -.004 +.009
75%
B .776 .700 .798 .748 .744 .753
+R .783 ∗
.704 .787∗ .750∗ .784∗ .762 +.007 +.004 -.010 +.002 +.040 +.009
100%
B .792 .713 .804 .788 .753 .770
+R .789 .695 ∗
.786∗ .790∗ .748 .762 -.003 -.018 -.018 +.002 -.005 -.008
the best performance of QWK0.773 on the cor-responding 5 prompts reported in (Riordan et al., 2017). This indicates that we successfully repli-cated their best performing model.
Also, by adding the rubric component (‘+Rubric’), the performance was improved especially when less training data is available. This suggests that the rubric component compen-sates the lack of training data. This is consistent with (Sakaguchi et al., 2015), a non-neural counter-part of our study.
Performance on each prompt is shown in Ta-ble1. The results indicate that the benefit we ob-tain from rubric component varies with prompts. For instance, we achieve more improvements on prompt 2, 5 and 6 compared to the others. One of the reasons is that the rubrics vary on prompts. For instance in prompt 5 and 6, all key elements with which an answer can get points are listed, while in prompt 10 only four example answers are pro-vided.
4.3 Analysis
Contribution of components Figure5
demon-strates that when trained with full training data, our rubric-aware model (‘+Rubric’) achieved a comparable performance to the base component. To reveal reasons for this, we conduct two
analy-ses.
First, for ‘+Rubric (concat)’, we investigate the distribution of the learned weights of regression layer corresponding to the base and rubric compo-nents following the idea fromMeftah et al.(2019). The distribution is shown in Figure 6. When the model was trained on 100% training data, the weights for the rubric component were closer to 0, while the weights for the base component were more dispersed (Figure6b), compared to the dis-tribution for 12.5% training data (Figure6a).
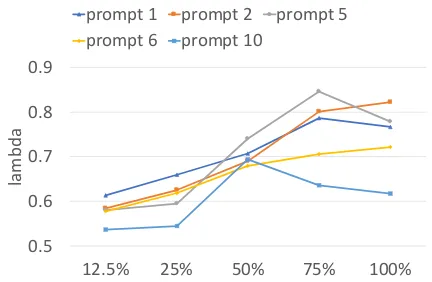
Second, for ‘+Rubric (weighted sum)’, we plot the values of trained λin Figure 7, representing the weights of base component. Generally, the val-ues ofλgrow with data size, which is consistent with Figure 6. This means that as training data increases, the rubric component makes less contri-bution to the performance, thus little improvement was obtained from the rubric component. Ad-dressing this issue is an interesting direction of our future research.
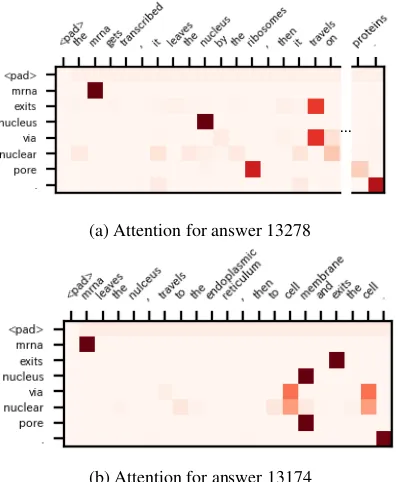
[image:5.595.307.519.125.352.2]Table 2: Instance 1-point answers.
ID Answer Score Base +Rubric
13278
the mRNA gets transcribed, it leaves the nucleus by the ribosomes, then it travels on the Endocplasmic reticulum, and goes to the lysomes and gets translated to proteins.
1 0 1
13174 mRNA leaves the nulceus, travels to the endoplasmic reticulum, then
to cell membrane and exits the cell 1 0 0
(a) Training data size: 12.5%
(b) Training data size: 100%
Figure 6: Value distribution of learned weights of re-gression layer corresponding to base and rubric com-ponent for prompt 5.
by the baseline.
The corresponding prompt and its rubric are shown in Figure 1. Both the answers only con-tain the first key element provided in rubric. The first answer is graded as 1-point correctly while the second is graded as 0-points.
The word-level attention shown in Figure8 in-dicates how the proposed model identified the rel-evancy of the answer towards the key element. Figure8ashows that the model successfully found words and phrases most related to the key element, helping the model improve the performance. On the other hand, Figure 8b shows that the model incorrectly aligned words in the answer and key element. Specifically, the model alignedexistsin
0.5 0.6 0.7 0.8 0.9
12.5% 25% 50% 75% 100%
lam
bd
a
[image:6.595.89.276.88.496.2]prompt 1 prompt 2 prompt 5 prompt 6 prompt 10
Figure 7: Values ofλtrained by various of data size.
the answer with existsin the key element. How-ever, these two verbs should not be aligned be-cause their objects are different from each other (i.e. the cellin the answer, butnucleusin the key element). Because the attention is calculated on word-level, the model tends to simply find similar words that appear in the key element, ignoring the context around the words.
5 Conclusion
Rubrics play a crucial role for SAG but have at-tracted little attention in the SAG community. In this paper, we present an approach for incorporat-ing rubrics into neural SAG models. We replicated a state-of-the-art neural SAG model as the base component, and injected rubrics (key elements) through the rubric component as an extension. In the low-resource setting where the base compo-nent had difficulty learning key elements directly from answers, our experimental results showed that the rubric component significantly improved the performance of SAG. When all training data was used, the rubric component did not have a negative effect on the overall performance.
[image:6.595.309.525.184.325.2]at-…
(a) Attention for answer 13278
[image:7.595.81.280.65.306.2](b) Attention for answer 13174
Figure 8: Word-level attention. Words of answers lay on x-axes, and words of the key element lay on y-axes.
tention. Moreover, other types of rubrics could be explored in the SAG task, especially for prompts where key elements are not provided explicitly. We also expect to obtain a further improvement when full training data is available, by increasing the weights of rubric component feature, as dis-cussed in Figure6. Beyond SAG, we would like to explore approaches for generating feedback based on the computed attention to key elements.
References
Qian Chen, Xiaodan Zhu, Zhenhua Ling, Si Wei, Hui Jiang, and Diana Inkpen. 2016. Enhanced lstm for natural language inference. arXiv preprint arXiv:1609.06038.
Michael Heilman and Nitin Madnani. 2015. The im-pact of training data on automated short answer scor-ing performance. InProceedings of the Tenth Work-shop on Innovative Use of NLP for Building Educa-tional Applications, pages 81–85.
Andrea Horbach and Alexis Palmer. 2016. Investigat-ing active learnInvestigat-ing for short-answer scorInvestigat-ing. In Pro-ceedings of the 11th Workshop on Innovative Use of NLP for Building Educational Applications, pages 301–311.
Ahmed Ezzat Magooda, Mohamed A Zahran, Mohsen Rashwan, Hazem M Raafat, and Magda B Fayek. 2016. Vector based techniques for short answer grading. InFLAIRS Conference, pages 238–243.
Sara Meftah, Youssef Tamaazousti, Nasredine Sem-mar, Hassane Essafi, and Fatiha Sadat. 2019. Joint learning of pre-trained and random units for domain adaptation in part-of-speech tagging. arXiv preprint arXiv:1904.03595.
Michael Mohler, Razvan Bunescu, and Rada Mihal-cea. 2011. Learning to grade short answer ques-tions using semantic similarity measures and depen-dency graph alignments. InProceedings of the ACL, pages 752–762. Association for Computational Lin-guistics.
Michael Mohler and Rada Mihalcea. 2009. Text-to-text semantic similarity for automatic short answer grading. In Proceedings of the EACL, pages 567– 575. Association for Computational Linguistics.
Kishore Papineni, Salim Roukos, Todd Ward, and Wei-Jing Zhu. 2002. Bleu: a method for automatic eval-uation of machine translation. In Proceedings of the 40th annual meeting on association for compu-tational linguistics, pages 311–318. Association for Computational Linguistics.
Ted Pedersen, Siddharth Patwardhan, and Jason Miche-lizzi. 2004. Wordnet:: Similarity: measuring the relatedness of concepts. In Demonstration papers at HLT-NAACL 2004, pages 38–41. Association for Computational Linguistics.
Jeffrey Pennington, Richard Socher, and Christopher Manning. 2014. Glove: Global vectors for word representation. InProceedings of the 2014 confer-ence on empirical methods in natural language pro-cessing (EMNLP), pages 1532–1543.
Lakshmi Ramachandran, Jian Cheng, and Peter Foltz. 2015. Identifying patterns for short answer scoring using graph-based lexico-semantic text matching. In Proceedings of the Tenth Workshop on Innovative Use of NLP for Building Educational Applications, pages 97–106.
Brian Riordan, Andrea Horbach, Aoife Cahill, Torsten Zesch, and Chong Min Lee. 2017. Investigating neural architectures for short answer scoring. In Proceedings of the 12th Workshop on Innovative Use of NLP for Building Educational Applications, pages 159–168.
Keisuke Sakaguchi, Michael Heilman, and Nitin Mad-nani. 2015. Effective Feature Integration for Au-tomated Short Answer Scoring. In Proceedings of NAACL, pages 1049–1054.
Mike Schuster and Kuldip K Paliwal. 1997. Bidirec-tional recurrent neural networks. IEEE Transactions on Signal Processing, 45(11):2673–2681.