warwick.ac.uk/lib-publications
Original citation:
Kiraci, Ercihan, Franciosa, Pasquale, Warnett, Jason, Attridge, A. and Williams, M. A. (Mark
A.) (2017) Non-reproducible alignment and fitting algorithm effects on Laser Radar
measurement. In: I2MTC 2017 IEEE International Instrumentation and Measurement
Technology Conference, Torino, Italy, 22-25 May 2017 pp. 1-5.
Permanent WRAP URL:
http://wrap.warwick.ac.uk/90320
Copyright and reuse:
The Warwick Research Archive Portal (WRAP) makes this work by researchers of the
University of Warwick available open access under the following conditions. Copyright ©
and all moral rights to the version of the paper presented here belong to the individual
author(s) and/or other copyright owners. To the extent reasonable and practicable the
material made available in WRAP has been checked for eligibility before being made
available.
Copies of full items can be used for personal research or study, educational, or not-for profit
purposes without prior permission or charge. Provided that the authors, title and full
bibliographic details are credited, a hyperlink and/or URL is given for the original metadata
page and the content is not changed in any way.
Publisher’s statement:
© 2017 IEEE. Personal use of this material is permitted. Permission from IEEE must be
obtained for all other uses, in any current or future media, including reprinting
/republishing this material for advertising or promotional purposes, creating new collective
works, for resale or redistribution to servers or lists, or reuse of any copyrighted component
of this work in other works.
A note on versions:
The version presented here may differ from the published version or, version of record, if
you wish to cite this item you are advised to consult the publisher’s version. Please see the
‘permanent WRAP url’ above for details on accessing the published version and note that
access may require a subscription.
Non-reproducible alignment and fitting algorithm
effects on Laser Radar measurement
E Kiraci
WMG, University of Warwick Coventry, UK, CV4 7AL Email: [email protected] Telephone: (+44) 024 76575991
P. Franciosa and J A Warnett
WMG, University of Warwick Coventry, UK, CV4 7AL Email: [email protected],
[email protected] Telephone: (+44) 024 76573422
A Attridge and M A Williams
WMG, University of Warwick Coventry, UK, CV4 7AL Emails: [email protected],
[email protected] Telephone: (+44) 024 76150755
Abstract—Ever-increasing introduction of new production technologies has significantly reduced manufacturing cycle time in recent years, especially joining technologies. For many indus-tries, Zero Defect Manufacturing (ZDM) is considered as a key strategy to improve Right -First -Time (RFT) capability with a minimum waste of resources. There is a growing desire to move from off-line sample measurement to in-line data collection, which will only be possible with fast, accurate measurement technologies. Although metrology cycle times have improved with in-line measurement systems, their accuracy is not sufficient to meet the tight tolerance demands of typical high value manufacturing applications. A major obstacle to the uptake of new, non-contact measurement technologies is the difficultly in evaluating system capability in terms of repeatability, accuracy and calibration to recognized standards. This study considers these characteristics for a Laser Radar (LR) measurement system applied to an automotive door measurement task. To evaluate these factors, the authors consider: (1) the effect of tooling ball (TB) position and movement on part alignment and measurement feature results and (2) the feature-fitting algorithms applied to different sizes and orientations of hole. The results show that the statically-mounted LR is good at developing a repeatable coordinate system for the workpiece. Offsetting an individual TB had a statistically significantly effect on the repeatability of the measurement results. A number of feature-fitting algorithms were studied, with no algorithm providing a definitively superior result. Two data capture algorithm were considered; hatched and petal algorithm. The petal pattern algorithm is much faster, and was found to provide comparably repeatable results as the hatched pattern algorithm. These results give confidence that the LR system demonstrates good repeatability.
I. INTRODUCTION
In recent years, manufacturing companies have adopted a Zero Defect Manufacturing (ZDM) approach to reduce product defects and to improve Right-First-Time (RFT) capability with minimum waste of resources [1]–[3]. In order to achieve ZDM, data collection alone is not sufficient; data mining methods are critical to evaluate the inherent variation of manufacturing processes. During New Product Introduction (NPI), Statistical Process Control (SPC) and similar tools are used to iden-tify and eliminate defects from occurring/reoccurring. In the automotive industry inspection is typically performed using Coordinate Measuring Machines (CMMs) [4], [5] that provide high accuracy and repeatability, but are housed in dedicated off-line facilities that require a controlled environment [6], [8].
This off-line process is time consuming and only a limited number of samples can be measured. There is a rising trend to move away from off-line sample measurement to in-line data collection in order to predict defects before they happen or identify trends in the production process [9], [10].
Over the last decade, in-line metrology solutions have be-come increasingly advanced and automated and more prevalent in manufacturing systems [11]. Although the potential oppor-tunities of in-line measurement systems are clear, there are a number of challenges to be addressed if their benefits are to be realised across a range of production applications. Components with high manufacturer tolerances present a big challenge in terms of accuracy and repeatability. Determining measurement uncertainty for a specific measurement task through use of CMMs is well defined for running comparisons with non-contact measurement systems [12], which are a sensitive to typically material conditions such as surface reflectivity and colour [13], [14]. It is important to control environmental factors such as temperature, vibration and lighting so the impact on measurement is minimised. In automotive industry, the measurement time of a workpiece has become dramatically greater than before because of the increasing complexity of manufactured parts. This makes it more difficult to use non-contact technologies as an in-line measurement system in order to perform measurement within process cycle time, which are generally around 70 seconds or less.
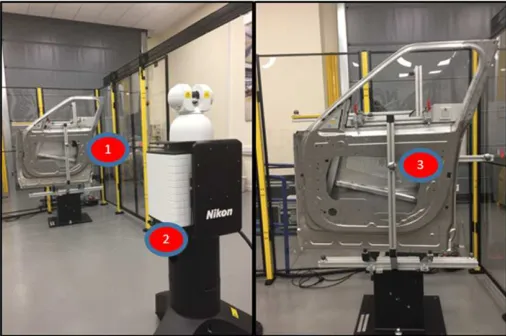
Fig. 1: Experiment Set-up (Labels: 1.Workpiece, 2.LR, 3 TBs)
the workpiece is closely sampled. Both are sources of mea-surement uncertainty because of sampling strategy; hence, the effect of the sampling must be accounted for when determining the combined standard uncertainty of a measurement system [6], [15].
In a previous study, the authors demonstrated LR as an in-line metrology system in the context of Body-In-White inspection process [16]. The objective of this paper is to evaluate the impact of non-reproducible alignment and fitting algorithm selection on measurement results. The automotive artefact selected for this study was an aluminium automotive door assembly (Jaguar Land Rover Limited, UK) on fixture as seen Fig.1.
II. MATERIALS ANDMETHODS
MV330 Laser Radar (Nikon Metrology, UK) was used in this measurement study. It has two rotary axes, azimuth and el-evation, controlled by separate encoder feedback and a unique range measurement achieved by comparing two wave forms of an infrared (IR) laser beam with a frequency modulated chip. The LR mixes the IR energy reflected off the workpiece with an internal IR signal to measure the maximum return energy. Laser interferometry was used to calibrate the range based on ASME B89.4.19 [17]. The resolution of Azimuth and Elevation are 0.018mm and 0.039arcs-sec respectively, with an expanded uncertainty (k=2) of 6.8µm/m. Polyworks 2016 IR4 software (InnovMetric Software Inc., QC, Canada) was used for the LR measurement programme. For the fitting algorithm, two different algorithms were used; which are Petal Pattern and Surface Scan. Petal Pattern algorithm was used as developed by Nikon Metrology. A number of scan lines are taken across the hole with filters applied to remove points that are on hole chamfers and at the bottom of holes. Five scans were used for fitting circles in this study. Surface scan, developed by Polyworks does a box scan around the circle to create a point cloud in order to extract the measured circle from the data and nominal values. When extracting measurement features from a point cloud, three methods can
be used to specify how the feature should be fit. In this study, the Min method was selected so the feature is fit such that no points are enclosed by primitive. There are three parameters identified to fit the circle; point spacing, line spacing, and scanning zone. In this study, these are 0.1mm, 1mm, 5mm clearance to the hole respectively.
A. Experimental set-up
The automotive artefact was located on the fixture for the duration of the study in a temperature control environment at 22◦C±1◦C. The LR required two levels of alignment. To define the alignment of the workpiece four holes were mea-sured and aligned using the centre points alignment method to transfer the coordinate frame of the LR into the local part coordinate frame of the workpiece (car-line alignment). The six TBs (Grade 25, spherically 0.6µm and±2.54µm diameter tolerance) positions were then determined relative to the local coordinate system and set as secondary reference points. It can rescan these TBs as targets in order to update the LR position. In summary, the LR could locked back into the same alignment using just the TBs. Then, these six TBs were measured to update the datum for each run.
B. Reproducibility
For the reproducibility test seven features were measured: one hole, two slots, two surface points, and one matte TB were measured based on each new alignment. There are two parts for reproducibility experiment, First, six matte TBs were used for alignment for the first thirty measurements. In the following measurements, each TB position was altered by putting a metal shim (thickness of 0.004inch = 101.6µm) between one TB and the holder. The same alignment procedure was carried out and the six features were measured. This was repeated for each of the six TBs used for alignment. Finally, matte TBs were replaced with shiny ones for the last thirty measurements. The second part of the experiment is to understand effect of number of TBs used on alignment on measurement result, the number of TBs were not included each time to the alignment procedure.
C. Fitting Algorithms
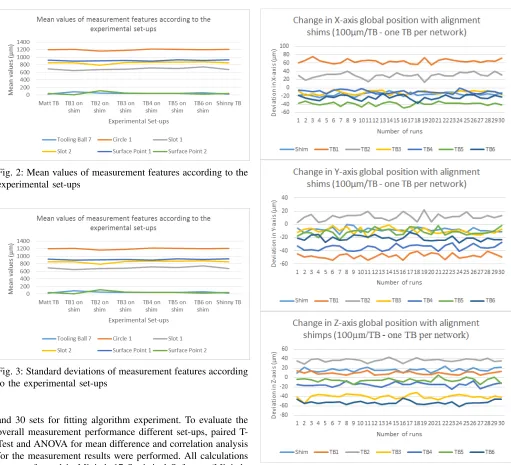
Fig. 2: Mean values of measurement features according to the experimental set-ups
Fig. 3: Standard deviations of measurement features according to the experimental set-ups
and 30 sets for fitting algorithm experiment. To evaluate the overall measurement performance different set-ups, paired T-Test and ANOVA for mean difference and correlation analysis for the measurement results were performed. All calculations were performed in Minitab 17 Statistical Software (Minitab, State College, PA: Minitab, Inc.)
III. RESULTS
The reproducibility experiment showed no significant sta-tistical difference (both p-values is bigger than 0.05) between using matt and shiny TBs for alignment to the workpiece. Similarly, altered tooling ball position each time with a metal shim (101.6µmm) had no considerable impact on means of measurement features and standard deviation as seen Fig.2 and Fig.3. This is important to manufacturers if anything happens in the measurement set-up, especially large-volume manufacturing; updating the LR position by rescanning TBs is sufficient to maintain the measurement accuracy without the need for recalibration. For example, physical knocking of a TB and replacement could happen in any production environment. However, changing each TB showed a method change and
Fig. 4: Change in co-ordinate axis one TB per network
shift in results; hence, this change is small and the range up to 75µm in any direction, as shown in Fig.4.
Fig. 5: The number of points in the scan that were being used within the extraction by Petal (A) and Hatch algorithm (B)
Fig. 6: Circles deviation compared to reference hatch fitting pattern
is 25µm in absolute value, this could be sufficient for a number of applications where there are high cycle times.
To measure a hole with petal pattern algorithm took 3s for the 5.2mm diameter of the hole (the smallest hole in the experiment), 5s for the 60mm diameter of the hole (the largest hole in the experiment). The time measuring with hatch pattern comparing with the petal pattern algorithm took three times more for the smallest hole (10s), eleven times more for the 20.11mm diameter of the hole (53s), and 44 times more for the largest hole (215s). The repeatability of the circle measurements was also considered for each pattern as seen in Fig.6. Here it is seen that the standard deviation of 30 measurements were similar across all patterns. The gain in time advantages and similar repeatability makes the petal algorithm an attractive prospect.
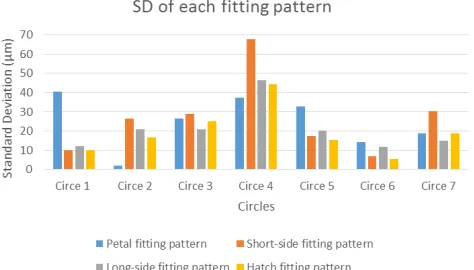
The hatch fitting pattern is currently preferred method in LR. The measurements of seven circles were compared via the hatching fitting against long-side, short-side and petal-pattern fitting as shown in Fig.7. Here it is observed that the long and short-side patterns differed by up to 8%. With the exception of circle 1, the petal pattern had a maximal deviation of 11%. However, the time to measure a hole with hatch pattern is twice as long as either long side or short-side pattern because hatch pattern combines long and short-side pattern as seen Figure 8. Apart from Circle 1, petal-pattern algorithm did not deviate more than 11%; thus is quite good result if compared with the number of points collected and little time for performing measurement.
Fig. 7: Comparison of standard deviations for fitting patterns
IV. CONCLUSION
The alignment procedure could determine the coordinate system locations relative to the workpiece. Any variability in the coordinate system will contribute the uncertainty of other measurements on the workpiece. Based on study results, the LR is good at developing repeatable coordinate system for the part. It was found that offsetting the TB didnt significantly impact the measurement result but there was a shift in co-ordinate axes up to 100m. Petal pattern is considered an alternative due to time saving. Clearly, it is repeatable and the variance potential is up to 11% the featured measured. Where the cycle time of hatch is too long, means that petal might be viable depends on feature tolerances. Future work needs to be done to use a calibrated artefact and to scan different kind of features, such as round slots, with manufactured by different manufacturing technologies, such as machining, punching. This will help to identify which algorithm is more accurate.
ACKNOWLEDGMENT
This work was carried out as part of the Product Evaluation Technologies Group, within WMG, part funded by the High Value Manufacturing Catapult. The authors would also like to acknowledge the support of Roger Holden, Paul Lightowler, Thomas Rook at Nikon Metrology UK.
REFERENCES
[1] D. Lambert, Zero-inflated Poisson regression, with an application to defects in manufacturing, Technometrics 34.1, 1992, pp.1-14.
[2] KS. Wang, Towards Zero-Defect Manufacturing (ZDM) a data mining approach, Advances in Manufacturing, 2013 Mar, no:1, pp.62-74. [3] G. Koksal, Batmaz, MC. Testik, A review of data mining applications
for quality improvement in manufacturing industry, Expert systems with Applications, Sep 2011, 38(10), pp.13448-67
[4] S. Martinez, E. Cuesta, J. Barreiro, B Alvarez, Methodology for com-parison of laser digitizing versus contact systems in dimensional control, Opt Lasers Eng, 2010, Volume 48, pp.1238-1246..
[5] B. Muralikrishnan, W. Ren, D. Everett, E Stanfield, T. Doiron, Dimen-sional metrology of bipolar fuel cell plates using laser spot triangula-tion probes, Measurement Science and Technology, June 2011, 22 (7), pp.075102.
[6] RJ. Hocken, PH. Pereira, editors. Coordinate measuring machines and systems, CRC Press; April 2016.
[image:5.612.58.295.183.318.2][8] S. Martnez, Cuesta E, Barreiro J, B. lvarez, Methodology for comparison of laser digitizing versus contact systems in dimensional control, Optics and Lasers in Engineering, Dec 2010, 31;48(12), pp. 1238-46.. [9] G. Michalos, S. Makris, N. Papakostas, D. Mourtzis, G. Chryssolouris,
Automotive assembly technologies review: challenges and outlook for a flexible and adaptive approach, CIRP Journal of Manufacturing Science and Technology, Dec 2010, 31;2(2), pp.81-91
[10] J.Jamshidi, A. Kayani, P. Iravani, PG. Maropoulos, MD. Summers, Manufacturing and assembly automation by integrated metrology systems for aircraft wing fabrication, Proceedings of the Institution of Mechanical Engineers, Part B: Journal of Engineering Manufacture, 2010, 224(1), pp.25-36.
[11] PG. Maropoulos, D. Ceglarek, Design verification and validation in product lifecycle, CIRP Annals-Manufacturing Technology, Dec2010, 31;59(2), pp. 740-59.
[12] J. Beaman, E. Morse, Experimental evaluation of software estimates of task specific measurement uncertainty for CMMs, Precision engineering, 2010, 34(1), pp.28-33.
[13] S. Martnez, E. Cuesta, J. Barreiro, B. lvarez, Analysis of laser scanning and strategies for dimensional and geometrical control, The International Journal of Advanced Manufacturing Technology, Jan 2010, 46(5-8), pp.621-9.
[14] B. Boeckmans, Y. Tan, F. Welkenhuyzen, Y. Guo, W. Dewulf, JP. Kruth, Roughness offset differences between contact and non-contact measurements, In Proceedings of the 15th international conference of the European society for precision engineering and nanotechnology, June 2015, pp. 189-190.
[15] KW. Chase, WH. Greenwood, BG. Loosli, LF. Hauglund, Least cost tolerance allocation for mechanical assemblies with automated process selection, Manufacturing review. 1990 Mar, vol 3(1), pp.49-59. [16] E. Kiraci, P. Franciosa, G.A. Turley, A. Olifent, A. Attridge, M.A.
Williams, Moving towards in-line metrology: evaluation of a Laser Radar system for in-line dimensional inspection for automotive assembly sys-tems, The International Journal of Advanced Manufacturing Technology, 2016, pp.1-10.
[17] ASME B89.6.2-1973 (R2003). 1973, Temperature and humidity envi-ronment for dimensional measurement, New York: American Society of Mechanical Engineers.